CENTRE FOR EUROPEAN POLICY STUDIES
WO R K I N G DO C U M E N T NO. 165 AP R I L 2 0 0 1
E
CONOMIC
I
NTEGRATION
BETWEEN THE
EU
AND THE
CEEC
S
:
A S
ECTORAL
S
TUDY
F
RANCESCA
D
I
M
AURO
CEPS Working Documents are published to give an early indication of the work in progress within CEPS research programmes and to stimulate reactions from other experts in the field. Unless otherwise indicated, the views expressed are attributable only to the authors in a personal capacity and not to any institution with which they are associated.
ISBN 92-9079-327-5
E
CONOMIC
I
NTEGRATION
BETWEEN THE
EU
AND THE
CEEC
S
:
A S
ECTORAL
S
TUDY
CEPS W
ORKING
D
OCUMENT
N
O
. 165, A
PRIL
2001
F
RANCESCAD
IM
AURO*AB S T R A C T
Economic integration between the EU and the CEECs has proceeded at high speed over the 90’s, with the main channels of such integration being trade and FDI. Some authors believe that the ‘commercial transition’ is now complete and that a new, deeper phase of integration has started, with growing flows of FDI in the region. Following a gravity-type approach, in this paper I tackle two difficult issues surrounding the EU-CEECs integration: has FDI in the CEECs region substituted EU exports, therefore harming employment at home? Has FDI in the CEECs region been redirected away from similarly attractive countries, such as Spain and Portugal? By using a unique database on FDI broken down by country and by sector, which allows more detailed qualifications than possible in previous work, the answers to these two questions appear to be negative.
Keywords: Foreign Direct Investment, Economic integration, Gravity Model
JEL classification codes: F15, F21, F23.
*
E
CONOMIC
I
NTEGRATION BETWEEN THE
EU
AND THE
CEEC
S
: A S
ECTORAL
S
TUDY
F
RANCESCAD
IM
AURO1. Introduction
The economic integration between the European Union (EU) and the Central and Eastern European Countries (CEECs) has proceeded at high speed in the past eight to nine years. The main channels of such integration have been trade and FDI flows. The EU share in CEECs exports has in fact nowadays reached levels close to 60-70% for nearly all the ten candidate countries (CCs)1, showing that quickly after the collapse of Comecon a massive re-direction of trade towards Western Europe has occurred in the CEECs. Similar figures have been subsequently observed for FDI, whereby the main investors in these countries come from EU member states, Germany in particular.
Economic integration especially between developed and emerging countries could therefore be described as a sequence of events. In the first stages of integration trade appears as the main channel, while subsequently FDI becomes more important. In fact, investing abroad implies a certain long-term commitment for the investor, who is not willing to place his money in an uncertain environment. Deeper integration between countries often means that the emerging country exerts major efforts in reforming its economy, which in turn benefits from foreign investment. At the same time though, deeper integration between countries may create some fears at home; in the context of the EU-CCs relationship, the most frequent complaints are twofold, and derive from the fear that either (i) increasing FDI becomes a substitute for EU exports to the CCs, harming therefore the (employment of the) exporting sector at home, or (ii) FDI to the CEECs may displace FDI going to previous partners, e.g. Spain or Portugal.
The objective of this paper is precisely to look at these two issues in detail, given their importance for the accession debate. Previous work (Brenton and Di Mauro (1999) and Brenton, Di Mauro and Lücke (1999)) on these issues has focused on aggregate data (for both exports and FDI), by using estimations of gravity-type equations. The contribution of this paper is to use a unique sectoral database, available for Germany on a relatively long term
1
basis, that will allow us to detect differences between sectors and to identify which sectors are particularly attractive in the CCs. The methodological tool used throughout the paper is the gravity model, largely and successfully used for trade flows in the past. However, following the work of Brainard (1993), the gravity approach has also expanded to FDI analysis, giving satisfactory results.
The paper is organised as follows: Section 2 illustrates some stylised facts on FDI in the CCs and introduces the issues at stake. Section 3 sets out the theoretical framework for the gravity model, while Section 4 presents the empirical results. Section 5 concludes.
2. Stylised facts
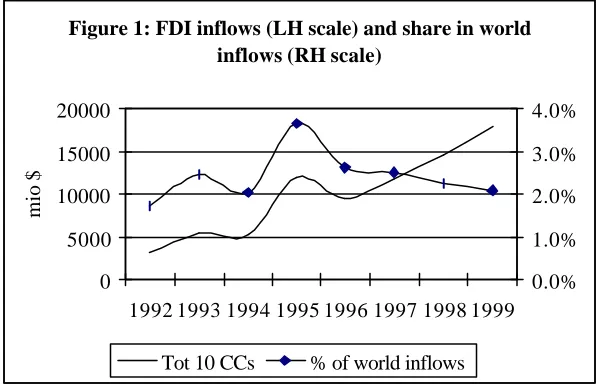
[image:4.612.82.381.398.591.2]Since the opening-up of their economies, the CCs have increasingly redirected their exports towards the EU, away from their previous Comecon partners. Several authors now believe that the ‘commercial transition’ is now complete (Brenton and Gros (1997)) and that a new, deeper phase of integration has started, with growing flows of FDI in the CCs. As can be seen from Figure 1, these countries have witnessed an increase in both their absolute value of inward FDI flows and in their world share.
Figure 1: FDI inflows (LH scale) and share in world inflows (RH scale)
0 5000 10000 15000 20000
1992 1993 1994 1995 1996 1997 1998 1999
mio $
0.0% 1.0% 2.0% 3.0% 4.0%
Tot 10 CCs % of world inflows
Source: World Investment Report (2000), UNCTAD.
Figure 2: FDI inflows per capita - 1998 (US$)
48 247
398
191
112 250
133
92 86 83 181
288 614
0 100 200 300 400 500 600 700
Bulgaria
Czech Rep.EstoniaHungary Latvia
LithuaniaPolandRomania Slovak Rep.
SloveniaPortugalSpain EU15
Source: IMF IFS (1999).
At the sectoral level, data are available for the period 1987-1996 for the ten EU candidates for accession. On average, FDI in manufacturing accounts for 63% of total inflows, while 36% is in services; Figure 3 shows the breakdown within manufacturing. These averages hide large differences across countries. For example, FDI in the food sector represents 80% in Bulgaria and 59% in Latvia, while motor-vehicles gets 45% of total in Czech Republic; Slovakia and Slovenia are particularly attractive for the chemical sector, with 46% and 53% of total FDI respectively. Recent figures display a shift towards more investment in services, probably because of efficiency gains in manufacturing.
Figure 3: Sectoral breakdown of FDI cumulative flows within manufacturing (1986-1997)
Other 19%
Textiles & wearing
7%
Chemicals 16% Motor
vehicles 11%
Machinery 15%
Tobacco 7% Food
26%
Source: Bocconi University (1997).
[image:5.612.81.381.484.693.2]CCs region; within the EU, Germany’s role is predominant, with 43% of total. This predominance of EU countries further explains the potential fears about FDI substituting EU exports or FDI being redirected away from Southern European countries, often heard in Europe. In the ‘substitution’ issue, similarly to the case of American workers perceiving a jobs threat from Mexican ‘maquiladoras’, upon creation of NAFTA, EU workers started to fear it from CCs’ workers, upon greater economic integration between the two regions. In terms of employment, the channel through which the labour market can be affected is two-fold and it is linked to the nature of FDI. On the one hand, when a firm establishes a plant abroad and produces directly in the host market rather than exporting (market-seeking FDI), the export sector at home may contract, with some domestic plants closing down and unemployment rising, if the labour market suffers from rigidities and wages do not adjust consequently. This would be the case with horizontal FDI. On the other hand, when a firm produces abroad in order to take advantage of cheaper labour and export back home (efficiency-seeking FDI), as in the case of vertical FDI, domestic workers may again be left worse-off, especially the unskilled ones, since they are the direct competitors of cheaper unskilled labour abroad. Nevertheless, in both cases we have at least to take into account the effect of intra-firm trade, e.g. in capital or intermediate goods, from the parent firm to the affiliate, since this can fuel demand for labour in the home economy, and therefore offset the negative impact on the final good sector. The net effect is uncertain though, and the issue then becomes an empirical matter.
3. From theory to practice: the gravity model
The traditional theory of FDI tries to explain why firms produce abroad instead of simply servicing the markets via exports. After all, multinational companies (MNCs) experience additional costs in producing abroad: higher costs in placing personnel abroad, communication costs, language and cultural differences, informational costs on local tax laws and regulations, costs of being outside domestic networks; they also incur higher risks, such as the risks of exchange rate changes or even of expropriation by the host country. One theoretical approach, introduced by Dunning (1977, 1981), the “OLI framework”, considers FDI as determined by Ownership, Location and Internalisation advantages which the MNC holds over the foreign producer; when these advantages outweigh the above costs, FDI arises. The so-called “New Theory of FDI” takes inspiration from the OLI approach and refers mainly to the Ownership and Location advantage to introduce MNCs in general equilibrium models, where they arise endogenously. The early literature (Helpman 1984, Helpman and Krugman 1985) was mainly able to explain ‘vertical FDI’, i.e. investment that takes place in order to take advantage of differences in relative factor endowments (hence in factor prices) across countries. Instead, what is observed among developed countries is mainly ‘horizontal’ FDI, because similar types of production activities, owned by MNCs, take place in different countries. This phenomenon is better clarified if multinational activity is not driven by factor endowments differences, but rather by the trade-off between proximity and concentration (Brainard 1993), which constitutes the starting point of the more recent literature. The proximity advantage stems from ‘firm-level’ economies of scale, whereby R&D activity (or any other type of ‘knowledge capital’) is transferable to affiliates and allows MNCs to be closer to the foreign market. The concentration advantage derives from traditional ‘plant-level’ economies of scale, which make it more profitable to concentrate production in one location and then export. Whenever the former outweigh the latter, foreign investment will take place, and this will be more likely the higher are intangible assets relative to fixed costs of opening up an affiliate and the higher are transport costs, which are assumed to be positive and an increasing function of geographical distance in this model. This allows for horizontal FDI, where two-way investment between similar countries occurs, both in terms of absolute and relative factor endowment.
Helpman and Krugman’s treatment of vertical FDI and Brainard’s horizontal one, I will include in the model the following variables2: relative factor endowments, an index of countries’ similarity in size, geographic distance between the partner countries and a measure of the ‘economic space’ between the two countries, given by the sum of the two GDPs. The last variable is included to catch the ‘market-seeking’ aspect of FDI, i.e. when investors produce abroad to sell in the host market and increase their market shares there. Additional variables, such as a common language, a common border, or preferential trade agreements, that may reduce the costs of locating abroad, can be introduced via dummy variables. This specification can easily be recognised as the ‘gravity model’. In contrast to the common view among economists, the gravity model rests on a sound theoretical basis. Maurel (1998) carries out a thorough investigation of its origins, and shows its evolution across the trade theories of Linnemann (1966), Helpman and Krugman (1985) and the empirical studies by Helpman (1987) and Brainard (1993). She also shows how the gravity model applied to trade can be compatible with both the traditional Heckscher-Ohlin and the Helpman and Krugman framework, without becoming a meaningless black box. Given the similarity between trade and FDI in terms of trends, it has also been employed to estimate bilateral FDI flows (see Brenton (1996), Eaton and Tamura (1996), and Brenton and Di Mauro (1999)). The variables specified above are therefore also valid for a gravity equation applied to exports, something, which will be done later in the paper, in Section 4.2. The general form of the gravity equation that I estimate is the following:
∑
+ + + + + += ij ij ij ij k kij ij
ij SUMGDP SIMILSIZE RELENDOW Dist D
Y α β β β β ln γ ε
ln 1 2 3 4 (1)
with the following variable definitions: Yij is the value of FDI or exports from country i
(home country) to country j (host country);
(
i j)
ij GDP GDP
SUMGDP =ln + (2)
+ − + − = 2 2 1 ln j i j j i i ij GDP GDP GDP GDP GDP GDP SIMILSIZE (3) j j i i ij Pop GDP Pop GDP
RELENDOW = ln −ln (4)
2
Distij is the distance between countries i and j, Dkij are dummy variables (mostly country
dummies) used when appropriate.
The ‘economic space’ variable (SUMGDP) is expected to have a positive impact in both the FDI and exports equation. The index of size similarity (SIMILSIZE) takes values between -∞ (i.e. the log of a number near zero) in case of perfect dissimilarity and -0.69 (the log of 0.5) for perfect similarity. Similarity in size should have a positive effect on exports: countries similar in size will trade more, as the Helpman and Krugman theory of increasing returns predicts, trade is of intra-industry nature. I also expect a positive coefficient in the FDI equation, if the New FDI Theory holds true, as those models were motivated by the observation that FDI arises more among similar countries.
Differences in relative endowments (RELENDOW) are measured here by the absolute difference in GDP per capita3; one could question the validity of this proxy, since, as noted in Helpman (1987), this method is accurate when there are only two factors of production (capital and labour) and all goods are freely traded. Better measures would be: GDP per worker, the ratio of capital (gross fixed capital formation) over working population, or that of skilled workers in total employment, as advocated by Wood (1994) for assessing the factor content of trade. I foresee undertaking such refinements in the construction of this variable in the future4. As far as the impact is concerned, a negative coefficient in the exports equation is a sign that Helpman and Krugman’s theory of intra-industry trade (IIT) prevails: trade is not determined by differences in factor composition, as foreseen by traditional Heckscher-Ohlin inter-industry type trade models. For FDI, the story is similar: vertical FDI (equivalent to inter-industry trade) emerges as countries greatly differ in their factor composition – hence showing a positive coefficient, while horizontal FDI (comparable to IIT) is determined by similarity in factor composition, therefore displaying a negative coefficient. One cannot know a-priori, which type prevails and the answer is an empirical one.
As for distance, the effect on exports is clearly negative, being it a proxy for transport costs. On the other hand, FDI theory suggests that firms will invest abroad rather than export provided that trade costs are high. However, this variable may also have a negative coefficient in the FDI equation since the costs of operating overseas affiliates are still likely to rise the
3
Measuring in terms of the simple difference does not change the results.
4
further they are from the MNCs headquarters. Overall though, I expect the coefficient in the exports equation to be higher than that in the FDI equation.
Empirical studies of trade using the gravity model have been widely undertaken and they usually explain a high proportion of the variance. However, the standard error of the estimated equation being always high, it suggests some caution in interpreting the results. Moreover, misspecifications in the gravity equation are not excluded either, as pointed out by Polak (1996) and Matyas (1997), but if a proper specification of the model is ensured, it seems that the gravity equation represents a good way to proceed empirically when trying to explain the geographical distribution of FDI.
4. Empirical analysis
Before addressing the two main issues of the paper (i.e. ‘substitution/complementarity’ between exports and FDI and FDI ‘redirection’), the empirical analysis will begin by delivering a detailed picture of the most attractive sectors in the CCs for German investors. The database that I use (published by the Deutsche Bundesbank) gives a unique breakdown of German FDI stock both by destination country and by sector, in approximately 30 countries per year and in nine ‘macro-sectors’. Data are available from 1985, but I decided to start my analysis in 1992, given that FDI was practically non-existent in the CCs before that date, and end it in 1997. The host countries for German FDI (see the Annex for a detailed list) include EU member states, US, Canada and Japan, various developing countries and three of the CCs (Czech Republic, Hungary and Poland); unfortunately no data are available for the other seven. Nevertheless, these three countries represent on average about 80% of total FDI received by the CCs over the period 1992-1999.
technique used here5. Were the panel balanced, the database should contain 6 x 9 x 32= 1728 observations, but due to missing countries in some years, the available number of observations is 1411.
My main interest lies in the sectoral dimension of the data, i.e. I first want to detect which are the most attractive sectors for German investors in general, and then assess (via country dummies) the specificity of the CC3 considered (Czech Republic, Hungary and Poland), as well as other country groups6. For the general equation I therefore choose to introduce sectoral dummy variables and estimate it as a Fixed Effect Model (FEM). Subsequent equations also include country dummies interacted with sectoral dummies, in a way that will become clear in the next sections of the paper.
The gravity equation that I specify in each following sub-section can in general be described as follows:
ijkt hij h k ij
ijt ijt
ijt
ijkt SUMGDP SIMILSIZE RELENDOW Dist time D
Y =α+β1 +β2 +β3 +β4ln +β5 +δ +
∑
γ +εln (5)
where Yijkt is the value of FDI or export from country i (home country) to country j (host
country) in sector k in year t, and where I have added a time trend (time), sectoral fixed effects (δk) and the usual error term; the other variables are those described in Section 3. 4.1 Sectoral distribution of German FDI in the CC3
This sub-section is designed to give a detailed idea of which sectors are most attractive in the three CCs considered (named CC3), once the common determinants of FDI are taken into account. As mentioned before, the methodology here is the following: I estimate a gravity equation for German FDI stocks over the period 1992-1997, with sectoral dummies and with specific CC3-sectoral dummies. I also include in my equation an EU sectoral dummy, in order to take into account the deeper integration already in place between Germany and the other EU countries.
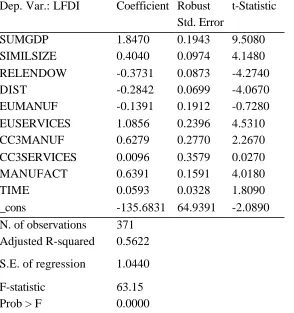
A first specification of equation (5) is to look at the simple breakdown between manufacturing and services, by aggregating data on the four manufacturing and the five services sectors. This will already qualify the type of FDI in the CC3. Table 1 shows the estimation results, where ‘services’ serves as the baseline sector.
5 Heteroscedasticity problems in the data are tackled directly throughout the analysis, either by calculating robust
standard errors or by using the feasible GLS estimator.
6
The gravity variables all have the expected sign: increased ‘economic space’ (SUMGDP) has a noticeable impact on FDI and a positive coefficient is also found for the size similarity variable. Overall, differences in relative factor endowments have a negative impact on FDI; from the theoretical discussion above one can infer that on average, German investors are in general more prone to horizontal than vertical FDI. Finally, distance appears to harm FDI too, something, which is more intuitive in the case of exports.
[image:12.612.80.374.388.701.2]Looking at the coefficients of the dummy variables, the first observation is that FDI in manufacturing appears to be nearly twice as large as in services (exponent of 0.6391). However, the opposite is true for EU countries, where investment in services becomes the prevalent one, while FDI in manufacturing within EU countries is not greater than that observed at a world level. This observation is somehow reversed for the CC3, where, when Germans invest in the CC3, they will tend to do in the manufacturing sector, on average twice as much (exponent of 0.6279) than in any other country of those included. In contrast, FDI in services in the CC3 does not appear to show any specificity.
Table 1: Two-sector breakdown
(White Heteroskedasticity-Consistent Standard Errors & Covariance)
Dep. Var.: LFDI Coefficient Robust Std. Error
t-Statistic
SUMGDP 1.8470 0.1943 9.5080
SIMILSIZE 0.4040 0.0974 4.1480
RELENDOW -0.3731 0.0873 -4.2740
DIST -0.2842 0.0699 -4.0670
EUMANUF -0.1391 0.1912 -0.7280
EUSERVICES 1.0856 0.2396 4.5310
CC3MANUF 0.6279 0.2770 2.2670
CC3SERVICES 0.0096 0.3579 0.0270
MANUFACT 0.6391 0.1591 4.0180
TIME 0.0593 0.0328 1.8090
_cons -135.6831 64.9391 -2.0890
N. of observations 371 Adjusted R-squared 0.5622 S.E. of regression 1.0440
F-statistic 63.15
Prob > F 0.0000
gravity variables SUMGDP, SIMILSIZE and RELENDOW. These interaction terms are never significant, hence revealing that the core determinants of German investors in the CC3 do not deviate from those of other potential host countries.
I can now investigate in more detail the relative attractiveness of the various sectors, by including sectoral, as well as crossed country/sectors dummies. The results of the regressions are reported in Table 2, where the chosen baseline sector is ‘machinery’ (again, coefficients on the dummies should be read as deviations from this sector). The first comment concerns the general sectoral dummies: here again I find a similar picture as in Table 1. Manufacturing sectors all show a significant and positive coefficient (except for motor vehicles), while services have a negative one, the only exception being distributive trade, with a positive and significant coefficient. Secondly, the EU sectoral dummies confirm what was found before, namely that FDI in the EU is predominantly in services, ranging from 3 times (in the case of ‘insurance’) to nearly 15 times (for ‘other financial institutions’) more than in any other country on average. Thirdly, in the CC3, I see that the leading sector in manufacturing is ‘motor vehicles’, where FDI is 7 times higher than in the other manufacturing sectors (exponent of 1.9985). More surprisingly, I find that monetary intermediation plays an important role in the CC3 (nearly 8 times higher), while FDI in holdings is clearly below the other countries’ average.
An explanation of the monetary intermediation performance could come from forward and backward linkages phenomena: German firms establishing in the CC3, e.g. in the motor-vehicle sector, also provide an incentive to their bankers, with whom they have a backward linkage in terms of credit supply, to follow them abroad and open up a branch in the same destination countries. This explanation is even more realistic as financial markets in transition countries are not perceived as the most complete.
Over the period 1992-1997, I can therefore conclude that German FDI in the CC3 has been driven mainly by the manufacturing sector, and by the production of motor vehicles in particular. This occurred in contrast to the EU trend, where German FDI was much more concentrated in services.
Table 2: Sectorial analysis (Cross-sectional time-series FGLS regression)
Dep. Var.: LFDI Coefficient Std. Err. z
SIMILSIZ 0.6610 0.0597 11.0620
RELENDOW -0.3756 0.0483 -7.7760
DIST -0.2361 0.0442 -5.3420
CC3CHEM -0.2653 0.4297 -0.6170
CC3MACHI 0.2987 0.3583 0.8340
CC3MOTOR 1.9985 0.6204 3.2210
CC3ELECT 0.4080 0.3776 1.0810
CC3DISTR 0.7747 0.2734 2.8340
CC3MONET 2.0494 0.7010 2.9230
CC3OTHER -0.5564 0.9655 -0.5760
CC3INSUR 0.2700 0.6951 0.3880
CC3HOLDI -1.7551 0.9568 -1.8340
CHEMICAL 1.3493 0.1889 7.1430
MOTORVEH 0.2137 0.2662 0.8030
ELECTRMA 0.7726 0.1748 4.4210
DISTRIBT 1.4226 0.1462 9.7280
MONETINT -0.4114 0.3184 -1.2920
OTHERFIN -1.5880 0.3181 -4.9920
INSURANC -0.5984 0.2916 -2.0520
HOLDINGS -1.7461 0.3004 -5.8130
EUCHEM -0.3167 0.2449 -1.2930
EUMACHIN 0.1755 0.2122 0.8270
EUMOTOR 0.1014 0.4052 0.2500
EUELECTR 0.0884 0.2257 0.3920
EUDISTRI 0.4257 0.1593 2.6730
EUMONET 1.8268 0.4479 4.0790
EUOTHERF 2.6914 0.4605 5.8450
EUINSURA 1.0938 0.3842 2.8470
EUHOLDIN 1.7122 0.4362 3.9250
TIME 0.0706 0.0228 3.0930
_cons -155.7856 45.1092 -3.4540
4.2 FDI and exports: complements or substitutes?
As already mentioned at the beginning of the paper, closer economic integration between countries – especially through FDI – may cause fears in terms of ‘job loss’ in the home (investor) country. It is therefore the relationship between FDI and employment at home that ought to be analysed, if one wants to draw conclusions on the impact of ‘globalisation’. Two approaches have been followed in the literature until now to tackle this issue: a direct approach and an indirect one. The former usually consists in estimating simple regressions equations of the demand for labour of home-country parent firms, as a function of affiliates net sales (which proxy their production). This implies the necessity to use data on activities of foreign affiliates, which can be done in a consistent way only for the U.S. and Sweden, two countries with such data (see for example Blomström et al. (1997) and Brainard and Riker (1997)). The results usually show a very low substitution between employment at home and in the affiliates.
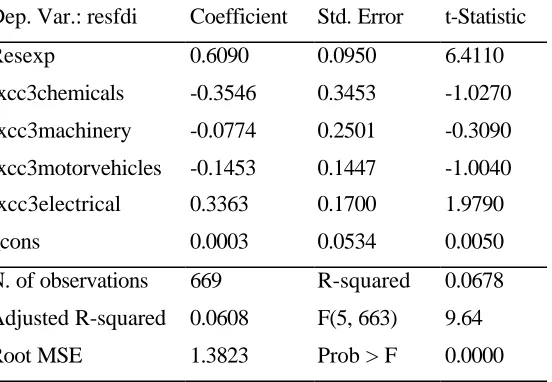
The indirect way to empirically test the impact of FDI on employment is to look at the relationship between exports and FDI. Here the objective is to see whether FDI substitutes for exports, and therefore indirectly harms the exporting sector’s employment at home. The methodology that I adopt takes inspiration from the work of Graham (1996). Two gravity equations are estimated, one for exports and one for FDI at a sectoral level, and then the residuals of the estimation are regressed against each other. The presumption of this method is to remove the influence of the common factors on FDI and on exports, by using gravity equations. A positive correlation between the two residuals is therefore interpreted as a sign of complementarity, since high residuals in exports are associated with high residuals in FDI, and vice-versa. This method is intended only to give a first indication about the relationship between exports and FDI, and should be viewed as a starting point for further analysis.
deviate from this general result. Moreover, a significant complementarity relationship is detected for ‘electrical machinery’ in the CC3.
[image:16.612.85.361.214.405.2]One other method has also been tried, and it gives the same results (available upon request): I run a SURE regression with the FDI and the exports equations, and then look at the correlation matrix of the residuals. The positive coefficient found fails to pass a Breusch-Pagan test of independence, hence suggesting a sign of complementarity.
Table 3: Complementarity vs. substitutability (OLS)
Dep. Var.: resfdi Coefficient Std. Error t-Statistic
Resexp 0.6090 0.0950 6.4110
rxcc3chemicals -0.3546 0.3453 -1.0270
rxcc3machinery -0.0774 0.2501 -0.3090
rxcc3motorvehicles -0.1453 0.1447 -1.0040
rxcc3electrical 0.3363 0.1700 1.9790
_cons 0.0003 0.0534 0.0050
N. of observations 669 R-squared 0.0678
Adjusted R-squared 0.0608 F(5, 663) 9.64
Root MSE 1.3823 Prob > F 0.0000
Previous conclusions on this issue at an aggregate level (Brenton, Di Mauro and Lücke (1998)) are therefore confirmed at this, albeit limited, sectoral dimension. Exports and FDI seem in general to go hand in hand for German investors, and this is also true for the CC3.
4.3 FDI redirection: a myth?
countries to seek access to the Single Market via the European Economic Area, and subsequently to request membership of the EU itself.
This issue of a potential redirection of FDI from Southern European countries will be treated by comparing the amount of FDI received by the two groups of countries, still within the gravity approach, and by including the sectoral dimension. This will enable us to check in which sectors there has been (or not) a redirection of FDI from Spain and Portugal towards the CC3. In particular, I use the gravity model to look at the evolution over time of the bilateral distribution of German FDI and assess whether the increased FDI from Germany to the CC3, in the aftermath of their liberalisation in the 1990s, had any noticeable impact upon foreign investments by Germany in Portugal and Spain.
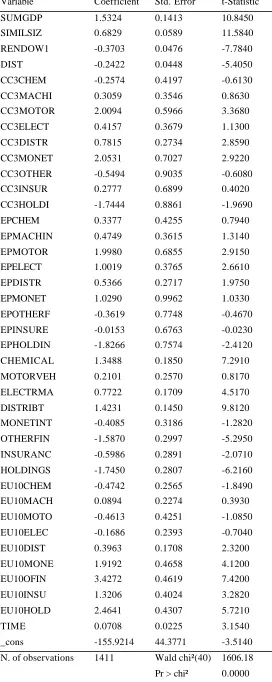
My methodological approach is based upon that of Sapir (1997) who sought to identify whether a domino effect had characterised the impact of European integration upon bilateral trade flows. A gravity equation is estimated for FDI, by including country and sectoral dummies for three groups of partners of German investors: the CC3, Spain and Portugal (EP) and the remaining EU countries. The results are presented in Table 4. One can observe some common features of EP and the CC3: both groups of countries seem to have their strength point in ‘motor-vehicles’ and in ‘distribution’, while the least attractive sector is the same too: ‘holdings’. These results could be interpreted as a first sign of ‘competition’ between the two groups of countries, since they appear to have the same structure of ‘attractiveness’ across sectors.
Table 4. FDI redirection
Variable Coefficient Std. Error t-Statistic
SUMGDP 1.5324 0.1413 10.8450
SIMILSIZ 0.6829 0.0589 11.5840
RENDOW1 -0.3703 0.0476 -7.7840
DIST -0.2422 0.0448 -5.4050
CC3CHEM -0.2574 0.4197 -0.6130
CC3MACHI 0.3059 0.3546 0.8630
CC3MOTOR 2.0094 0.5966 3.3680
CC3ELECT 0.4157 0.3679 1.1300
CC3DISTR 0.7815 0.2734 2.8590
CC3MONET 2.0531 0.7027 2.9220
CC3OTHER -0.5494 0.9035 -0.6080
CC3INSUR 0.2777 0.6899 0.4020
CC3HOLDI -1.7444 0.8861 -1.9690
EPCHEM 0.3377 0.4255 0.7940
EPMACHIN 0.4749 0.3615 1.3140
EPMOTOR 1.9980 0.6855 2.9150
EPELECT 1.0019 0.3765 2.6610
EPDISTR 0.5366 0.2717 1.9750
EPMONET 1.0290 0.9962 1.0330
EPOTHERF -0.3619 0.7748 -0.4670 EPINSURE -0.0153 0.6763 -0.0230 EPHOLDIN -1.8266 0.7574 -2.4120
CHEMICAL 1.3488 0.1850 7.2910
MOTORVEH 0.2101 0.2570 0.8170
ELECTRMA 0.7722 0.1709 4.5170
DISTRIBT 1.4231 0.1450 9.8120
MONETINT -0.4085 0.3186 -1.2820 OTHERFIN -1.5870 0.2997 -5.2950 INSURANC -0.5986 0.2891 -2.0710 HOLDINGS -1.7450 0.2807 -6.2160 EU10CHEM -0.4742 0.2565 -1.8490
EU10MACH 0.0894 0.2274 0.3930
EU10MOTO -0.4613 0.4251 -1.0850 EU10ELEC -0.1686 0.2393 -0.7040
EU10DIST 0.3963 0.1708 2.3200
EU10MONE 1.9192 0.4658 4.1200
EU10OFIN 3.4272 0.4619 7.4200
EU10INSU 1.3206 0.4024 3.2820
EU10HOLD 2.4641 0.4307 5.7210
TIME 0.0708 0.0225 3.1540
countries, for each of the two sub-periods (labelled P1 and P2 in the figures). The graphs only show the value of these country dummies. The way to read the graphs is the following: the height of the histogram bar in each case shows the magnitude of the coefficient on the dummy, whilst the small circles above and below show the relevant (5 per cent) confidence interval. Thus, if the bar lies outside of the relevant upper or lower circle, then the estimated coefficient is statistically significant.
-1.0 -0.5 0.0 0.5 1.0
CC3chemP1CC3chemP2 EPCHEMP1EPCHEMP2 EUCHEMP1EUCHEMP2
-0.8 -0.6 -0.4 -0.2 0.0 0.2 0.4 0.6 0.8
CC3MACHINP1CC3MACHINP2 EPMACHINP1EPMACHINP2 EUMACHINP1EUMACHINP2
Fig.3: motorvehicles -2.0 -1.0 0.0 1.0 2.0 3.0
CC3MOTORP1CC3MOTORP2 EPMOTORP1EPMOTORP2 EUMOTORP1EUMOTORP2
Fig.4: electrical machinery
-1.5 -1.0 -0.5 0.0 0.5 1.0 1.5
CC3ELECTP1CC3ELECTP2 EPELECTP1EPELECTP2 EUELECTRP1EUELECTRP2
Fig. 5: distributive trade
-1.0 -0.5 0.0 0.5 1.0
CC3DISTRP1CC3DISTRP2 EPDISTRP1EPDISTRP2 EUDISTRIBP1EUDISTRIBP2
Fig. 6: monetary intermediation
-2.0 -1.0 0.0 1.0 2.0 3.0
CC3MONETP1CC3MONETP2 EPMONETP1EPMONETP2 EUMONETP1EUMONETP2
Fig. 7: other financial intermediation
-3.0 -2.0 -1.0 0.0 1.0 2.0 3.0 4.0 CC3OTHERFINP1CC3OTHERFINP2 EPOTHERFP1EPOTHERFP2 EUOTHERFINP1EUOTHERFINP2
Fig. 8: insurance
-3.0 -2.0 -1.0 0.0 1.0 2.0 3.0
CC3INSUREP1CC3INSUREP2 EPINSUREP1EPINSUREP2 EUINSUREP1EUINSUREP2
Fig. 9: holdings
-3.0 -2.0 -1.0 0.0 1.0 2.0 3.0
[image:20.612.28.511.22.745.2]5. Concluding remarks
Following a gravity-type approach, in this paper I have tried to tackle two difficult issues surrounding the EU-CEECs integration: has FDI in the CEECs region substituted EU exports, therefore harming employment at home? Has FDI in the CEECs region been redirected away from similarly attractive countries, such as Spain and Portugal? The answer to the first question appears to be negative: exports and FDI seem to go hand in hand as far as German investment is concerned; furthermore, a complementarity relationship is detected for the ‘electrical machinery’ sector between exports and FDI in the CC3.
Concerning the second question, and taking into account the level of available sectoral disaggregation, no redirection appears between FDI going to Spain and Portugal and that going to the CC3. In particular, a reinsuring result is that no redirection appears in the motor-vehicle sector, in contrast to what is often heard. German investors seem to have quickly taken the advantage of moving motor-vehicle plants into the CC3, but without reducing the amount of investment that was already going to Spain and Portugal in the same sector.
A more general result is that FDI in the CC3 is mainly concentrated in the manufacturing sector, while German investors in the EU are more attracted by services. This preference for manufacturing is also visible in Spain and Portugal though, which may confirm the impression that the two groups of countries share a similar structure of ‘attractiveness’ across sectors. However, from an analytical point of view, the existence of this similarity does not seem to cause great competition between the two groups of countries. From a ‘political’ point of view, this similarity should not be the basis for all those who try to prevent the integration process of the CEECs in the EU; on the contrary, economic integration is inevitable the more the CCs develop and close the gap between them and the EU countries, as Spain and Portugal did, following their own accession.
References
Baldwin R.E., Forslid R. and Haaland J. (1995), Investment creation and investment
diversion: simulation analysis of the single market programme” CEPR Discussion Paper
No. 1308, December.
Blomström M., Fors G. and Lipsey R.E. (1997), "Foreign Direct Investment and Employment: Home Country Experience in the US and Sweden" The Economic Journal
November.
Bocconi University (1997), EU Foreign Direct Investments in Central and Eastern Europe
research project for DG III.
Brainard S. L. (1993), A Simple Theory of Multinational Corporations and Trade with a
Trade-off between Proximity and Concentration ,NBER Working Paper No. 4269,
February.
Brainard S. L. and Riker D.A. (1997), Are U.S. multinationals exporting U.S. jobs? ,NBER Working Paper No. 5958, March.
Brenton P. (1996), The Impact of the Single Market on Foreign Direct Investment in theEU
Report for DG II, mimeo.
Brenton P. and Gros D. (1997), “Trade Reorientation and Recovery in Transition Economies”
Oxford Review of Economic Policy, Vol. 13 No. 2, 65-76.
Brenton, P. and Di Mauro, F. (1999), “The Potential Magnitude and Impact of FDI flows to CEECs”, Journal of Economic Integration, 14(1), March, 59-74.
Brenton, P., Di Mauro, F. and Lücke, M (1999), “Economic Integration and FDI: An Empirical Analysis of Foreign Investment in the EU and in Central and Eastern Europe”,
Empirica, Vol. 26, pp. 95-121.
Dunning J. (1977), “Trade, Location of Economic Activity and MNE: A Search for an Eclectic Approach” in Ohlin B., Hesselborn P. And Wijkman P/M/ (eds) The International Allocation of Economic Activity, Macmillan, London.
Dunning (1981), International Production and the Multinational Enterprise, George Allen and Unwin, London.
Eaton J. and Tamura A. (1996), Japanese and US exports and investment as conduit of
growth NBER Working Paper No. 5457, February.
Egger P. (2000), The Determinants of Bilateral Trade and Direct Foreign Investment: A
Dynamic Panel Data Approach Austrian Institute of Economic Research, mimeo.
Graham E. M. (1996), On the Relationship Among FDI and International Trade in the
Manufacturing Sector: Empirical Results for the United States and Japan WTO - Staff
Working Paper RD-96-008, July.
Helpman E. (1984), “A Simple Theory of International Trade with Multinational Corporations” Journal of Political Economy, Vol. 92, No. 31.
Helpman E. (1987), “ Imperfect Competition and International Trade: Evidence from Fourteen Economies” Journal of the Japanese and International Economies, 1.
IMF (1998), International Financial Statistics, Washington D.C..
Linnemann H. (1966), An Econometric Study of International Trade Flows, Amsterdam: North-Holland.
Matyàs L. (1997), “Proper Econometric Specification of the Gravity Model” The World Economy Vol. 20.
Maurel M. (1998), Régionalisme et désintégration en Europe centrale et orientale – Une approche gravitationnelle –, CNRS Economie, Paris.
Polak J.J. (1996), “Is APEC a Natural Regional Trading Bloc? A Critique of the 'Gravity Model' of International Trade” The World Economy Vol. 19, No. 5, September.
Sapir A. (1997), Domino effects in West European Trade, 1960-92 CEPR Discussion Paper No. 1576, February.
Suits D.B. (1984), "Dummy variables: Mechanics vs. Interpretation" The Review of Economics and Statistics Vol. 66, No. 1, February.
UNCTAD (1999), World Investment Report, Geneva.
Wood A. (1994), "Give Heckscher and Ohlin a chance!" Weltwirtschaftliches Archiv Vol. 130, No. 1.
***
AN N E X
Data source: ‘International Capital Links’, Special Publication No.10 Deutsche Bundesbank, various
issues (also on http://www.bundesbank.de ).
Data definition: German outward FDI stock (Classification: NACE Rev. 1).
Treatment of zero values: According to the methodological notes of the Bundesbank publication, zero values mean less than 0.5 but more than nil, hence I replaced them by 0.25, the average value between 0 and 0.5, and kept the observation.
A
BOUT
CEPS
Mission
The Centre for European Policy Studies is an independent policy research institute founded in 1983:
• To produce sound policy research leading to constructive solutions to the challenges facing Europe.
Goals
• To achieve high standards of academic excellence and maintain unqualified independence.
• To provide a forum for discussion among all stakeholders in the European policy process.
• To build collaborative networks of researchers, policy-makers and business across the whole of Europe.
• To disseminate our findings and views through a regular flow of publications and public events.
Assets and Achievements
• Quality research by an international staff of 30 drawn from fifteen countries.
• An extensive network of external collaborators, including some 35 senior associates with extensive
experience working in EU affairs.
• Complete independence to set its own priorities and freedom from any outside influence.
• Ability to anticipate trends and to analyse policy questions well before they become topics of general
public discussion.
Programme Structure
CEPS is a place where creative and authoritative specialists reflect and comment on the problems and opportunities facing Europe today. This is evidenced by the depth and originality of its publications and the talent and prescience of its expanding research staff. The CEPS research programme is organised under two major headings:
Economic Policy
Macroeconomic Policy European Network of Economic Policy Research Institutes (ENEPRI) Financial Markets and Institutions European Credit Research Institute (ECRI)
Trade Developments and Policy Energy for the 21st Century Efficiency in the Pursuit of Collective Goals
Politics, Institutions and Security
Political Institutions and Society The Wider Europe South East Europe Caucasus and Black Sea EU-Russian Relations The CEPS-IISS Security Forum South East European Security Cooperation
Justice and Home Affairs In addition to these two sets of research programmes, the Centre organises a variety of activities within the CEPS Policy Forum. These include CEPS working parties, the lunchtime membership meetings, network meetings abroad, board-level briefings for CEPS corporate members, conferences, training seminars, major annual events (the CEPS International Advisory Council and the awards ceremony of the Bentinck Prize) and internet and media relations.
Centre for European Policy Studies 1 Place du Congrès 1000 Brussels, Belgium