The Journal of Engineering
The 14th International Conference on Developments in Power System
Protection (DPSP 2018)
Detailed analysis of the future distribution
network protection issues
eISSN 2051-3305 Received on 3rd May 2018 Accepted on 11th June 2018 E-First on 29th August 2018 doi: 10.1049/joe.2018.0218 www.ietdl.org
Md Asif Uddin Khan
1, Campbell D. Booth
11Department of Electronic and Electrical Engineering, University of Strathclyde, Glasgow, UK
E-mail: [email protected]
Abstract: This study will present the results of several simulation-based analyses investigating the performance of distribution network protection under a range of future scenarios. It is widely accepted that the integration of a significant amount of distributed generation, often from renewable energy sources and interfaced to the main network via power electronics converters, will be commonplace in the future. Furthermore, at the transmission level, the interconnection of different countries through HVDC links and the decommissioning of many large-scale conventional synchronous generators will result in the power systems becoming progressively weaker in terms of reduced faults level and lower system inertia. This study will, therefore, illustrate and emphasise the challenges and issues that arise in future distribution networks protection due to reduced system strength, fault level and the changing nature of the contribution (both in terms of magnitude and possibly delay in provision) to fault levels and the possible impact this may have on traditional overcurrent-based protection schemes by building a simple model of distribution network in Simulink, MATLAB. In addition to that, the paper will also discuss some potential solutions as novel schemes to tackle the arising protection related problems.
1 Introduction
In response to climate change, highly reliable and secure power supply with economical solutions, the conventional power system network is changing and moving towards a future power system network where increase amount of recent technologies is expected. These technologies include penetration of distributed generators (DGs), the interconnection of HVDC links within different countries and energy storage where all of them will be connected to the networks through power electronics converters. Although the technologies are supposed to be a blessing for the consumers, it is creating some challenges in future power system networks which are needed to be dealt. Thus, this paper focuses on the protection related issues that are created in distribution networks and tried to quantify as well as illustrate through the aid of simulated scenarios of built Simulink model of the distribution network.
Provision of voltage support, reduction in power loss, improved power quality, improved reliability, the release of additional transmission and distribution capacity and so on can be considered as the positive impact of the addition of recent technologies in the power system [1]. However, the negative impacts of the technologies are predominated as they are replacing the conventional synchronous generation. The affected areas and the challenges in the future power system networks are summarised in [2–4] and mostly affected areas are System inertia, Rate of Change of Frequency (RoCoF), Frequency Containment, System Stability, Control System, Voltage management and Protection.
The protection of the power system has been vastly affected due to changes in short-circuit level (SCL) and leads to the incapability of the existing protection techniques – differential protection, distance protection and overcurrent protection to operate accurately. In addition to that, the authors of [5–10] concluded several different protection related problems which may cause severe damage to the system. Sympathetic tripping, coordination between relays, sensitivities of the relays, unintentional islanding, over and under voltage issue and failure of auto-reclosers are some of them.
To solve the vulnerable situation due to the inadequateness of the conventional protection system, several types of research have been carried out to suggest an alternative approach or novel protection scheme. As part of it, the authors of [11–13] have discussed directional overcurrent scheme where the fault is
detected through both voltage and current sensors. On the other hand, Horak and Babic [14] suggest positive, negative and zero sequenced fault detection techniques by numerical directional overcurrent scheme. However, the scheme seems very expensive anyway due to its additional requirements for fault detection. Thus, in [15] it is suggested that current-only directional overcurrent scheme (CDO) which only requires current sensors to detect the forward and backward directions of the fault current.
Adaptive protection scheme can also be a solution for the mitigation of future power system protection. The scheme is based on the philosophy of controlling the different functionality of the protection system based on the situation that arises in the system so that future issues in the power system can be overcome [15]. However, different approaches to adaptive characteristic implementation and algorithms are discussed in [16–19]. The main drawback with the scheme is, it is economically expensive as communication links between the relays along with synchronised phasor measurement of current with DG location and CBs are required.
Another scheme that can overcome the future challenges is called Agent-based protection scheme. The scheme is based on the distribution equipment and communication network, which incorporates both directional overcurrent and adaptive protection scheme. The main advantage of the scheme is; it can work during unavailability communication networks. In that case, the decision will be taken based on the last available information and fault current magnitude which seems very suitable for distribution network protection [20, 21].
Furthermore, in [22, 23] a new protection scheme called radial basis neural network based scheme is discussed. Although the scheme seems inexpensive and suitable for the distribution network, it has a very complex algorithm and owing to the fact that much research has not been done on the scheme, there is a question about the practical feasibility of the scheme.
2 Test distribution network with overcurrent
protection
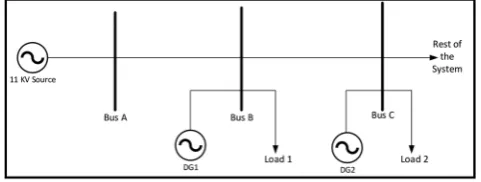
Simulink model of the test distribution network are shown in Figs. 1 and 2, respectively.
The built distribution network in Simulink (Fig. 2) is a three-bus network where Bus A is connected to the 11 kV three-phase synchronous generator representing infeed from the transmission level and Bus B and Bus C are connected to the DGs and load. The network is built, using the UK's distribution networks parameters (fault level of grid infeed, the internal impedance of the generators and distribution line impedance) based on the model specification described in [23, 24].
In order to justify and verify the protection problem, a scheme is required for the system so that the change of characteristics can be observed. Thus, the most generic form of protection scheme for the distribution network, overcurrent protection scheme has been chosen and an overcurrent relay has been built in the Simulink, as shown in Fig. 3.
Three inverse definite minimum time (IDMT) overcurrent relays are used on three different buses and each relay requires time multiple settings (TMS), plug settings (PS) and output from current transformer (CT) as input and provides tripping signal (will it trip or not) and operating time (if operating) as output. Each relay has different settings based on the fault level or fault current calculated for each bus. The settings for each bus are shown in Table 1.
The naming of the relays is based on the name of the buses, that is Relay A is installed at Bus A and same goes for Relays B and C. In addition to that, each of the relays is designed in a way so that upper relay can operate for the downstream relay's backup. The characteristics curve for each relay with settings described in Table 1 is shown in Fig. 4.
3 Simulation scenarios
Various future scenarios have been tested in the built Simulink model of the distribution network such as variation in grid infeed, fault resistance and fault capacity of the DGs. The results for each of the scenarios have been shown with the aid of overcurrent relay characteristic and the location of the faults are also being varied for each case.
The simulation of the network can be divided into two categories. First, variation in system parameters, which is variation in grid infeed and fault resistance. Second, variation in DG location and DG capacity.
4 Variation in fault level of grid infeed
Transmission grid infeed is a crucial part of the system as fault current level largely depended on it. The fault level from grid infeed for UK's distribution network is 250 MVA [23]. To observe the overcurrent relays characteristic and fault current level at different buses, the fault level from grid infeed has been changed from 25 to 250 MVA in the step of 25 MVA.
4.1 Fault current level at different buses
Due to the variation of fault levels of grid infeed, the fault current at different buses changes and the observations are shown in Table 2.
As the fault level of grid infeed is decreasing from 250 MVA, the fault currents in the other buses are also decreasing. It is known that the protection scheme largely depends upon the fault current level of different buses. Thus, it has a direct impact on the
protection settings and may not respond to the faulty condition while required due to the low fault current contribution from grid infeed.
4.2 Relay operating characteristic
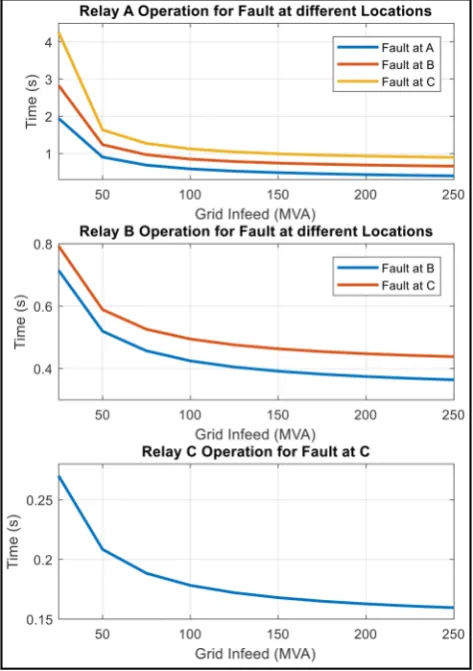
Change in grid infeed will have a significant impact on the overcurrent relay's operating time. So, to observe the impact of grid infeed variation on relay's tripping time, fault has been injected at distinct locations of the system and named as ‘Fault C’ (located after Bus C), ‘Fault B’ (located between Buses B and C) and ‘Fault A’ (located between Buses A and B). Each relay's operating characteristic due to variation in grid infeed for different locations of the fault is shown in Fig. 5.
As mentioned earlier, the upstream relay will provide back-up by operating comparatively slowly for the downstream fault and thus, relays A and B (in Fig. 5) both are operating for the faults at B and C. However, as the relay C is the most downstream relay, it will operate only for fault C.
It can be seen that (from Fig. 5), as the fault level is decreasing, the operating time for all relays are increasing. According to the protection settings, the safe operating time is 0.5 s (500 ms). If a relay takes more time than that, it causes serious hazards to the system due to the flow of high current for a longer period and from Fig. 5, the observation is relay B will take >0.5 s when grid infeed is <70 MVA and for relay A, it is around 100 MVA. Moreover, in the case of backup protection, the operation is further slow.
5 Change in fault resistance
Fault resistance is another important parameter of the power system network. The fault resistances for each fault, ‘Fault A’, ‘Fault B’ and ‘Fault C’ are varied between 0.001 (∼0) and 5 Ω. However, fault level of grid infeed is kept constant at 250 MVA to observe the impact on relay operation under the change of fault resistance. So, if fault resistance varies due to the addition of DG, then the operating time of the relay's will change and operation of the relays are shown in Fig. 6.
The operational time of the relays is increasing as the fault resistance increases and in case of relay B, the operating time is crossing the limit of 500 ms for fault B, when fault resistance is 3 Ω. Similarly, for relay A, when fault resistance is 1 Ω, the operating time is >500 ms for fault A.
6 Variation in DG location and short-circuit
capacity
To observe the adverse effect on protection system due to the addition of DGs in the system, the locations and short-circuit capacity of the DGs are varied and the observation is presented in terms of fault current variation and operating time of the relays of different locations.
6.1 Fault current level at different buses with DG
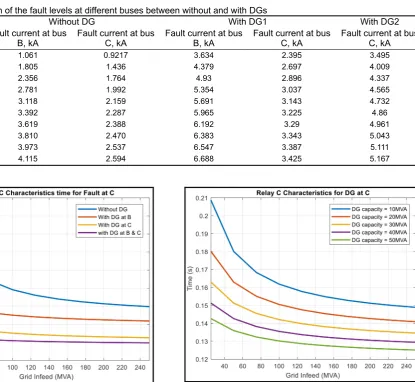
The location of the DGs will be varied between buses B and C. It is obvious that the fault current level will increase in the buses if grid infeed has not been changed. However, DGs are now supplying power to the load and as a result, grid infeed will decrease. Thus, effects will be observed by adding DG in bus B first, then turns come for DG at C. DG at B is named as ‘DG1’ and DG at C is named as ‘DG2’. The short-circuit capacity for each DG is assumed 50 MVA and the comparison of the fault current change between without DG and DG1 & DG2 is shown in Table 3.
[image:2.595.44.285.51.142.2]From Table 3, the observation is the addition of DGs has an impact on the downstream buses fault level but not on the upstream buses. Thus, bus A fault current level remains unchanged for both DG1 and DG2 and bus B fault level will remain unchanged for DG2. However, while grid infeed is high the change on fault current is low, in the case of DG1 38.5% and for DG2, change is 50%. However, during low grid infeed, change is very high, for both DG1 and DG2, change is around 70%.
6.2 Relay operating characteristics
[image:3.595.311.557.50.288.2] [image:3.595.45.284.50.146.2]As the addition of DGs in downstream buses does not have an impact on upstream buses, the operating time of relay A will remain same for fault A. However, change can be observed due to fault level variation of buses B and C. The operating time of all relays will change according to the variation of the fault level of Fig. 2 Simulink model of the test distribution network
Fig. 3 Overcurrent relay used in the system for bus A
Table 1 Relay settings
CT ratio PS TMS
relay A 400:1 1.75 (175%) 0.17 s relay B 200:1 1.25 (125%) 0.15 s relay C 200:1 1 (100%) 0.06 s
Fig. 4 Relay characteristics
Table 2 Fault levels at different buses Grid infeed,
MVA Fault current atbus A, kA Fault current atbus B, kA Fault current atbus C, kA
25 1.287 1.061 0.9217 50 2.573 1.805 1.436 75 3.86 2.356 1.764 100 5.147 2.781 1.992 125 6.433 3.118 2.159 150 7.72 3.392 2.287 175 9.007 3.619 2.388 200 10.290 3.810 2.470 225 11.580 3.973 2.537 250 12.870 4.115 2.594
Fig. 5 All relay's operating time vs. grid infeed for a fault at distinct locations
[image:3.595.63.279.174.317.2] [image:3.595.308.551.319.753.2] [image:3.595.46.283.346.682.2]buses B and C. The relay C characteristics with DGs at various locations are shown in Fig. 7 and relay C characteristics due to variation in short-circuit capacity of DG2 are shown in Fig. 8.
Figs. 7 and 8 prove that the addition of DGs and variation of DG SC capacity decreases the operating time of the relays. In Fig. 7, it can be observed that, as bus C is the most downstream bus, the addition of DG at any location will decrease its operating time and the same goes for variation in the SC capacity of the DGs which can be seen in Fig. 8 for relay C. Similar effect can be observed for other relays too for both cases.
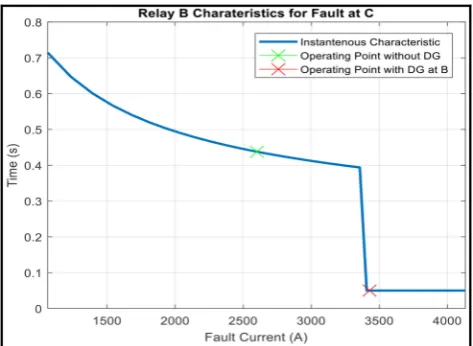
6.3 Sympathetic tripping with instantaneous protection
Generally, overcurrent protection has characteristic of time grading which takes a longer time to operate in case of an upstream relays fault condition. As a result, the high fault current flow could damage the system during that extra time. Hence, an instantaneous characteristic is provided with the relay so that it can operate very fast during the high fault current flow. However, due to additional fault currents supplied by the DGs, false tripping with instantaneous overcurrent protection can take place. A simple case of that false operation is shown in Fig. 9.
Fig. 9 shows the relay B characteristics with the instantaneous element. The figure also contains two points on it for comparing operational time for relay B with and without DG while fault is at C. However, the DG in B supplies extra fault current to fault C causing an increase in total fault currents, forcing the relay B to lose it backup coordination with relay C and operates instantaneously. In this way, relay B operates faster compare to relay C, which is sympathetic tripping for relay B even though the fault is at C.
6.4 Nuisance tripping for under-voltage protection
If the fault in the system is not cleared within 0.5 s, then the under-voltage protection of the DG will be activated because of the 80% (or more than that) reduction in nominal value of the voltage. If the fault is in the bus A, the voltage of all downstream buses will be reduced and due to the addition of DGs, fault contribution from the grid infeed will be low. Thus, the operating time will be higher as shown in Fig. 5. Fig. 10 shows the three-phase voltage for bus B when the fault is at A.
While DG1 is connected to the network and grid infeed is around 120 MVA. The relay is taking >0.5 s to operate. In the meantime, voltage is reduced to around 3500 V (peak) from 8800 V (peak). Fault started at 0.1 s and finished at after 0.65 s due to the operation of relay A. In this time, under-voltage protection for DG1 will activate and isolate the system, which is a nuisance tripping for the system as it is operating due to the slow operation of the other overcurrent relay.
7 Probable solutions of the issues
[image:4.595.128.544.43.425.2]The coordination problem of the relays can be mitigated by changing the settings of the relays, depending upon the DG locations, the short-circuit level of the DG and change in grid infeed. The adaptive protection scheme and the agent-based protection scheme, in this case, seem prospective solutions to the problems. In both schemes, the settings of the relay can be changed depending on the situation. At the same time, both schemes can be the solution for the under-voltage nuisance tripping because the problem is highly influenced by the grid infeed level. When the infeed level is low, the fault level of bus A will also be very low. The low fault level means fault currents will be decreased which leads the slow operation of the relay A. Thus, to remove such Table 3 Comparison of the fault levels at different buses between without and with DGs
Grid infeed, MVA Without DG With DG1 With DG2
Fault current at bus
B, kA Fault current at busC, kA Fault current at busB, kA Fault current at busC, kA Fault current at busC, kA
25 1.061 0.9217 3.634 2.395 3.495
50 1.805 1.436 4.379 2.697 4.009
75 2.356 1.764 4.93 2.896 4.337
100 2.781 1.992 5.354 3.037 4.565
125 3.118 2.159 5.691 3.143 4.732
150 3.392 2.287 5.965 3.225 4.86
175 3.619 2.388 6.192 3.29 4.961
200 3.810 2.470 6.383 3.343 5.043
225 3.973 2.537 6.547 3.387 5.111
[image:4.595.41.306.58.426.2]250 4.115 2.594 6.688 3.425 5.167
[image:4.595.310.550.115.430.2]situation from the network, it is necessary to change the settings of the relay according to the grid infeed and DG's short-circuit capacity.
Again, sympathetic tripping is the biggest issue of all other challenges. A potential solution to the problem is to use directional overcurrent relays in place of the conventional overcurrent relays. Directional overcurrent can detect the fault in reverse direction. Thus, it will be able to detect the fault contribution from DG2 which is causing unnecessary tripping for relay B before the operation of relay C for a fault at C. In addition to that, another solution can be agent-based protection scheme, which suggests connecting relays in both ends of the bus. This also can provide correct operation of relay A by accurately measuring fault contribution from DG2. One more advantage of the scheme is, it can communicate with other relays. Thus, it is possible to make the relay A operate faster than the relay B in case of contribution from DG2 is very high.
8 Conclusion and future work
The renewable energy based power stations are small-scale generators based system and generally connected to the distribution network of the power system network through power electronics converters. These increased number of distribution generators causing some negative issues and challenges for the power system network. The paper identified the issues and challenges that are arising in the future distribution network, focusing on the protection related issues. Also, discussed some solutions in the form of novel protection schemes that can replace or modify the existing protection schemes so that the challenges in the future power system networks can be solved.
The simulation and analysis for this paper had been limited owing to the allocated space for this paper. So, there is a vast opportunity to do further works on the simulations and develop some other solutions too, based on works related to the issues mentioned in this paper. Unwanted Islanding scenario, single-phase fault demonstration and implementation of other protection scheme are some of the simulation scenarios which can be tested. Furthermore, practical implementation of the simulated scenarios in Real Time Digital Simulator and comparison between real and simulated results can also be done.
9 References
[1] Coffele, F., Booth, C., Burt, G., et al.: ‘Detailed analysis of the impact of distributed generation and active network management on network protection systems’. 21st Int. Conf. on Electricity Distribution, CIRED, Frankfurt, 6–9 June 2011
[2] National Grid: ‘System operability framework 2014’, September 2014 [3] National Grid: ‘System operability framework 2015’, September 2015 [4] National Grid: ‘System operability framework 2016’, September 2016 [5] Barker, P. P., Mello, R. W. D.: ‘Determining the impact of distributed
generation on power systems. I. Radial distribution systems’. 2000 Power Engineering Society Summer Meeting, Seattle, WA, USA, 2000, vol. 3, pp. 1645–1656
[6] Cheung, H., Hamlyn, A., Wang, L., et al.: ‘Investigations of impacts of distributed generations on feeder protections’. 2009 IEEE Power Energy Society General Meeting, Calgary, Canada, July 2009, pp. 1–7
[7] Baghzouz, Y.: ‘Voltage regulation and overcurrent protection issues in distribution feeders with distributed generation - a case study’. Proc. of the 38th Annual Hawaii Int. Conf. on System Sciences, Big Island, HI, USA, January 2005, pp. 66b–66b
[8] Elmathana, M. T. M.: ‘The effect of distributed generation on power system protection’, Master's thesis, University of Exeter, Exeter, UK, September 2010
[9] Kauhaniemi, K., Kumpulainen, L.: ‘Impact of distributed generation on the protection of distribution networks’. 2004 Eighth IEE Int. Conf. on Developments in Power System Protection, Amsterdam, The Netherlands, April 2004, vol. 1, pp. 315–318
[10] Ogden, R., Yang, J.: ‘Impacts of distributed generation on low-voltage distribution network protection’. 2015 50th Int. Universities Power Engineering Conf. (UPEC), Stoke-On-Trent, UK, September 2015, pp. 1–6 [11] Bertrand, P.: ‘Directional protection equipment’, 1998. Available at: http://
www.schneiderelectric.com
[12] Gan, Z., Elangovan, S., Liew, A.: ‘Microcontroller based overcurrent relay and directional overcurrent relay with ground fault protection’, Electr. Power Syst. Res., 1996, 38, (1), pp. 11–17
[13] Phadke, A., Thorp, J.: ‘Synchronized phasor measurements and their applications’, in ‘Power electronics and power systems’ (Springer, New York, NY, USA, 2008, 1st edn.), pp. 197–221
[14] Horak, J., Babic, W.: ‘Directional overcurrent relaying (67) concepts’. 2006 IEEE Rural Electric Power Conf., Colleges Station, TX, USA, 2006, pp. 1–8 [15] ‘IEEE guide for protective relay applications to transmission lines’, IEEE Std
C37.113-2015 (Revision of IEEE Std C37.113-1999), June 2016, pp. 1–141 [16] Coffele, F., Booth, C., Dysko, A.: ‘An adaptive overcurrent protection scheme
for distribution networks’, IEEE Trans. Power Deliv., 2015, 30, (2), pp. 561– 568
[17] Choi, J. H., Nam, S. R., Nam, H. K., et al.: ‘Adaptive protection schemes of distributed generation at distribution network for automatic reclosing and voltage sags’. 2008 IEEE Int. Conf. on Sustainable Energy Technologies, Singapore, November 2008, pp. 810–815
[18] Papaspiliotopoulos, V. A., Korres, G. N., Hatziargyriou, N.: ‘An adaptive protection infrastructure for modern distribution grids with distributed generation’, Cigre Sci. Eng., 2017, 7,
[19] Phadke, A. G., Thorp, J. S.: ‘Computer relaying for power systems’ (Wiley, Hoboken, NJ, USA, 2009, 2nd edn.)
[20] Perera, N., Rajapakse, A. D.: ‘Agent-based protection scheme for distribution networks with distributed generators’. 2006 IEEE Power Engineering Society General Meeting, Montreal, Canada, 2006, p. 6
[21] Xiangjun, Z., Li, K. K., Chan, W. L., et al.: ‘Multi-agents based protection for distributed generation systems’. 2004 IEEE Int. Conf. on Electric Utility Deregulation, Restructuring and Power Technologies Proc., Hong Kong, China, April 2004, vol. 1, pp. 393–397
[22] Zayandehroodi, H., Mohamed, A., Shareef, H., Mohammadjafari, M.: ‘A new protection scheme for distribution network with distributed generations using radial basis function neural network’, Int. J. Emerg. Electr. Power Syst., 2010,
11, (5), DOI: 10.2202/1553-779X.2611
[23] Haggis, T.: ‘Network design manual. E-ON Central Networks’, December 2006
[24] KEMA Limited: ‘Review of international network design standards, practices and plant and equipment specifications’. 2009. Accessed on: 8 August 2017
[image:5.595.46.283.48.221.2]Fig. 9 Operating points of relay B instantaneous characteristics curves with and without DG while the fault is at C
[image:5.595.44.284.258.403.2]