by
Riwanto Tirtosudarmo
A thesis submitted in partial fulfilment of the requirements for the degree of Master of Arts in Demography in The Australian National University.
Canberra, March 1984.
people return people
sailing out to sea to catch fish after the storm;
setting out for the jungle to fell trees return with heavy loads;
but of those going to town to snare illusions no one ever returns
Ajip Rosidi (Teeuw, 1979: 216)
I owe many debts of gratitude to the people who have helped me during the preparation and writing -up of this thesis . In particular, I would like to aknowledge and thank Dr. Paul Meyer and Dr. Lorraine Corner for their supervision and assistance. In addition, I am very grateful to Dr. Dean Forbes for his advice and suggestion; Dr. Siew En Khoo for her supervision at the early stages of my writing; Dr. Peter McDonald, Dr. Suharso and Dr. Ray Kirkland for encouraging me to study in Australia.
Many thanks also go to Dr. David Lucas who introduced me to the area of population studies; Dr. Terry Hull who permitted me to use the IPDP facilities during my writing of this thesis. I wish to thank Ms. Christine McMurray, Mrs. Jenny Widdowson, Mrs. Pat Quiggin, Ms. Caroll Mehkek, my friends Evasius K. Bauni and Brett Hough, and the staff of the Menzies Library for their help during my work in the Australian National University.
I also would like to thank the Australian Government for offering me a scholarship and the National Institute of Economic and Social Research (Leknas-LIPI) for permitting me to study and use their data for my thesis. Finally, my gratitude goes to my wife, Indira Saraswati (who decided 'to migrate' to Canberra to accompany me) and my daughter Anggariti for their companionship during my stay in Australia.
This thesis deals with migration decision making in the province of East Java, Indonesia. The bulk of migration research in Indonesia can be classified into three approaches: behavioural, economic and structural. A review showed that each approach tends to focus on a limited aspects of the phenomenon resulting in partial knowledge and failure to adequately comprehend the migration decision as a whole.
In this study migration decision making has been viewed from an integrated approach. The primary source of data concerned both migrants and non-migrants who were selected as respondents in a 1981 survey. The secondary source of data was information on the demographic, social and economic changes that formed the context of population movements in the study area.
The various structural changes in East Java during the last 30 years, in spite of creating a dichotomy between the rural 'push' and the urban 'puli' at the societal level, also affected the individual, either directly or indirectly by changing the costs and benefits of migration. The young, educated and never married population would be more likely to migrate than their counterparts because they were able to adapt more easily to the new situations that resulted from structural changes in the society. In addition, the presence of relatives and friends in urban destinations played an important role in the migration decision. Thus, the nature of migration decision making in East Java was basically a process of interaction between the individual, economy and society.
AKNOWLEDGEMENTS ... iv
ABSTRACT ... v
LIST OF TABLES ... viii
LIST OF MAPS AND FIGURES ... x
CHAPTER I: INTRODUCTION 1
1.1 Aim and Scope of the Study 1 1.2 Data Sources and Limitations 4
1.3 Study Design 9
1.4 Outline of the Thesis 11
CHAPTER II: REVIEW OF LITERATURE ON MIGRATION DECISION
MAKING 12
2.1 Introduction 12
2.2 The Behavioural Approach 15
2.3 The Economic Approach 19
2.4 The Structural Approach 24
2.5 Conclusion 29
CHAPTER III: EAST JAVA: ITS SETTING AND CHANGES 30 3.1 Population Densities and Distribution 30 3.2 Plantation and Agricultural Changes 35 3.3 Urbanization and Industrialization 42
3.4 Conclusion 47
CHAPTER IV: THE CHARACTERISTICS OF MIGRANTS AND NON-MIGRANTS 48 4.1 Migrants and Non-migrants in Current Place of
Residence 49
4.1.2 Education and Occupation 53
4.2 Migrants: The First Move 56
4.2.1 Age, Sex and Marital Status 56
4.2.2 Education and Occupation 59
4.3 Migrants: The Last Move 61
4.3.1 Age, Sex and Marital Status 62
4.3.2 Education and Occupation 64
4.4 Summary 66
CHAPTER V: DECISION TO MIGRATE AND TO STAY 68
5.1 Introduction 68
5.2 Decision to Migrate: The First Move 70 5.3 Decision to Migrate: The Last Move 78 5.4 Moving to Current Place of Residence 84
5.5 Decision to Stay 88
5.6 Summary 91
CHAPTER VI: SUMMARY AND CONCLUSION 93
6.1 Introduction 93
6.2 A General Review of the Current Theoretical
Approach 94
6.3 Research Findings 95
6.4 Conclusion 98
REFERENCES 101
APPENDIX A 108
APPENDIX B 109
APPENDIX C 110
APPENDIX D 114
Table Page
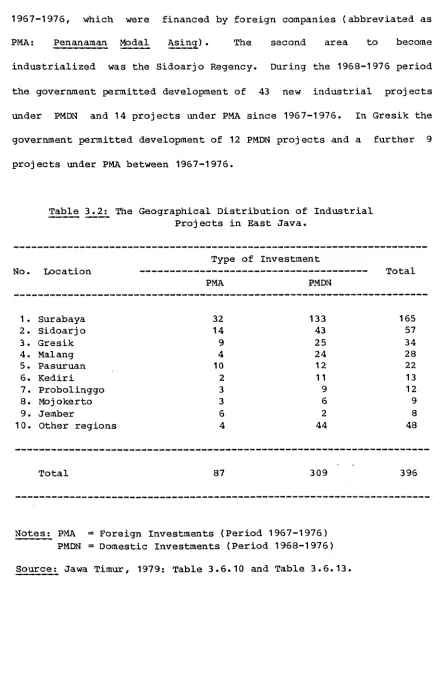
3.1 Population Size and Growth among Regions in East Java 34 3.2 The Geographical Distribution of Industrial Projects
in East Java 44
4.1 Percentage distribution of migrants and non-migrants by age, sex and urban/rural nature of places of
residence in 1981 50
4.2 Percentage distribution of migrants and non-migrants by marital status, sex and urban/rural nature of place
of residence in 1981 52
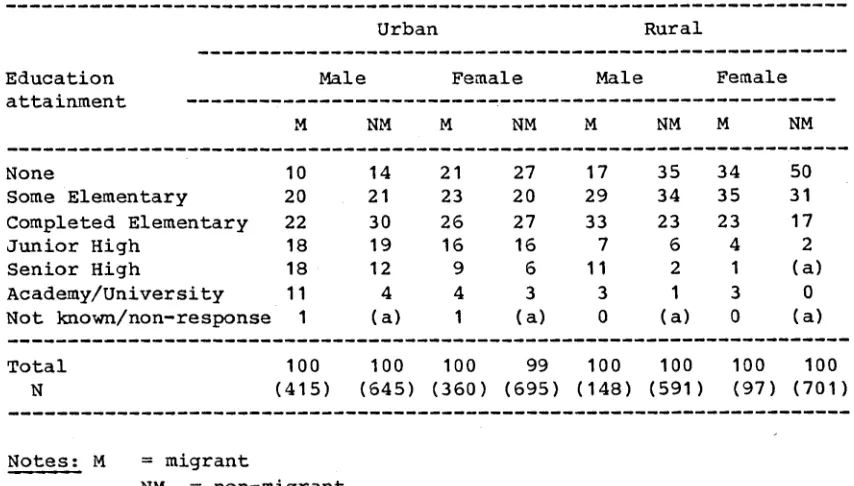
4.3 Percentage distribution of migrants and non-migrants by educational attainment, sex and urban/rural nature
of place of residence in 1981 54
4.4 Percentage distribution of migrants and non-migrants by occupation, sex and urban/rural nature of residence
in 1981 55
4.5 Percentage distribution of migrants by age at first
move and sex 57
4.6 Percentage distribution of migrants by marital status
and sex before and after first move 58 4.7 Percentage distribution of migrants by school enrolment
and sex before and after first move 59 4.8 Percentage distribution of migrants by occupation and
sex before and after first move 60
4.9 Percentage distribution of migrants by age at last move
and sex 63
4.10 Percentage distribution of migrants by marital status
and sex before and after last move 63 4.11 Percentage distribution of migrants by school enrolment
and sex before and after last move 64 4.12 Percentage distribution of migrants by occupation and
sex before and after move 65
70 5.2 5.3 5.4 5.5 5.6 5.7 5.8 5.9 5.10
residence before first move
Percentage distribution of all migrants by person who decided on the first move, sex and urban/rural nature
of place of residence before first move 72 Percentage distribution of all migrants by person who
accompanied, sex of migrants and urban/rural nature of
place of residence before first move 74 Percentage distribution of all migrants by reason for
choosing locality, sex and urban/rural nature of place
of residence after first move 77
Percentage distribution of migrants who made more than one move by reason for the last move, sex and urban/rural nature of place of residence before last move 79 Percentage distribution of migrants who made more than
one move by person who decided on the last move, sex of migrants and urban/rural nature of place of residence
before last move 81
Percentage distribution of migrants who made more than one move by person who accompanied, sex and urban/rural
nature of place of residence before last move 83 Percentage distribution of all migrants by source of
information about current place, sex and urban/rural
nature of current place of residence 86 Percentage distribution of all migrants by relatives
or friends living in current place at the time of the last move, sex and urban/rural nature of current place
of residence 87
Percentage distribution of non-migrants by reasons for never moving, sex and urban/rural nature of place of
residence in 1981 89
Map/Figure Page
Map 1 : East Java showing Regencies and Municipalities 6 Figure 1: Schematic Representation of a Potential Mover's
Decision to Stay In, or Move From, a West Javan
Village 16
Figure 2: Decision-Making to Stay in or to Move from a Dukuh
Community 18
Figure 3: Scheme of the Decision to Migrate 21 Figure 4: Structural Setting of Rural-Urban/Urban-Rural
Mobility 26
Map 2 : Population Densities in East Java 32
Introduction
1.1 Aim and Scope of the Study.
As with the other social sciences, the study of population mobility is relatively new in Indonesia. Apart from the fact that the social sciences constitute a new frontier for Indonesian scholars, the constraints of studying migration may have been greater because of the existence of various types of population mobility, and the wide area over which these occur in Indonesia. Since the early 1950's, however, there has been a growing interest among Western social scientists in the migration behaviour of some ethnic groups in Indonesia.
In the early 1950's Indonesia experienced a 'baby booin' that reflected the relatively stable political situation of the country after the turmoil of the revolution and the first decade of nation building. The emphasis of government policies was on building the nation's political structure while economic policies were implemented to improve the sluggish economy after 350 years of colonization by the Dutch. 'Green revolution' technology, which flourished in some other developing countries, was also adopted to increase rice production in Java. The result, however, was not always successful.
After the New Order government took power in 1966, Indonesia gave high priority to economic development. In the middle 1960's, Indonesian economic conditions had deteriorated significantly: production and investment in key sectors had fallen; the government budget deficit reached 50 per cent; export earnings were down; and inflation had turned into hyperinflation. Within 3 years the new government had achieved economic stability. Inflation, which had reached an annual rate of 650 per cent in 1966, was reduced to below 10 per cent in 1969. This success permitted the government to confidently launch its first five-year plan for the years 1969-1974.
growth of agriculture, which was 3.8 per cent per year. The rapid industrialization since 1967 has been due to the government's open door policy in inviting foreign companies to invest their capital in Indonesia. The new industries using modern technology resulted in a drastic decline of indigenous industries which mostly employed manual workers. The relatively faster growth of the non-agricultural sector has led to a widening income gap between the industrial and agricultural sectors and an increase in social and economic, as well as political, problems. Resentment of the government's economic strategy, which was economically and politically creating a wide gap between the elite and the majority of the people, was a source of student unrest and led to the 1974 riots in Jakarta ('Malari') as well as nationwide student protests against the government in 1978.
The decline of the agricultural sector in rural areas, which had been closely related to agricultural policies since the 1950's, and the rapid industrialization concentrating in some urban areas from the late 1960's exacerbated rural to urban population movement. As noted by Nitisastro ( 1970: 128), from the early 1950's urban areas had experienced a rapid population growth, particularly Jakarta.
largest city in the country and provides a focus for regional development as well as for population mobility within the province. Specifically, this study aims to:
(1) examine the demographic and socio-economic characteristics of migrants and non-migrants in East Java;
(2) determine the role of individual factors in the decision taken to migrate or not to migrate; and
(3) determine the role of societal factors in the process of migration decision-making.
1.2 Data Sources and Limitations.
The primary source of data for this study is the 1981 Migration Survey conducted by the National Institute of Economic and Social Research (LEKNAS). The survey covered three provinces, namely East Java, Bali and South Sulawesi (LEKNAS LIPI, 1981: Volume I)
In general, the survey focused on the following issues: (1) the patterns, streams and types of movements and their
mutual relationships in particular contexts;
(2) the demographic and socio-economic characteristics of both the mobile and non-mobile population;
(3) the attitudes and perceptions pertaining to migration of both movers and non-movers.
(4) the causes and consequences of different types of
movement in relation to both areas of origin and of destination; and
The definition of migrants in this study refers to the working definition used in the survey, that is, someone who resided in a place for at least 6 months other than the place where he or she usually resided. The classification of rural and urban areas refers to the definition used in 1980 Census. According to the Central Bureau of Statistics (Sigit and Sutanto, 1983: 129-158) a village was considered as having an urban status if it met the following criteria: (1) the population was 5,000 or more persons per square kilometre; (2) more than 25 percent of households were directly dependent on individuals working outside the agricultural sector; and (3) eight or more of the list of sixteen designated 'urban facilities' were present (see Appendix A). All other villages were considered as rural areas. The weakness of applying the 1980 urban definition in this study is the fact that some villages which were considered urban areas in 1980 may previously have been rural, say 20 years ago, when the respondent originally migrated. Since 1950 many urban areas have been growing rapidly so urban boundaries have been reclassified (Evans, 1983). This is an obvious weakness of using the 1980 definition in this study but unfortunately there was no way of determining the urban or rural
This survey was intended to provide, by means of probability sampling of the study population, estimates of migration by (1) first order settlement (largest city in the province), (2) intermediate cities, (3) other urban areas, and (4) rural areas. The sample design is multi-stage stratified probability sample of the adult population aged 15-64 in East Java province. The sample size of this survey was 4,000 households, where in each household one individual respondent was selected. However only 3881 cases were available for analysis since some questionnaires which were incomplete or contained errors were excluded. Details about sample selection are given in Appendix C, and the specific questions used here are shown in Appendix D.
As stated earlier, this study will focus on migration decision making. A subset of variables related to the migration decision have been selected to allow analysis of this issue. The questions selected asked about the main reason for moving or staying, the identity of the person who decided on the move and the person who accompanied the respondent on the move, the reason for choosing the destination place and the sources of information and kind of assistance that the migrants received at the place of destination. The analysis will be confined to the first and the most recent movements made after 1950.
The 1950 has been chosen as a cut-off point because since the early 1950's the political situation has been relatively calm, allowing the government to initiate various public policies (i.e. education, public health, agricultural development). These policies have resulted in an increasing awareness of alternative opportunities that led to a rising volume of population mobility within the country
Data on reasons for moving are often criticized on a number of grounds. The following paragraphs summarize the main criticisms compiled by Fawcett and De Jong (1981: 8-9).
(1) Reasons given for a move in the past may be different from the reasons that would have been expressed at the time of the move
(i.e., they may be rationalizations that are influenced by
subsequent events, or the original reasons may not be remembered accurately).
(2) Reasons for moving are an oversimplification of the complex
factors that are actually considered in migration decisions (i.e., respondents in a survey are likely to mention one salient or
dominant consideration without reflecting upon, or expressing, the 'secondary motivation' or various constraints and
facilitators).
(3) Systematic biases influence survey responses on reasons for moving (i.e., the respondent may want to appear 'rational' to the
interviewer and he is likely to express only those reasons he regards as socially and culturally acceptable).
(4) Some people really do not know why they migrate, so reasons given are meaningless (i.e., a move may be made impulsively or for sub-conscious emotional reasons).
(5) Reasons for moving implicitly suggest an individual decision process and this may be misleading (i.e., persons other than the one being interview may have a decisive influence or the move may be impelled by circumstances not clearly recognized by the individual).
historical, normative, structural or ecological factors that are not reflected in the individual's world).
The criticism of the validity of the respondent's given reasons for moving can to some extent be reduced by the use of questions that are open ended, allowing the respondent to express their main reasons freely rather than making a choice from a pre-determined list of reasons. Probing and combination with other questions (such as reasons for choosing locality, who was mainly responsible for the decision, and reasons for not moving among stayers) may provide more comprehensive information about the migration decision and meet some of the criticisms. However, it must be noted that all of these data were collected as part of a lengthy questionnaire which raises questions about the quality of data and the degree of detail that can be expected in responses to such open-ended questions.
With regard to the criticism that the stated reasons for moving are irrelevant to an understanding of the causes of migration (point 6), this study utilises secondary sources of data (i.e. censuses, regional statistics) as well as other research findings from fields such as sociology, agriculture, economics and anthropology to analyze the causes of migration behaviour from broader societal perspectives.
1.3 Study Design
decision to move or to stay and (2) the choice of destination among various alternatives. In the methodological issues related to the analysis of migration decisions it is possible to distinguish between macro and micro level studies. Macro studies describe the broad pattern of movement for geographic areas and population aggregates, whereas micro studies focus on the individual and/or the family as the unit of analysis in describing and explaining migration analysis. In the macro studies migration can be explained in terms of levels but not of who migrates. On the other hand, micro level studies can better explain why one person moves while another does not. According to De Jong and Gardner (1981), macro level studies are superior in describing broad patterns of migration whereas micro level studies are superior in explaining migration behavior.
Based on the above propositions, this study aims to link the survey findings (the survey was designed on the assumption that respondent answers are the key to the migration decision) with other information on structural change at the societal level of the study area.
1.4 Outline of the Thesis
CHAPTER 2
Review of Literature on Migration Decision Making
2.1 Introduction
The theory of migration, and more particularly the theory of migration decision making, derives mainly from Western experience. Analysis based on evidence drawn from Third World Countries is relatively recent. This review will focus on the studies of migration decision making based on the experiences of the Less Developed Countries, specifically of Indonesia.
Since the 1970's there has been a growing interest in population mobility in Indonesia. In fact, the study of population movement in Indonesia began during the Dutch colonial era. The Dutch historians, Vollenhoven and Leur, as quoted by Hugo (1980:97) summarized patterns of migration during pre-colonial Indonesia as being of three main types :
(1) colonization by large groups of migrants from one region who settled in another region (i.e. the Javanese movement into the Banten and north coastal regions of Sundanese West Java); (2) migration of individuals, particularly traders, who settled in
port cities;
From the sixteenth century until the later part of the nineteenth century there was a gradual increase in the number of Europeans, whose activities had considerable influence on the pattern of migration in Indonesia. During the colonial period, in addition to movement due to the impact of colonization, there was also large-scale migration by people from the highly mobile ethnic groups of the Outer Islands, such as the Minangkabau, Bugis, Banjarese, Makassarese and Madurese.
Since the early 1950’s some Western anthropologists have paid more attention to the migration of selected Indonesian ethnic groups. Among these are Cunningham (1958), Bruner(1961), Vredenbregt (1964), Lineton (1975) and, more recently, an Indonesian sociologist, Naim(1980). The principal theme that emerged from these various studies of the mobility of particular ethnic groups was that the patterns of mobility exhibited were apparently due to a tradition of migration or to traditional pressures within these ethnic groups. The value of such an explanation to the interpretation of migration at the
regional and national level, however, must be considered limited.
In 1971 the second national census was conducted, providing an opportunity to study the streams, volume, and pattern of migration not only at the regional level but also at the national level. Two conventional types of migration estimates can be obtained from the 1971 census data. These are refered to respectively as 'lifetime' migration (persons living outside their province of birth) and
Among these are Speare (1975), Montgomery (1975), Sundrum (1976), and Titus (1978).
In addition to the growing number of studies based on the population census, there have also been a number of studies based on survey research. The focus of these studies is varied, such as urbanization in the primate cities, particularly Jakarta (Castles, 1967; Papanek, 1975; Temple, 1974; Jellinek, 1977; Hugo, 1978); adjustment of migrants to cities (Suharso et al, 1976; McCutheon, 1978); the lives of poor rural migrants in Jakarta (Papanek, 1975; Temple, 1974; Jellinek, 1977); the determinants of migration (Hugo,
1973; Mantra, 1981); occupational mobility (Steel, 1982); the relationship between migration and fertility (Gey, 1981); and last but not least, circulation and commuting (Papanek, 1975; Temple, 1975; Jellinek, 1977; Forbes, 1979; Hugo, 1978; Koentjaraningrat, 1973; Mantra, 1981). Almost all these studies were based on a western view of migration. Forbes (1981: 69), in his critique of population mobility research in Indonesia said that :
....the way in which it is treated is in part determined by the implied theoretical structures with which it is analyzed, and these in turn are at least partly a product of the method and tools with which academic researchers have studied mobility.
by Julian Wolpert (1965, 1966), a human geographer. In Indonesia this approach was applied in Hugo's and Mantra's studies. The economic approach became widely used after being tested by Harris and Todaro (1970) in analysing rural-urban migration in African countries. It was adjusted by Temple (1974) in searching for an appropriate theory for rural-urban migration in Indonesia. The structural approach was introduced by McGee (1978) in analysing rural-urban migration in Southeast Asian countries. In Indonesia it was used by Titus (1973) for analysing interregional migration, and Forbes (1979) for analysing rural-urban migration in South Sulawesi.
2.2 The Behavioural
Wolpert (1955: 161) views migration as :
...a form of individual or group adaptation to perceived changes in environment, a recognition of marginality with respect to a stationary position, and a flow reflecting an appraisal by a potential migrant of his present site as opposed to a number of other potential sites.
The simple behavioural theory considers that population movement results from an individual or group deciding that the perceived total benefits accruing from a move outweigh its anticipated costs and the benefits foregone at alternative locations.
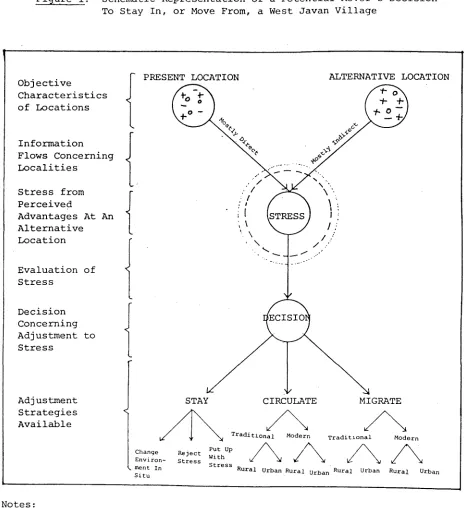
Figure 1 : Schematic Representation of a Potential Mover's Decision To Stay In, or Move From, a West Javan Village
Objective
Characteristics of Locations
Information Flows Concerning Localities
Stress from Perceived
Advantages At An Alternative Location
Evaluation of Stress
Decision Concerning Adjustment to Stress
Adjustment Strategies Available
PRESENT LOCATION ALTERNATIVE LOCATION
.STRESS
lECISIOl
STAY CIRCULATE MIGRATE
Change Environ ment In Situ
Reject Stress
Put Up With Stress
A
Rural Urban Rural -jrban Rural Urban Rural Urban
N o t e s :
-t Advantage at a Locality
Disadvantage at a Locality
o Neutral Factor at a Locality
---- --- Individual Characteristics
... ... ••• Community Norms
Influencing Information Received and Evaluation of Stress by a Potential Mover
[image:26.557.65.535.77.585.2]In his study of population mobility in West Java, Hugo (1978) explained the movement of population, either permanent or non-permanent, as a response to environmental stress. Some people will make a choice to 'stay' and these will include those who passively accept the stress and decide that their present location is the best after all.
The potential mover feels some stress concerning his present location when he receives information about an alternative location that indicates that he/she may be better off in some respect if he/she moved to that place. Figure 1 shows that either in the present or the alternative location, the objective characteristics of the location have positive, negative, or neutral values. If a migrant perceives that the advantage at an alternative location exceeds the advantage in the present location stress is felt. The migrant would evaluate the stress and decide whether to stay and cope with the stress? stay in the present and circulate; or migrate permanently to the alternative location where he/she may be better off.
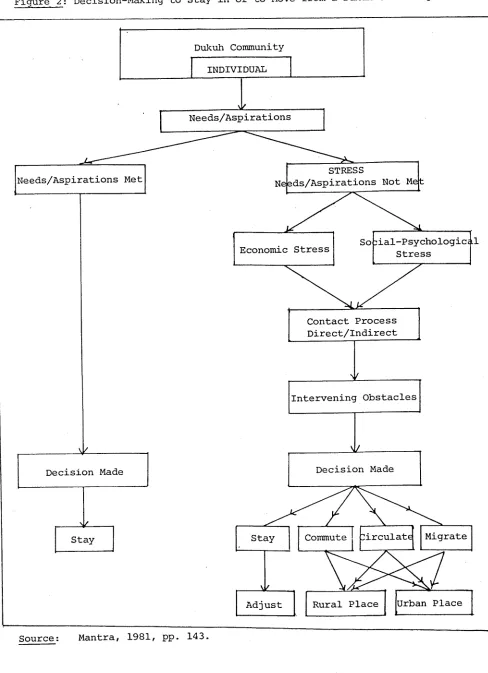
Figure 2: Decision-Making to Stay in or to Move from a Dukuh Community
Dukuh Community INDIVIDUAL
Needs/Aspirations
STRESS
Needs/Aspirations Met Needs/Aspirations Not Me
:ial-Psychological Economic Stress Stress
Contact Process Direct/Indirect
Intervening Obstacles
Decision Made Decision Made
Migrate Commute
Urban Place Rural Place
Adjust
[image:28.557.51.539.66.739.2]In his study (see Figure 2) Mantra divided stress into economic and social-psychological categories. Economic stress results from either local problems of livelihood or from overall dissatisfaction with various aspects of village life. Social-psychological stress, on the other hand, derives from the existence of various types of obligations incurred within the family, dukuh society, or through
'being a member of the Indonesian Republic' (1981: 140-141).
Mantra (1981) discovered three types of population mobility among Javanese villagers. These were commuting, circulation, and migration. Commuting and circulation were a common occurrence and were not viewed by villagers as unusual action. According to Mantra, economic needs in the two dukuh underlay population movement but did not fully explain it. Social and kinship ties, the desire for further education, and the perception of opportunities at other destinations were often an integral part of the decision to move or to stay (Mantra, 1981:169).
2.3 The Economic Approach
In 1970/ Harris and Todaro published an economic model of rural-urban migration that was derived from their experience of the Third World (Harris and Todaro, 1970). The model attempts to explain continuing high rates of rural-urban migration in Less Developed Countries despite considerable unemployment in urban areas. The Harris-Todaro model includes both urban-rural wage differentials and the rate of urban unemployment as key variables. It focuses on a measure of expected wage differentials (including both actual urban-rural income differentials and the level of urban unemployment) rather than actual differentials as the major factor influencing the potential migrant's decision to move. It predicts that rural people will continue to move to urban areas as long as the expected urban wage exceeds the rural wage.
According to Harris and Todaro (1970: 126-142) temporary unemployment is tolerated because migrants are prepared to sacrifice present earnings (in agriculture) for the chance of obtaining a high wage urban job. High levels of urban unemployment are explained by the migrant's desire to maximise lifetime (rather than current) earnings.
F
i
g
u
r
e
3
:
S
c
h
e
m
e
o
f
t
h
e
D
e
ci
s
i
o
n
t
o
M
i
g
ra
t
[image:31.557.57.537.70.742.2]On the rural side these include the system of land tenure; the structure of farm input and output prices; the availability of feeder roads and local marketing facilities; the magnitude, terms and accessibility of rural credit; the degree of under (or, more likely, over) valuation of foreign exchange rates; and the relative price structures (terms of trade) between agricultural and industrial commodities.
On the urban side, factors such as the structure of modern sector wages; the level of urban unemployment (and thus, the probability of finding modern sector jobs); the size of the urban traditional (informal) sector; the nature of linkages between urban modern and traditional sectors; the extent to which limited modern sector jobs are allocated (rationed) by educational certification; and the availability and costs of urban housing, food, and social amenities all tend to influence, directly and indirectly, the decision to migrate.
Finally, the costs of moving (both actual and opportunity) and, especially, the ease with which unemployed migrants can support themselves or be supported by relatives and friends in the city while they engage in their job-search activities provide the final major component of the decision to migrate.
models from the works of Beals, Sahota and Todaro, Temple presented his own view, which differs from Todaro's.
Temple's structural model (1974) depends in part on the social relation of the Indonesian family and village, and not exclusively on prices, wages, and other impersonal market information which were the key variables in the former studies. Compared with the seminal work of Todaro, which is based on an African case study that assumes that a worker migrates from a low productivity rural job to the so-called
'urban traditional sector', Temple (1974: 119) argued that :
In the African case, the unskilled rural worker stays in the traditional sector until he attains a more permanent modern sector job. In Indonesia, the migrant most often comes from overt rural unemployment; he goes straight to 'work' in the 'scavenger sector' where he waits for higher paying employment in the 'traditional sector'. In the African case, a person can always find employment in the rural areas, the main problem is low wages.
People leave villages when they no longer can find work, and they move to the location where personal connections provide the highest probability of finding employment (Temple, 1974: 193 ) .
Although Temple has explored the basic nature of much Indonesian migration, his study is limited to Jakarta and his hypothesis has not been tested, and needs further research, at the village level particularly, to elaborate on the behaviour of those who do not migrate.
2.4 The Structural Approach
The principal theme of this approach is locating population mobility in Third World countries in the context of wider structural changes occurring within those countries. Amin (1974) has used this approach in analysing rural-urban mobility in African countries, arguing that modern labour migration in West Africa can best be understood as a reflection of the uneven impact of capitalist expansion upon tribal societies
Following Amin, McGee (1973) tried to build a structural model of rural-urban mobility for South and Southeast Asian Countries.
In the context of the peripheral economies of South and Southeast Asia, this process (rural-urban migration) appears to be best conceptualized within the framework of the well-established dualistic model of the economic organization of these underdeveloped countries. (McGee,
1978: 211).
countryside, but the work of Geertz (1963) drew attention to the existence of a dual economic structure in urban areas as well.
Geertz, in his work on social change and economic modernization in two Javanese towns (quoted in McGee, 1978: 211) pointed out that:
...the town was divided between a firm-centered economic sector where trade and industry occur through a set of impersonally defined social institutions which organize a variety of specialized occupations with respect to some particular productive or distributive end, and a second sector labelled the bazaar economy based on the independent activities of a set of highly competitive traders who relate to one another mainly by means of an incredible volume of ad hoc acts of exchange.
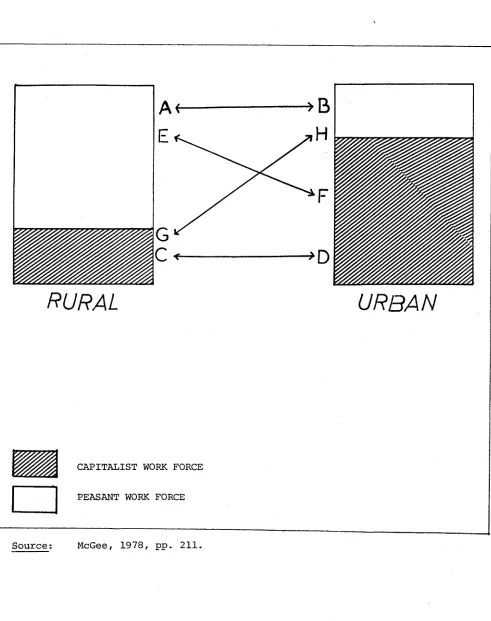
Based on this conceptual framework and other studies (Chayanov, 1966; Franklin, 1965; 1969), McGee proposed a structural model of rural-urban migration, as set forth in Figure 4. (Mote: In figure 4, the relative proportions of the capitalist sector and the peasant sector in the countryside and in the city represent the number of workers in each system).
Figure 4: Structural Setting of Rural-Urban/Urban-Rural Mobility
RURAL
URB A N
CAPITALIST WORK FORCE
PEASANT WORK FORCE
[image:36.557.23.514.122.743.2]The second type of rural-urban mobility, C - D, involves a shift from the capitalist sector of the countryside to the capitalist sector of urban areas. Third, there is a movement from the rural peasant sector to the urban capitalist sector, E - F. This was the major migratory stream occurring during the urban transformation of the Western Countries. In South and Southeast Asia at the moment this form of migration appears to be made up of two main types of migrants. The first type is the migrant who has been educated too well for the countryside; the second type is the unskilled person who has been forced off the land. Movement from the urban capitalist sector back to the rural peasant sector, E - F, is largely retirement migration (or return migration). Finally, movement between the capitalist sector of the countryside and the informal sector of the urban areas, G - H, is not common, except when prices of primary products fall dramatically.
Titus classified a province as centre or periphery based on the presence of such economic activities. In addition, every region was assessed on the existence of 'attraction factors' (i.e. employment opportunities, regional per capita income, urban attraction) or 'expulsion factors' (i.e. rural population pressure, ecosystem instability, lack of education facilities, political upheavals).
Titus (1973) showed that the greatest mobility together with net in-migration was to be found in the economic 'boom' provinces of both the centre type (Jakarta, North Sumatera) and the relatively developed periphery type (South Sumatera, Riau, East Kalimantan). The lowest mobility and a zero migration balance was to be found in the isolated and still largely self-sufficient periphery type of province (i.e. East and West Nusatenggara). The highest mobility together with net out-migration appeared in the highly integrated but stagnating peripheral provinces close to centre groups (i.e. West Sumatera, Central Java, and Yogyakarta).
2.5 Conclusion
The purpose of this review of the existing literature is to find a base for the most appropriate approach to Indonesian migration studies, more specifically to studies of the process of migration decision making in Indonesia. The above three approaches can be combined to obtain a better understanding of migration in Indonesia.
The behavioural approach (and the economic approach) views the process of migration decision making in terms of the individual's behaviour, regardless of whether this behaviour is rational or irrational. Both emphazise the role of the individual in making his/her judgment or choice as a response to the stresses posed by the environment or as a perception of the differentials between current wage earnings and expected wage earnings in the future. Their focus on the role of the individual as an agent of movements almost ignores the structural changes in the wider society, although these often provide an explanation of the changing circumstances that produce the stresses to which individuals react.
CHAPrER III.
EAST JAVA : ITS SETTING AND CHANGES
This chapter deals with the main societal aspects of East Java which forms the context of the population movement in the study area. The aspects that are considered critical in structuring the population movement in East Java are : ( 1) the unbalanced population densities and distribution between municipalities and regencies; (2) the agricultural changes in rural areas; and (3) the unequal industrial development between regions. An examination of these aspects will place the analysis of migration decision making in the broader context of social and economic changes in the society.
3.1 Population Densities and Distribution
M
ap
2
:
Po
pu
l
a
t
i
o
n
D
e
n
s
i
ti
e
s
i
n
E
as
t
Jav
a
1
0
0
In 1971 the population density in East Java was 533 persons per square kilometre and this increased to 609 persons per square kilometre by 1980 (Jawa Timur, 1981, pp. 15). As is shown in Map 1, the most densely populated area was the Mojokerto Municipality to the southwest of Surabaya, followed by Malang Municipality, the Surabaya Municipality and the Pasuruan Municipality, all of which had a density greater than 5,000 persons per square kilometre. The population density among other municipalities was between 3,000 and 5,000 persons per square kilometre. The concentration of population in the municipalities arises because, as urban centres, municipalities are centres of the government administration, industry, and other social and economic activities. On the other hand, population density among the regencies, which are mostly rural areas, is much lower than in municipalities. Among the regencies average population densities ranged between 400 and 1400 persons per square kilometre. As can be seen in Map 1, the low density regencies were Banyuwangi, Situbondo, Pacitan, and Bondowoso. Sidoarjo and Kediri regencies had more than
T a b l e 3 . 1 : P o p u l a t i o n S i z e a n d G r o w t h among R e g i o n s i n E a s t J a v a
P o p u l a t i o n
No. R e g i o n s S i z e A n n u a l G r o w t h
1961 1971 1980 1 9 6 1 - 1 9 7 1 1 9 7 1 - 1 9 8 0
R e g e n c i e s
1. P a c i t a n 4 3 1 , 0 2 2 4 7 6 , 5 6 2 4 7 8 , 0 3 7 1 . 0 2 0 . 0 3 2 . P o n o r o g o 6 9 9 , 8 6 5 7 3 8 , 7 5 6 7 8 3 , 3 8 1 0 . 5 5 0 . 6 5 3 . T r e n g g a l e k 4 3 8 , 8 5 7 5 2 1 , 2 7 9 5 6 4 , 5 4 2 1 . 7 6 0 . 8 8 4 . T u l u n g a g u n g 6 7 5 , 3 4 9 7 5 9 , 8 5 0 8 3 3 , 3 2 3 1 . 2 0 1 . 0 2 5 . B l i t a r 8 3 9 , 9 5 2 9 5 0 , 8 0 2 1 , 0 3 7 , 2 5 8 1 . 2 6 0 . 9 5 6 . K e d i r i 9 1 8 , 0 3 6 1 , 0 8 0 , 6 9 5 1 , 2 3 5 , 2 6 5 1 . 6 6 1 . 4 8 7 . M a l a n g 1 , 4 7 4 , 1 0 6 1 , 7 6 7 , 0 5 5 2 , 0 4 5 , 9 3 9 1 . 81 1 . 6 3 8 . Lumaj a n g 6 5 7 , 4 8 7 7 8 6 , 6 2 8 8 7 4 , 5 1 6 1 . 8 3 1 . 17 9 . J e m b e r 1 , 5 0 1 , 7 6 3 1 , 7 0 6 , 2 7 1 1 , 8 8 1 , 0 9 1 1 . 3 0 1 . 0 8 1 0 . B a n y u w a n g i 1 , 0 6 3 , 5 3 3 11, 3 0 4 , 3 6 7 1 , 4 2 0 , 8 3 7 2 . 0 8 0 . 9 5 1 1 . Bondowoso 5 0 3 , 4 6 0 5 5 4 , 2 2 9 6 1 2 , 1 6 0 0 . 9 8 1 . 10 1 2 . S i t u b o n d o 4 3 2 , 0 4 7 4 7 0 , 1 0 7 5 2 5 , 0 4 6 0 . 8 6 1 . 2 2 1 3 . P r o b o l i n g g o 6 5 6 , 0 0 7 7 5 6 , 3 7 5 8 6 6 , 3 1 8 1 . 4 5 1. 51 14 . P a s u r u a n 7 2 9 , 3 6 7 8 7 2 , 7 9 2 1 , 0 3 4 , 9 6 7 1 . 8 3 1 . 8 9 1 5 . S i d o a r j o 5 4 1 , 0 5 1 6 6 7 , 6 3 9 8 5 4 , 2 9 8 2 . 1 5 2 . 7 5 1 6 . M o j o k e r t o 4 9 4 , 4 9 2 5 9 6 , 1 8 5 7 0 5 , 5 9 6 0 . 9 1 1 . 8 7 1 7 . J o m b a n g 6 8 6 , 3 6 2 8 1 2 , 4 8 5 9 4 1 , 9 8 8 1 . 7 2 1 . 6 4 1 8 . Ng an j uk 6 7 5 , 9 0 6 7 7 4 , 5 9 0 8 8 2 , 8 3 2 1 . 3 9 1 . 4 5 1 9 . Ma d i u n 5 0 9 , 4 2 8 5 8 3 , 9 3 4 6 4 0 , 5 6 1 1 . 3 9 1 .02 2 0 . M a g e t a n 4 9 8 , 4 3 5 5 5 7 , 0 8 1 6 0 8 , 8 2 0 1 . 1 3 0 . 9 8 2 1 . Ngawi 5 8 2 , 3 1 7 6 9 4 , 0 7 9 7 6 9 , 2 8 6 1 . 7 9 1 . 14 2 2 . B o j o n e g o r o 7 0 8 , 5 7 1 8 6 2 , 4 2 8 9 9 9 , 4 1 8 1 . 9 9 1 . 6 4 2 3 . T u b a n 6 3 8 , 1 8 4 7 4 8 , 6 5 7 8 7 1 , 8 9 8 1 . 6 3 1 . 6 9 2 4 . Lamongan 7 7 2 , 5 9 9 9 0 9 , 0 3 8 1 , 0 4 9 , 9 5 6 1 . 5 6 1 . 6 0 2 5 . G r e s i k 6 6 6 , 0 0 2 61 0 , 9 4 4 7 2 9 , 0 3 9 0 . 9 3 1 . 9 7 2 6 . B a n g k a l a n 5 7 4 , 3 4 8 6 3 1 , 4 5 5 6 8 8 , 3 6 2 0 , 9 6 0 , 9 5 2 7 . Sampang 4 8 4 , 8 8 6 5 3 5 , 6 1 5 6 0 4 , 5 4 1 1 . 01 1 . 34 2 8 . P a m e k a s a n 3 9 6 , 4 1 3 4 5 5 , 3 6 2 5 3 9 , 0 5 5 1 . 4 2 1 . 8 6 2 9 . Sumenep 6 9 4 , 5 4 7 7 6 2 , 6 1 6 8 5 4 , 9 2 5 0 . 9 5 1 . 2 7
M u n i c i p a l i t i e s
3 0 . K e d i r i 1 5 8 , 9 1 8 1 7 8 , 8 6 5 2 2 1 , 8 3 0 1 . 2 0 2 . 4 0 3 1 . B l i t a r 6 2 , 9 7 2 6 7 , 8 5 6 7 8 , 5 0 3 0 . 7 6 1 . 6 2 3 2 . M a l a n g 3 4 1 , 4 5 2 4 2 2 , 4 2 8 5 1 1 , 7 8 0 2 . 1 7 2 . 1 4 3 3 . P r o b o l i n g g o 6 8 , 8 2 8 8 2 , 0 8 8 1 0 0 , 2 9 6 1 . 7 9 2 . 2 4 3 4 . P a s u r u a n 6 3 , 4 0 8 7 5 , 2 6 6 9 5 , 8 6 4 1 . 7 5 2 . 7 0 3 5 . Mo j o k e r t o 5 1 , 7 3 2 6 0 , 0 1 3 6 3 , 8 4 9 1. 51 1 . 5 2 3 6 . Ma di un 1 2 3 , 3 7 3 1 3 6 , 1 4 7 1 5 0 , 5 6 2 1 . 0 0 1 . 1 1 3 7 . S u r a b a y a 1 , 0 0 7 , 9 4 5 1 , 5 5 6 , 2 5 5 2 , 0 2 7 , 9 1 3 4 . 4 8 2 . 9 6
T o t a l 2 1 , 9 2 3 , 0 2 0 2 5 , 5 2 6 , 7 1 4 2 9 , 1 8 8 , 8 5 2 1 . 5 9 1 . 4 9
Compared with other regions the Pacitan Regency showed the lowest rate of growth (0.03 percent annually) between 1971 and 1980, followed by the Ponorogo Regency (0.65 percent annually), as noted in Table 3.1. In addition to the impact of the government's family planning program, the low rate of population growth in these two regions was most likely due to the high rate of out-migration to other regions. On the other hand the regions that had a high rate of growth during 1971 and 1980 were the Sidoarjo Regency (2.75 percent), the Pasuruan Municipality (2.70 per cent), the Kediri Municipality (2.40 percent) and the Malang Municipality (2.14 percent). Apart from natural increase, the high rate of population growth in these regions was most likely caused by in-migration from other regions.
3.2 Plantation and Agriculture Changes
Pressure on agricultural land in East Java is as great or greater than in Central and West Java, as a much higher proportion (20 - 25 percent) of total land is still under forest. Only about 25 percent of the total area of 47,922 square kilometres is under cultivation. East Java's prosperity, perhaps more than any other area of Java or Indonesia, depends on the vagaries of the weather.
grown voluntarily for sale to mills or for brown sugar (BIES, 1971: 19-37). East Java produces most of the sugar for Indonesia's domestic market.
Tobacco is traditionally also an important cash crop for East Java. There are three kinds of tobacco produced : Virginia, used for white cigarettes; Tembakau Rakyat, for kretek cigarettes and cigars; and Besuki, for use as binder and filler. Virginia and Tembakau Rakyat are almost entirely smallholder crops. About three-quarters of Besuki tobacco leaf is produced by smallholders, and the reminder by estates owned by state enterprises. Tobacco leaf for cigars is exported to Western Europe and The United States, mostly through the Indonesian auction in Bremen, West Germany.
Other important commercial agricultural activities in East Java are growing copra and vanilla and fishing and livestock rising. Copra is almost entirely a garden crop in East Java, in spite of the number of coconut oil factories. Vanilla is cultivated in Malang, and some 50 to 60 tons are produced annually, mainly for export. Livestock raising as well as inland fisheries are also entirely smallholder operations in East Java.
in other lowland parts of rural Java, rice cultivation is historically the main rural activity (Van Setten, 1979). The capacity of rice cultivation to absorb large numbers of labourers within an already densely populated area has attracted the attention of many scholars (Bennet, 1961; White, 1976). Among these was Geertz who arrived in East Java in 1952 and studied the rural economy of Javanese peasants in 'Mojokuto' (pseudonym for a village near Malang). For about two years he lived and observed the social, economic, and cultural life of the peasants. Subsequently Geertz developed his thesis of
'agricultural involution':
Wet rice cultivation, with its extraordinary ability to maintain levels of marginal labour productivity by always managing to work one more man in without a serious fall in per-capita income, soaked up almost the whole of the additional population that Western intrusion created, at least indirectly. It is this ultimately self defeating process that I have proposed to call 'agricultural involution' (1963: 80).
Using this concept, Geertz showed how intensification of rice cultivation had been able to maintain additional labour without causing a serious decline in per-capita rice production. By intensification of rice cultivation he meant double-cropping, more careful regulation of irrigation water to the fields, careful weeding around the rice plants, selection of each rice grain to be harvested, and the use of hand pounding in milling.
Geertz described 'shared poverty' in the following manner:
....the involutional process also worked its peculiar pattern of changeless change on the distribution side. With the steady growth of population came also the elaboration and extension of mechanisms through which agricultural production was spread, if not altogether evenly, at least relatively so, throughout the huge human horde which was obliged to subsit on it. Under the pressure of increasing numbers and limited resources Javanese village society did not bifurcate, as did that of so many other 'underdeveloped' nations into a group of large landlords and a group of oppressed near-serfs. Rather it maintained a comparatively high degree of social and economic homogeneity by dividing the economic pie into a steadily increasing number of minute pieces, a process to which I have referred elsewhere as
'shared poverty' (1963: 96-97).
Much criticism has been levelled against Geertz's concept of Javanese peasant economic life (Utrecht, 1973; Collier, 1981; Alexander and Alexander, 1983). One critic was sceptical about the applicability of the concept to all rural Javanese peasants, as Geertz had only been concerned with a particular village at a certain period of time. In addition, Geertz's study mainly dealt with rice cultivation. Whatever the merit of Geertz's study, there is no doubt that in the early 1950's the Javanese rural economy had greatly deteriorated due to rapid population growth and the scarcity of new lands for rice cultivation.
involution and shared poverty (Montgomery, 1975; Collier, 1981), the more commercial orientation of agricultural activities among the large farmers (Edmundson and Edmundson, 1983) and the economic response of the landless farmers in coping with the limited job opportunities in rural areas (White, 1976; Bryant, 1974; Montgomery, 1975; Soelistyo, 1975).
In the late 1950's the government introduced a new scheme to improve rice production in Indonesia (Soelistyo, 1975; Schiller, 1980). This program later was known as the BIMAS (mass guidance) program. After an initial trial period, the government in mid-1968 invited several foreign companies, such as CIBA (Swiss), Hoechst (West Germany), A.H.T (West Germany), Mitsubishi (Japan), and Coopa (Italy) to back up the program, especially by producing fertilizer. Since then the Bimas program has spread throughout Javanese rural areas. The following discussion will focus on the impact of the green revolution, the impact of technological changes in agriculture upon labour absorption, and the deterioration of job opportunities in rural areas.
agriculture. The increased popularity of Japanese hand tractors is, among other things, facilitated by the government's credit policy which makes capital (namely imported machinery) relatively cheaper than human labour. The subsidized machinery thus can compete even with the declining wages of manual labour.
Labour use in harvesting has markedly declined due to the shift from hand-held knives (ani-ani) to sickles and to the use of contract labour in pre-harvesting through the ngepak-ngedok or ceblokan system in place of daily hired labour. The ngepak-ngedok or ceblokan system employs farm labourers before the harvest, at which time they are not paid but rather are guaranteed employment at harvest time with payment usually a percentage of the harvest. Labour use is also declining due to various institutional changes brought about by the transfer from bawon to tebasan. Bawon is the system whereby a harvester is paid in rice according to an agreed ratio ranging from 1/6 to 1/15 of the amount she or he harvests. Tebasan is the selling of the standing rice crop to a contractor ten or fifteen days prior to harvest time (Kana, 1983:3). Through the tebasan system the farmer is freed from the responsibility of providing employment for local harvesters, while the contractor who buys the crop will employ his own harvesters, who are usually people from outside the village.
hectare. In sawah harvested by a penebas, the area was 0.54 hectare employing 105 people, or 194 harvesters per hectare. An even greater difference has been reported by the same authors in the Jepara Regency (Central Java), where they noted that 96 harvesters were working in a field of 0.20 hectares giving a figure of 480 persons per hectare. At the same time, 50 metres away, only 3 persons under the tebasan system were harvesting a field of 0.14 hectare, equivalent to 21 persons per hectare. The use of sickles, apart from decreasing the number of laboures involved, also hinders those poor villagers (usually women and children) who are allowed to glean for themselves the stalks of rice that were missed by the harvester (Stoler, 1976).
The adoption of hullers to process the rice as an alternative to hand pounding also caused a decline in labour absorption, particularly among women. A report by Suparmoko et al., as quoted by Collier (1981: 166), confirmed estimates of the substantial numbers of labourers displaced in one rice season by the introduction of the huller. They estimated that 3,701 labourers per huller were displaced in a sample district (kecamatan) in West Java; 3,229 labourers per huller in Central Java; and 482 per huller in East Java. (The wide differences in the East Java sample was due to some labourers working longer hours and more days.). Collier (1981) estimated that, multiplying by the number of hullers in Java in 1971, 7,721,360 people were displaced in one season, although clearly these people were not all full-time labourers.