This is a repository copy of
The Use Of Mapping To Estimate Health State Utility Values
.
White Rose Research Online URL for this paper:
http://eprints.whiterose.ac.uk/118045/
Version: Accepted Version
Article:
Ara, R.A., Rowen, D.L. orcid.org/0000-0003-3018-5109 and Mukuria, C. (2017) The Use
Of Mapping To Estimate Health State Utility Values. PharmacoEconomics, 35 (Suppl 1).
pp. 57-66. ISSN 1170-7690
https://doi.org/10.1007/s40273-017-0548-7
The final publication is available at Springer via
http://dx.doi.org/10.1007/s40273-017-0548-7
[email protected] https://eprints.whiterose.ac.uk/ Reuse
Items deposited in White Rose Research Online are protected by copyright, with all rights reserved unless indicated otherwise. They may be downloaded and/or printed for private study, or other acts as permitted by national copyright laws. The publisher or other rights holders may allow further reproduction and re-use of the full text version. This is indicated by the licence information on the White Rose Research Online record for the item.
Takedown
If you consider content in White Rose Research Online to be in breach of UK law, please notify us by
1
The Use Of Mapping To Estimate Health State Utility Values
Running header: mapping onto HSUVs
Authors: Roberta Ara1, MSc; Donna Rowen1, PhD; Clara Mukuria1, PhD
1
University of Sheffield
School of Health and Related Research (ScHARR) Regent Court
30 Regent Street Sheffield
UK
2
AbstractMapping functions are estimated using regression analyses and are frequently used to predict health state utility values (HSUVs) in decision analytic models. Mapping functions are used when evidence on the required preference-based measure (PBM) is not available, or where modelled values are required for a decision analytic model, for example to control for important sociodemographic variables (such as age or gender).
This article provides an overview of the latest recommendations including: pre-mapping considerations, the mapping process including data requirements for undertaking the estimation of mapping functions, regression models for estimating mapping functions, assessing performance and reporting standards for mapping studies. Examples in rheumatoid arthritis are used for illustration.
When reporting the results of mapping standards the following should be reported: a description of the dataset used (including distributions of variables used), and any analysis used to inform the selection of the model type and model specification. The regression method and specification should be justified, and as summary statistics may mask systematic bias in errors, plots comparing observed and predicted HSUVs. The final model (coefficients, error terms(s), variance and covariance) should be reported together with a worked example.
3
Key points for decision makers Mapping functions are generated using regression analyses
M HSUV
and are often used when the required evidence is not available or to link the target HSUV
H‘Q L
It is important to ensure that appropriate analysis is undertaken prior to estimating regressions, and that appropriate regression models, model specifications and datasets are used together with how and where the predicted HSUVs will be used, as this can inform the selection of the most appropriate mapping function.
4
1. IntroductionThe practice of fitting a statistical regression model to data involving measures of health related -walkin in the literature. Mapping functions are frequently used to predict health state utility values (HSUVs) in decision analytic models. The mapping functions are obtained using regression analysis, a statistical process used to estimate relationships between variables. In its simplest form, the mapping function (sometimes referred to
y
i=
1i+
nX
ni+
whereby:
y is the dependent variable (the target being predicted),
x is the vector of explanatory variables (sometimes called independent variables or predictors),
n are the coefficients obtained from the regression analysis, and is the residual (error term), with i indexing the patient
Box 1 Example of a linear function used to explore the relationship between HAQ and EQ-5D
Example 1
A simple linear function was obtained using ordinary least square regressions to provide a relationship between the Health Assessment Questionnaire (HAQ) and EQ-5D in patients with rheumatoid arthritis (Hawthorne et al, 2000). The HAQ ranges from 0 (no disability) to 3 (completely disabled) and EQ-5D ranges from 1 (full health) to -0.59 (worst possible health state). Consequently we would expect any relationship between the two measures to be negative; that is, as HAQ increases, EQ-5D decreases:
EQ D HAQ
The beta coefficient for HAQ (i.e. -0.20) indicates that for every unit increase in HAQ, EQ-5D reduces by 0.20 units, as expected. This relationship is statistically significant at the p<0.05 level.
Mapping functions are used to predict health state utility values (HSUVs) in the following cases:
When the required preference-based measure (PBM) is not included in the dataset of interest,
5
The regression analysis may be undertaken using evidence from the clinical trial of interest or may require access to a separate external dataset. Instances when external datasets are required include when the clinical trial of interest does not collect the required PBM or the evidence collected is limited in ability to inform all health states within the decision analytic model (e.g. does not include patients across the full spectrum of disease severity, or the sample size or numbers of observed clinical events are too small to subgroup for the health states in the decision analytic model) [1] . It is recommended that any mapping exercise is conducted on empirical data [2] .
This paper provides an overview of the pre-mapping considerations, the mapping process including data requirements for undertaking the estimation of mapping functions, regression models for estimating mapping functions, assessing performance and reporting standards for mapping studies. A case-study using published evidence on the relationship between a clinical measure of severity (the Health Assessment Questionnaire (HAQ)) and EQ-5D in rheumatoid arthritis is used as an exemplar throughout (see Box 1 and the online Appendix (Table 1) for additional information on the rheumatoid arthritis mapping examples used).
2 Pre-mapping considerations
Prior to commencing mapping it is important to consider where the mapping functions will be applied. When the function is to be used in a decision model it is important to identify:
The required PBM (generally informed by the requirements of the reimbursement agency);
The health state definitions for the decision analytic model (e.g. health states representing discrete clinical events, health states defined by a clinical measure(s) of severity);
The distribution of patient characteristics (e.g. age, condition, and condition severity range);
The intervention and comparator(s) under evaluation (are these likely to have an independent effect on health related quality of life (HRQoL)), and the decision analytic model structure (cohort, individual patient simulation).
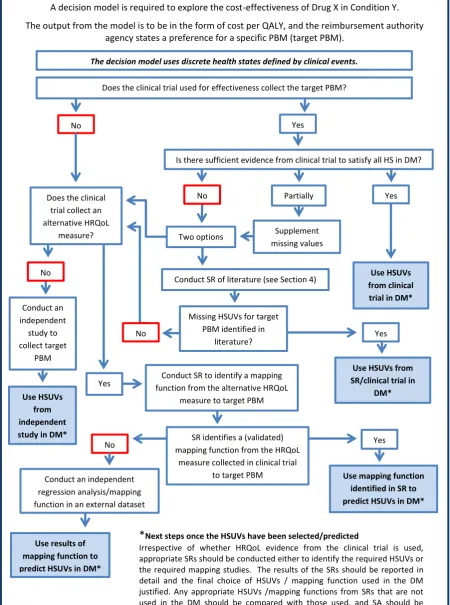
Figure 1a and Figure 1b outline the process used to identify if a mapping function is required to predict the HSUVs for a decision model. The first example, Figure 1a, has discrete health states which are defined using clinical events, such as fractures in osteoarthritis. The second example,
6
the decision analytic model. Of course, if the required PBM and clinical variable are collected in the clinical trial of interest, and the sample is sufficiently large across the full spectrum of disease severity, it is possible to use a series of discrete HSUVs subgrouped by disease severity. Any sampling in probabilistic sensitivity analyses should take into account the relationship to ensure there are no anomalies in sampled values.
If evidence from the required PBM is not available in the clinical trial of interest, then there are two options. The first, and typically preferred option, is to conduct a systematic review of the literature to identify HSUVs using the required PBM, see [3] for guidance on this. The second option if another HRQoL measure is available in the clinical trial of interest, is to conduct a systematic review of the mapping literature to identify validated and appropriate mapping studies (mapping from the HRQoL measure included in the study to the required PBM) [3]. Where no validated and appropriate mapping functions are identified, an external dataset that includes evidence from both the HRQoL measure included in the clinical trial and the required PBM can be used to generate a new mapping function. If no other HRQoL measure has been included then an independent study may need to be undertaken to collect the target PBM. Where the required PBM has been included but there is insufficient evidence to subgroup for all the health states in the decision analytic model, then a systematic review to identify HSUVs is recommended. Identified HSUVs can then be used in the decision model and if none are found, new mapping studies or new data collection of the target PBM may be required.
7
DM: decision model; HS: health states in DM; ICER: incremental cost-effectiveness ratio; PBM: preference-based measures; HSUV: health state utility values; SR: systematic review; SA: sensitivity analysis
*
Next steps once the HSUVs have been selected/predictedIrrespective of whether HRQoL evidence from the clinical trial is used, appropriate SRs should be conducted either to identify the required HSUVs or the required mapping studies. The results of the SRs should be reported in detail and the final choice of HSUVs / mapping function used in the DM justified. Any appropriate HSUVs /mapping functions from SRs that are not used in the DM should be compared with those used, and SA should be conducted to illustrate the effect on the ICER.
No
A decision model is required to explore the cost-effectiveness of Drug X in Condition Y.
The output from the model is to be in the form of cost per QALY, and the reimbursement authority agency states a preference for a specific PBM (target PBM).
The decision model uses discrete health states defined by clinical events.
No
No
Use HSUVs from clinical
trial in DM* Does the clinical trial used for effectiveness collect the target PBM?
Yes
Yes
Conduct SR of literature (see Section 4)
Is there sufficient evidence from clinical trial to satisfy all HS in DM?
Partially
Supplement missing values
Missing HSUVs for target PBM identified in
literature?
Use mapping function identified in SR to predict HSUVs in DM* Use HSUVs
from independent study in DM* Conduct an independent
study to collect target
PBM
Use HSUVs from SR/clinical trial in
DM* Does the clinical
trial collect an alternative HRQoL
measure?
No
Conduct SR to identify a mapping function from the alternative HRQoL
measure to target PBM
Yes
Conduct an independent regression analysis/mapping function in an external dataset
Use results of mapping function to predict HSUVs in DM*
Yes
Yes Two options
SR identifies a (validated) mapping function from the HRQoL
[image:8.595.72.523.123.729.2]measure collected in clinical trial to target PBM No
8
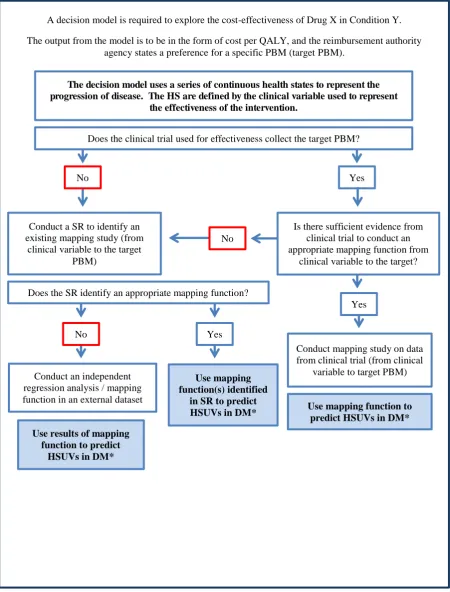
Figure 1b Steps to identifying appropriate HSUVs to inform decision models using continuous health states to represent the progression of disease
Irrespective of whether HRQoL evidence from the clinical trial is used, appropriate SRs should be conducted to identify appropriate mapping studies. The results of the SRs should be reported in detail and the final choice of mapping function used in the DM justified. Any appropriate mapping functions from SRs that are not used in the DM should be compared with those used, and SA should be conducted to illustrate the effect on the ICER of using these alternatives.
A decision model is required to explore the cost-effectiveness of Drug X in Condition Y.
The output from the model is to be in the form of cost per QALY, and the reimbursement authority agency states a preference for a specific PBM (target PBM).
The decision model uses a series of continuous health states to represent the progression of disease. The HS are defined by the clinical variable used to represent
the effectiveness of the intervention.
Conduct mapping study on data from clinical trial (from clinical
variable to target PBM)
Use mapping function to predict HSUVs in DM* Use mapping
function(s) identified in SR to predict HSUVs in DM* Conduct an independent
regression analysis / mapping function in an external dataset
Use results of mapping function to predict
HSUVs in DM*
Does the clinical trial used for effectiveness collect the target PBM?
No Yes
Is there sufficient evidence from clinical trial to conduct an appropriate mapping function from
clinical variable to the target? No
Yes Conduct a SR to identify an
existing mapping study (from clinical variable to the target
PBM)
Does the SR identify an appropriate mapping function?
No Yes
9
3 Overview of the mapping processMapping involves four key stages:
1.
Identifying an appropriate estimation dataset .2.
Applying regression techniques to find the best-fit statistical relationship between the measures (either mapping to the index score or the classification system of the target PBM). This stage includes the refinement of the model specifications, the selection of the model type, and assessing the model performance.3.
Applying the regression results to the study dataset of interest to predict HSUVs.4.
Assessing/validating the regression results (through a thorough comparison of predicted and observed HSUVs, comparison with any evidence in the literature, and applying the mapping function in a second dataset which satisfies all the conditions of Step 1. (NB: It is rare that the latter is conducted due to lack of availability of appropriate evidence.)11
3.1 Data requirements for undertaking mapping
The use of a published appropriate mapping function requires access to individual patient level evidence on the explanatory variables used in the mapping function. Where an external estimation dataset is used, all explanatory variables should be in both datasets. The clinical and demographic characteristics, and the distribution of the explanatory variables, should also be similar in both datasets as the statistical relationship may differ at different severities of health [5]. Primary data collection is required if no appropriate estimation dataset exists. There are a number of basic analyses that should be conducted prior to estimating a mapping function (Box 2) [1].
Box 2 Summary of recommendations before estimating mapping functions
Required application of the mapping function
Determine the range of health states that require utility estimates for the cost-effectiveness model and any important covariates
Ensure the patient characteristics in the dataset used to estimate the mapping function match those of the proposed cost-effectiveness model, in particular the extremes of disease severity in chronic conditions, or time since event for acute clinical events. If more than one dataset is available, their characteristics should be compared to justify the final dataset choice
Determine whether a mapping function obtained using statistical regression methods is required, or if mean values from subgroups of patients will suffice
Relationships between explanatory and independent variables
Examine the characteristics (dispersion, distribution, atypical values etc) of both the explanatory and dependent variables, including the level of overlap or relationship between the variables
Identify whether the relationship between the explanatory and dependent variables is likely to be influenced by any intervention the patient will receive
Source: Adapted from Wailoo et al, 2017 [1]
3.2 Explanatory and target PBM variables
12
functions obtained using the preference-based index as the dependent variable is constrained to the setting of the preference-weights used. For example, a function obtained using the UK EQ-5D-3L preference weights cannot be used to generate EQ-5D-3L HSUVs suitable for the Netherlands (which have their own set of preference-weights for the EQ-5D).
An approach that can be used to predict HSUVs for alternative sets of preference-weights is known [6]. Again using the EQ-5D-3L as an example, response mapping uses logistic regressions (one regression for each dimension) and the responses to the dimension questions (as opposed to the preference-based index) as the dependent variables [7]. The predicted values from the logistic models (five models predicting the probability of scoring 1, 2 or 3 on the five dimensions) are then used together with the required preference weights for each of these responses to predict the associated EQ-5D HSUV. Interested readers are pointed to Ara, Kearns & Brazier [7] for a worked example.
The choice of both the dependent and explanatory variables will be informed by the evidence available in the datasets used for mapping, and where the mapping function will be applied. For example if the mapping function is to be used in a decision analytic model that will be adapted to inform policy decisions in multinational settings, response mapping avoids the need to obtain different mapping functions for each required set of preference weights.
13
Box 3 An example where additional explanatory variables are included when exploring the relationship between HAQ and EQ-5D in Rheumatoid Arthritis (RA)
Example 2
The HAQ does not include any information on pain levels, but EQ-5D has a pain dimension. Hurst and colleagues explored the effect of including additional explanatory variables (including a measure of pain) [8]:
EQ D HAQ HAD mood Pain VA scale
disease activity
The beta coefficient for pain-VA scale (-0.003) was statistically significant at the p<0.05 level, and illustrates that as pain increases, EQ-5D decreases, as expected.
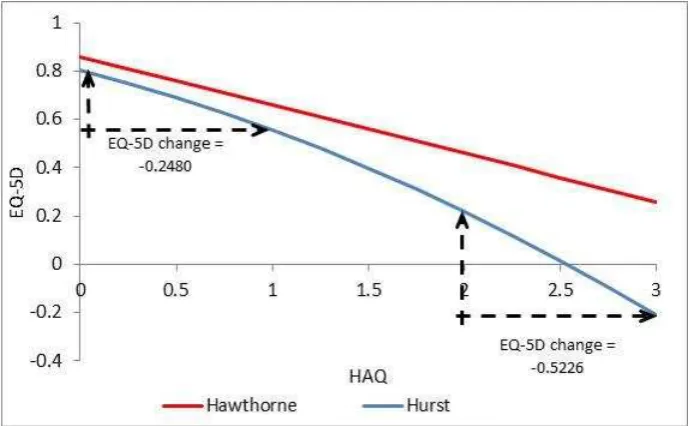
Relationships between measures are not always linear, and the possibility of a curved relationship between EQ-5D and HAQ was explored through the inclusion of a squared term in the analyses used to inform a Rheumatoid Arthritis model [9].
EQ D HAQ HAQ
The beta coefficient for HAQ squared was statistically significant. It is clear from the figure below that the relationship between EQ-5D and HAQ now changes across the indices, with a greater magnitude per unit change at more severe levels. Consequently a change in HAQ from 3 to 2 produces a greater change in EQ-5D 5D change = -0.5226) than a change in HAQ from 1 to 0 (EQ-5D change = -0.2480) See Figure 2.
14
Figure 2: Plot illustrating magnitude of change in EQ-5D associated with one unit change in HAQ
It is important that both the required PBM and any measure of HRQoL used as an explanatory variable (e.g. an alternative generic preference-based measure (GPBM) or condition specific measure (CSM)) are valid for use in the population where they are being applied. If either measure is not appropriate (i.e. not relevant or insensitive) for the condition of interest, then mapping between the measures is also inappropriate [10]. It is also important that there is conceptual (i.e. they are measuring similar concepts or dimensions as shown using a comparison of the conceptual domains of each measure) and empirical (i.e. they are correlated) overlap between the dependent and explanatory measures. The mapping function will not produce accurate predictions of HSUVs if there is little overlap, and the model may suffer from omitted variable bias. Evidence shows that this is more likely when mapping from condition-specific measures to GPBMs. One example where there was little overlap was mapping the overactive bladder questionnaire onto the SF-6D [10], potentially suggesting that the generic measure was insensitive in this patient group. If this occurs a better solution may be to consider a condition-specific preference-based measure.
15
statistics and distributions of the dependent and explanatory variables used in the mapping should be reported.
3.3 Regression models
A range of different statistical models can be used to estimate mapping functions, and the literature exploring different approaches is increasing each year. The most appropriate model for use will depend on the measures involved, the distribution of the dependent variable, the relationship between the dependent and explanatory variables, any interactions between the variables, and the evidence available in the datasets used. Plots of the dependent variable are particularly useful as they indicate the distribution of the data which is informative for selection of the regression method.
Box 4 provides a checklist for the steps to take when designing and choosing a model to estimate the mapping function (see Appendix Box 1 , and papers by Hernandez and colleagues [11;12] for additional information and empirical examples).
16
Box 4 Recommendations for estimating mapping functionsSummary of statistical modelling recommendations
1. Assess range and distribution of utility score (summary statistics and plot) or dimensions of explanatory variable (target PBM)
2. Use the simplest regression models possible that satisfy associated assumptions considering the distribution of the target# utility score or dimensions3. Select explanatory variables using theory and observed relationships. Include all variables considered important as omission can risk mis-specification and biased estimates.
3. Select the final model using good practice techniques for all regression analyses, including performance and model fit (see Table 2).
#
the target utility is the dependent variable
Source: Adapted from: Wailoo et al, 2017 [1]
While linear ordinary least squares (OLS) is the simplest approach and is frequently used as a starting point, this may be inappropriate for the distribution of the preferred PBM. Much of the literature has focussed upon mapping to EQ-5D and models obtained using OLS regressions have a tendency to under-predict at the top and over-predict at the bottom of the index [10]. The EQ-5D-3L distribution poses particular challenges as the data are typically bimodal or trimodal, with a large proportion of responses at one (full health), and peaks for moderate health states and severe health states. Tobit and censored least absolute deviation (CLAD) models have been used as a way of dealing with the large proportion of responses at one, though these do not always offer an improvement in predictive accuracy [5]. Although the latent class mixture model, censored mixture model and multinomial logit model have all been used to model the trimodal distribution more appropriately, these models can prove difficult to estimate on smaller samples. When mapping between HRQoL measures, while the accuracy of the predicted values will be governed by the degree of content overlap to some degree, a mis-specified model will not produce the most accurate predictions.
3.4 Selecting and applying mapping functions
17
intervention in a decision model, it may be appropriate to estimate a mapping function using the evidence from the clinical study, but this will depend on why mapping is required, the quality of the evidence, and the availability of alternative external datasets.
18
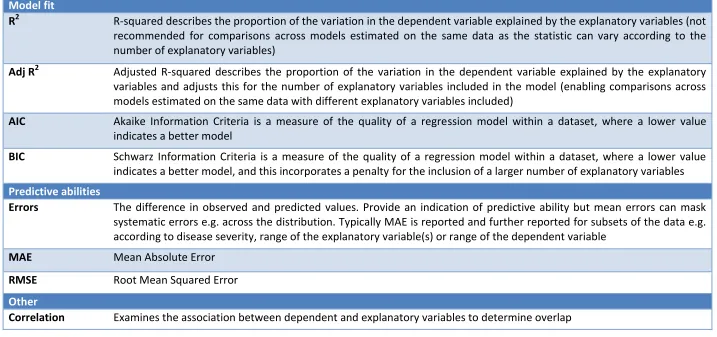
Table 1 Overview of standard statistics used in mappingModel fit
R
2R-squared describes the proportion of the variation in the dependent variable explained by the explanatory variables (not
recommended for comparisons across models estimated on the same data as the statistic can vary according to the
number of explanatory variables)
Adj R
2Adjusted R-squared describes the proportion of the variation in the dependent variable explained by the explanatory
variables and adjusts this for the number of explanatory variables included in the model (enabling comparisons across
models estimated on the same data with different explanatory variables included)
AIC
Akaike Information Criteria is a measure of the quality of a regression model within a dataset, where a lower value
indicates a better model
BIC
Schwarz Information Criteria is a measure of the quality of a regression model within a dataset, where a lower value
indicates a better model, and this incorporates a penalty for the inclusion of a larger number of explanatory variables
Predictive abilities
Errors
The difference in observed and predicted values. Provide an indication of predictive ability but mean errors can mask
systematic errors e.g. across the distribution. Typically MAE is reported and further reported for subsets of the data e.g.
according to disease severity, range of the explanatory variable(s) or range of the dependent variable
MAE
Mean Absolute Error
RMSE
Root Mean Squared Error
Other
19
The recommended mapping function should be reported together with the statistics needed to undertake univariate and probabilistic sensitivity analyses (confidence intervals or standard errors around the betas, and the variance covariance matrix (a standard output from the regression analysis in many statistical software packages)). The error term distribution is also important to reflect individual level variability in HSUVs. If a published mapping function is used, and the required statistics are not available to explore the variance in the predicted HSUVs, a threshold analysis can be conducted to determine the HSUVs required to ensure the results from the decision model would be considered cost-effective.
An important consideration when performing mapping functions is whether the results are to be used in a cohort model or an individual level simulation. The former will require mean HSUVs which
PBM
a much wider range of HSUVs. This is particularly important when assessing the predictive ability of the mapping function, including when sampling for probabilistic sensitivity analyses.
4. Reporting standards for mapping studies
A summary of recommendations for reporting mapping studies from a recent ISPOR task force is provided in Box 5 and additional details are available from the MAPS statement ) [13]. It is good practice to fully describe the dataset used to estimate the mapping function, including the distribution (e.g. range, mean, standard deviation) of all variables used in the regression, and any analysis used to inform the selection of the model type and model specification (see Hernandez Alava et al [12] for a worked example). The regression method and specification should be justified, and sufficient information should be provided to enable the reader to determine whether these are appropriate. Mean errors can mask systematic bias in the errors across the range of predicted HSUVs and it has been suggested that errors in subgroups such as EQ-5D range (EQ-5D < 0, 0-0.25, 0.25-0.5, 0.5-0.75, 0.75-1) should also be reported [5].
20
provides mean errors in the HSUVs predicted using the alternative functions sub-grouped by HAQ score).
21
Box 5 Recommendations of reporting standards for mapping studies
Summary of reporting standards recommendations
Summary of dataset
1. Describe the characteristics of all candidate datasets including any relevant differences 2. Describe the dataset selected including study characteristics, patient recruitment,
patient characteristics including disease severity, at baseline and follow-up. In longitudinal datasets, where possible missing responses should be analysed and any identified pattern described.
3. Summarise and plot the distribution of the target utility measure.
4. Describe the estimated models including their appropriateness in the dataset given the data properties and distribution.
5. Describe the selection of explanatory variables including the theory and observed relationships used to inform selection.
6. Describe model performance and fit. Provide information on errors presented in terms of disease severity (subgrouped by the clinical outcome measure(s) where possible or the target utility measure), using a table or plot. Describe model selection including any tests or judgements used in the process.
7. Provide details of the final model including: coefficient values, error term(s) distributions(s), variances and covariances.
8. Provide model syntax, an excel program or a worked example that enables readers to use the final model to produce mapped predictions in another dataset. Describe parameter uncertainty in the final model and the suitability of the model in terms of future sampling in cost-effectiveness probabilistic sensitivity analysis to determine whether predicted values lie within the feasible utility range for the PBM.
22
5. Strengths and limitations of mappingMapping allows appropriate HSUVs to be generated for use in decision models including extrapolation, inclusion of important covariates that may affect the HSUVs and where they are completely missing. In the case where validated mapping functions based on appropriate data are available, then mapping can provide a quick and easy way to generate HSUVs. It also provides a pragmatic solution to generating the HSUVs required in a decision model where appropriate data is available..
However, mapping will introduce additional uncertainty to the analysis, and should be considered as a second-best solution compared to directly collected HSUVs [5]. Published mapping functions may not report all the recommended information that is required to judge whether or not the recommended mapping functions are appropriate for use. Furthermore, datasets that are used are often based on a pragmatic choice e.g. an existing trial, which may be limited in application across other studies of interest, meaning that the accuracy of the mapped results may be reduced. In addition many existing studies are limited in their sample size, for example if they are collected using an existing trial, and where larger datasets are available these are often general population datasets that have limited data for more severe states. Some studies have found that the size of the error increases for more severe states [18], due to both a combination of limited data availability in these states and limitations of the models used to estimate the mapping functions. However, it has been found that this limitation may have limited impact on the accuracy of economic evaluations using mapped values as these focus on the differences in QALYs over time or across groups rather than the levels [14]).
23
6. Summary
24
AcknowledgementsThe authors would like to acknowledge Jon Karnon, PhD of xxx and Andrew Lloyd, Phd of xxx for their editorial review.
Author contributions
RA wrote the manuscript. DR reviewed the literature and contributed to the manuscript. CM contributed to the manuscript.
Compliance with Ethical Standards
Funding This study was funded by an unrestricted grant from Takeda Pharmaceuticals International AG.
25
REFERENCES1. Wailoo AJ, Hernandez-Alava M, Manca A, Mejia A, Ray J, Crawford B et al. Mapping to
Estimate Health-State Utility from Non-Preference-Based Outcome Measures: An ISPOR Good Practices for Outcomes Research Task Force Report. Value in Health 2017; 20:18-2.
2. Longworth L, Rowen D. The use of mapping methods to estimate health state utility values. NICE DSU Technical Support Document 10. 2011.
3. Ara R, Brazier J, Peasgood T, Paisley S. The identification, review and synthesis of Health State Utility Valuess from the literature. Pharmacoeconomics 2017.
4. Dakin H. Review of studies mapping from quality of life or clinical measures to EQ-5D: an online database. Health Qual Life Outcomes 2013; 11(1):151.
5. Longworth L, Rowen D. Mapping to obtain EQ-5D utility values for use in NICE health technology assessments. Value Health 2013; 16:202-210.
6. Gray AM, Rivero-Arias O, Clarke PM. Estimating the Association between SF-12 Responses and EQ-5D Utility Values by Response Mapping. Medical Decision Making 2006; 26(1):18-29. 7. Ara R, Kearns B, Brazier JE. Predicting preference-based utility values using partial proportional
odds models. BMC research notes 2014; 7(1):438.
8. Hurst NP, Kind P, Ruta D, Hunter M, Stubbings A. Measuring health-related quality of life in rheumatoid arthritis: validity, responsiveness and reliability of EuroQol (EQ-5D). Rheumatology 1997; 36(5):551-559.
9. National Institute for Health and Care Excellence. Adalimumab, etanercept, infliximab,
rituximab and abatacept for the treatment of rheumatoid arthritis after the failure of a tumour necrosis factor inhibitor: a systematic review and economic evaluation. 2010. London, NICE.
10. Brazier J, Yang Y, Tsuchiya A, Rowen D. A review of studies mapping (or cross walking) non-preference based measures of health to generic non-preference-based measures. Eur J Health Econ 2010; 11(2):215-225.
11. Hernandez Alava M, Wailoo AJ, Ara R. Tails from the Peak District: Adjusted Limited
Dependent Variable Mixture Models of EQ-5D Questionnaire Health State Utility Values. Value in Health 2012; 15(3):550-561.
12. Hernandez Alava M, Wailoo AJ, Wolfe F, Michaud K. The relationship between EQ-5D, HAQ and pain in patients with rheumatoid arthritis. Rheumatology 2013; 52(5):944-950.
13. Petrou S, Rivero-Arias O, Dakin H, Longworth L, Oppe M, Froud R et al. The MAPS reporting statement for studies mapping onto generic preference-based outcome measures:
explanation and elaboration. Pharmacoeconomics 2015; 33(10):993-1011.
26
15. Pennington B, Davis S. Mapping from the Health Assessment Questionnaire to the EQ-5D: the impact of different algorithms on cost-effectiveness results. Value in Health 2014; 17(8):762-771.
16. Hawthorne G, Buchbinder R, Defina J. Functional status and health-related quality of life assessment in patients with rheumatoid arthritis. Working Paper 116. 2000. Centre for Health Program Evaluation.
17. Marra CA, Marion SA, Guh DP, Najafzadeh M, Wolfe F, Esdaile JM et al. Not all quality-adjusted life years are equal. Journal of clinical epidemiology 2007; 60(6):616-624. 18. Rowen D, Brazier J & Roberts J (2009) Mapping SF-36 onto the EQ-5D index: how reliable is the
27
APPENDIXBox A1 Sources used in the RA case-study
The introduction of biological drugs for the treatment of inflammatory arthritis instigated an abundance of economic evaluations exploring the cost-effectiveness of these interventions in patients with rheumatoid arthritis, the most common form of inflammatory arthritis. The health assessment questionnaire disability index (HAQ) was invariably used to represent the effectiveness of interventions in clinical trials. The HAQ covers eight categories of function including dressing, eating, walking, hygiene, reach, grip and usual activities and is scored on a summary scale from 0 (no disability) to 3 (completely disabled). Although scored in increments of 0.125 the HAQ is generally treated as a continuous variable.
The HAQ measure was used to represent the benefits of treatments, and to define health states and progression of the condition within the decision analytic models. As preference-based measures (PBM) were not typically collected in the clinical trials, it was necessary to obtain the required HSUVs from alternative sources. Due to the definitions of health states within the decision models, in the majority of cases, a continuous relationship between HAQ and a PBM was required.
Almost all early publications reported simple linear relationships obtained using ordinary least square (OL) regressions, and frequently used just the HAQ as an explanatory variable (although some included additional explanatory variables such as age, gender, pain, or disease activity) (see Pennington & Davis [15] for the impact of different mapping algorithms from HAQ to EQ-5D in patients with RA within the same cost-effectiveness model). As biologics are indicated for patients at the more severe end of the disease spectrum, the HAQ could progress to the most extreme level (i.e. HAQ = 3) in decision analytic models. Functions obtained using OLS regressions tend to overestimate HSUVs at the bottom end of the PBM and underestimate HSUVs at the top of the PBM, consequently, these functions would underestimate the potential benefits of treatment.
28
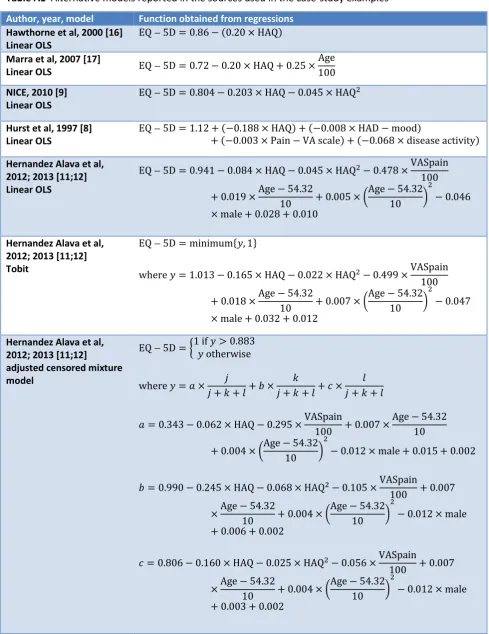
Table A1 Alternative models reported in the sources used in the case-study examples
Author, year, model Function obtained from regressions
Hawthorne et al, 2000 [16] Linear OLS
EQ D HAQ
Marra et al, 2007 [17]
Linear OLS EQ D HAQ
Age
NICE, 2010 [9] Linear OLS
EQ D HAQ HAQ
Hurst et al, 1997 [8] Linear OLS
EQ D HAQ HAD mood
Pain VA scale disease activity
Hernandez Alava et al, 2012; 2013 [11;12] Linear OLS
EQ D HAQ HAQ VASpain
Age Age
male
Hernandez Alava et al, 2012; 2013 [11;12] Tobit
EQ D minimum
where HAQ HAQ VASpain
Age Age
male
Hernandez Alava et al, 2012; 2013 [11;12]
adjusted censored mixture model
EQ D if otherwise
where
HAQ VASpain Age
Age
male
HAQ HAQ VASpain
Age Age
male
HAQ HAQ VASpain
Age Age
male