6** {t *
* {t * *
*•*
Working notes on the
Common Agricultural Policy
MEAT
1996/97 edition
EUROPEAN CO:MMISSION
Directorate-General for Agriculture
A great deal of additional information on the European Union is available on the Internet.
It can be accessed through the Europa server (http://europa.eu.int).
Cataloguing data can be found at the end of this publication.
Luxembourg: Office for Official Publications of the European Communities,
1997ISBN 92-827-7555-0
© ECSC-EC-EAEC, Brussels - Luxembourg,
1997Reproduction is authorized, except for commercial purposes, provided the source is acknowledged.
CONTENTS
Page
Introduction
5I - Beef and veal
7
The situation of the markets
7
1. The world market 7
2. The Community market 8
3. Bovine spongiform encephalopathy 18
The common market organisation
21
1.
Import and export arragements21
2. Price and intervention system 22
3. Premium system 24
4. Measures to promote consumption 28
Annex:.
Promotion measures29
II- Sheepmeat and goatmeat
32
The situation of the markets
32
The common market organisation
41
1.
Import and export arrangements41
2. Price arrangements
41
3. Aid for private storage 42
4. Intervention other than storage ofsheepmeat and goatmeat 43
5. Fixed premium for ewes and goats in less-favoured and mountain areas 44
ID - Pigmeat
45
The situation of the markets
45
The common market organisation
51
1.
Import and export arrangements51
3. lntetvention for pigmeat
4.
Exceptional market support measures
IV- Eggs and poultrymeat
The situation of the markets
1. Eggs
2. Poultrymeat
The common market organisation
53 53
INTRODUCTION
This text on meat is one of a series produced by the Directorate-General for Agriculture of the
European Commission known as
"CAP Working Notes"which is published every year in
French, English and German. These documents contain the most recently available information
on the current marketing year, particularly the decisions on prices and related measures and the
planned budget expenditure for the market organisation of the product in question.
The document is in two parts. The first part consists mainly of the contributions made by the
Directorate-General for Agriculture's Units "Beef7veal and sheepmeat" and "Pigmeat and
poultry'' to the 1996 Report
The Agricultural Situation in the European Union.The second is
taken from the working document
IISection
m -
Commission - Sub-section B 1" which
accompanies the
Preliminary Draft General Budget of the European Communities for the financial year 1998.I -BEEF AND VEAL
THE SITUATION OF THE MARKETS
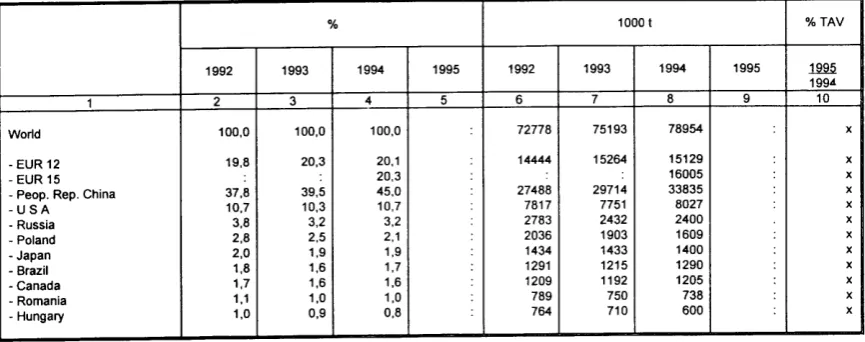
1. World market
World production of beef and veal, standing at about 56,5 million tonnes in 1996, is
picking up again mainly due to a plentiful supply in North America and continued
growth in the producing countries of South America that are officially recognized as free
of foot-and-mouth disease (Table 1). On the other hand, the supply of beef and veal is
expected to level off in Oceania, although at a relatively high level. Production is in
decline in eastern Europe and in Russia in particular, where a reduction in the cattle
herd has gone hand in hand with the restructuring taking place there since the beginning
of the 1990s.
World demand for beef and veal continues to be stimulated by rising incomes in the
countries of south-east Asia and Japan in particular. The increase in consumption
remains firm in the two primary import markets, i.e. Japan and the USA, but also in
Brazil and China where domestic demand is growing rapidly.
Table 1
Beef and veal production
(1000 tonne carcase weight)
1993 1994 1995 1996 %change
1995 1996
1994 1995
USA 10.584 11.194 11.552 11.923 + 3,2 + 3,2
CIS 6.840 6.064 5.400 5.078 - 10,9 -6,0
Argentina 2.508 2.486 2.466 2.471 -0,8 + 0,2
Brazil 5.570 6.129 6.392 6.540 +4,3 + 2,3
Australia 1.814 1.829 1.720 1.700 -6,0 - 1,2
Japan 594 602 601 596 -0,2 -0,8
China 2.341 3.275 3.775 4.404 +15,3 +16,7
India 2.458 2.496 2.615 2.730 +4,8 + 4,4
EUR15 8.180 7.835 7.967 7.700 + 1,7 -3,4
World trade in beef and veal, amounting to about 4. 7 million tonnes, is still influenced by the increasing import needs of south-east Asia, including South Korea, Taiwan, Malaysia and above all Japan, where imports have increased in recent years by 10% a year. Both the United States of America and Canada have encouraged exports of beef and veal to such an extent that they now account for a greater share of the world market and will undoubtedly become net exporters of beef and veal this year.
After two years of increasing world prices for beef and veal, prices have now begun to fall, especially on North American markets, although prices have increased somewhat in South America. These price movements are accordingly helping to reduce the price differential between the two Pacific markets on the one hand and the Atlantic market on the other.
2. Community market
The European Union ranks second behind the United States in the production of beefi'veal, which
in
1993 accounted for some 11-12% of the value of final agricultural production. 1990 and 1991 saw a cyclical upturnin
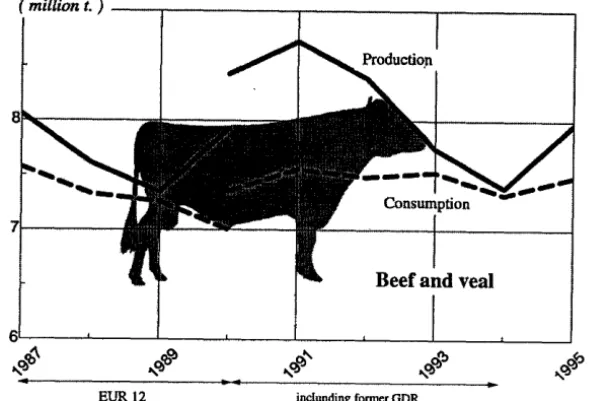
beefi'veal production, with the slaughter of dairy cows in the former German Democratic Republic and more substantial imports of calves from eastern European countries. With the return to a cyclical phase of low production, and the decision to limit Community imports of calves drastically, there was a marked decline in production between 1992 and 1994. The expected upturn in the cycle began in 1995, with production at 7.96 million tonnes (Graph and Tables 2, 3 and 4).The Community market for beef and veal was destabilized by the bovine spongiform encephalopathy crisis (see point 3 below). Despite the slaughtering due to the crisis production stayed stable in 1996. In 1997 a drop of 1% is expected.
Market prices for the quality grades eligible for intervention dropped below the threshold for triggering support measures (Table 5).
Alongside the health and veterinary measures to protect public and animal health and restore consumer confidence, the following market support measures were introduced:
• the buying-in of more than 300 000 tonnes of beef and veal in mid-September, resulting in a build-up of invention stocks ofbeefand veal and
• aid for the private storage of about 12 000 tonnes of veal.
Lastly, a programme was introduced to remove from the market the meat of dry cows and other bovine animals over 30 months old in the United Kingdom, as well as calves originating in that country and present in some herds in the other Member States.
Having increased during the 1960s and 1970s, beet7veal consumption reached a peak
in
the mid-1980s of approximately 7.5 million tonnes (EUR 12). Apart from some variation due to developments in the general economic situation, consumption remained at this level until I993.Community consumption (EUR 15) of beef and veal is estimated to have been 7.5 million tonnes carcase weight equivalent in I995, or about 20.2 kg a head (Table 6). The BSE crisis has dealt a blow to the consumer's image of beef and veal and consumption has fallen sharply in the United Kingdom and in most other countries of the European Union, notwithstanding the measures taken to promote quality beef and veal and the introduction of a scheme identifying the origin of the meat offered to the consumer (Table 7). In I996 consumption dropped by 6% to around 7 million tonnes. 1997 is expected to show an increase of 2% on I996.
As regards trade, the Union is a net exporter oflive animals and fresh, chilled or frozen beef and veal. These exports are more than double the level of imports. Having increased rapidly
in
the early I990s in response to strong demand, mainly from eastern European countries, exports have since returned to their usual level ofbetween I and 1.2 million tonnes. For the first year of implementation of the agricultural agreement resulting from the "Uruguay Round" negotiations (1 July 1995 to I July 1996), exports are restricted to 1.137 million tonnes (EUR 15), while the amount imported remains unchanged1. Because about I 00 000 tonnes were carried forward into the second year of application of the Agreement, a total of 1 192 000 tonnes were available on 1 July I996.Community exports of beef and veal, achieved mainly with the help of export refunds, now account for no more than 1 100 000 tonnes carcase weight equivalent.
Imports of beef and veal from third countries are governed for the most part by the various agreements concluded under the World Trade Organisation (WTO), the Lome convention or with the countries of central and eastern Europe. They amount to about 500 000 tonnes carcase weight equivalent a year. Access to the Community market will become more open because of an increase in some import quotas and it will certainly become easier because of the reduction in import duties (Tables 8, 9 and 1 0).
The very low level of market prices is a further discouragement to cattle producers who are already faced with a 10% increase in the cost of animal feed. This will thus result in a medium-term reduction in beef and veal production in the European Union.
( milUon t.)
--r---r---.,---.
[image:11.586.156.460.80.280.2]EUR12 inclunding former GDR
Table 2
Cattle numbers (December of previous year)
1000 head
1993 1994 1995 1996
1 2 3 4 5
EUR15*" 84744 83911 84462 84450 Belgique/Belgie 3100 3084 3161 3147 Danmark 2180 2115 2082 2094 BR Deutschland 16207 15897 15962 15890 Ellada 629 608 520 550 Espana 4961 5001 5237 5432 France 20329 20099 20524 20662 Ireland 6265 6308 6410 6531 ltalia 7703 7561 7272 7128 Luxembourg 202 205 204 204 Nederland 4794 4629 4588 4558 Osterreich*" 2401 2334 2329 2323 Portugal 1345 1323 1330 1317 Suomi/Finland*" 1232 1230 1185 1179 Sverige*" 1775 1807 1790 1762 United Kingdom 11621 11710 11868 11673 EUR12 79336 78540 79158 79186
Sources: Eurostat and European Commission, Directorate-General for Agriculture.
T A V = Annual variation
•• =Estimate
:=Not available -=Nil
x = Not applicable
% ofEUR 15
1996 6
100,0 3,7 2,5 18,8 0,7 6,4 24,5 7,7 8,4 0,2 5,4 2,8 1,6 1,4 2,1 13,8 93,8
%TAV
N92
1995 7
Table 4
Net production of beef/veal (adult bovine animals and calves) (1)
1992
1 2 3
Adult bovine EUR15 .. 8029
animals Belgique/Belg~ 293
Danmark 216
BR Deutschland 1761
Ellada 69
Espana 524
France 1588
Ireland 565
ltalia 1010
Luxembourg 7
Nederland 451
Osterreich** 230
Portugal 114
Suomi/Finland** 117
Sverige** 125
United Kingdom 959
EUR 12 7467
Calves EUR15 .. 861
Belgique/Belgi6 59
Danmark 1
BR Deutschland 67
Ellada 11
Espana 10
France 289
Ireland 0
ltalia 207
Luxembourg 0
Nederland 184
Osterreich- 17
Portugal 9
SuomVFinland- 0
Sverige .. 5
United Kingdom 2
EUR12 839
Beef/veal EUR15 .. 8890
Belgique/Belg~ 352
Danmark 217
BR Deutschland 1829
Ellada 79
Espana 535
France 1877
Ireland 564
ltalia 1218
Luxembourg 7
Nederland 635
Osterreich- 247
Portugal 123
SuomVFinland- 117
Sverige- 130
United Kingdom 960
EUR12 8396
Source: Eurostat.
NB: These figures do not correspond to gross domestic production,
(1) Total slaughterings of animals including those of foreign origin. (2) Carcass weight
1 000t(2)
1993 1994 1995
4 5 6
7418 6566 7171
305 288 295
202 184 180
1538 1358 1347
64 63 58
476 469 505
1432 1362 1427
526 445 480
994 979 1000
7 6 7
424 410 386
242 : 183
107 87 95
106 : 95
137 : 139
858 915 974
6850 6503 6683
832 805 797
61 61 54
1 5 5
66 62 60
12 12 12
9 4 4
272 265 259
0 0 0
194 194 182
0 0 0
187 194 194
16 : 13
8 7 9
0 : 1
5 3
1 1 1
811 805 780
8240 7846 7967
366 349 349
203 189 185
1604 1420 1407
76 75 70
485 472 508
1704 1627 1686
526 445 480
1188 1173 1181
7 7 7
611 604 580
248 227 196
115 94 104
106 107 96
142 141 143
859 916 975
7744 7371 7532
%TAV ~ 1994 7 92 2,4 -2,2 -0,8 -7,9 7,7 4,8 7,9 2,1 16,7 -5,9 X 9,2 X X 64 2,8
AduH male bovines R3 (4) 1993 1994 1 2 3 EUR15 : : Belgique/Belgie 254,42 252,48 Dan marl< 251,79 250,85 BR Deutschland 255,95 248,87 Ell6da 340,21 348,93 Espatia 280,68 269,39 France 289,79 270,12 Ireland 240,33 239,39 ltalia 282,53 278,91 Luxembourg 270,20 288,45 Nedel1and 289,07 280,02 Osterreich : : Portugal 303,85 300,01 Suomi/Finland : : Sverige-308,72 306,23 United Kingdom 25110 24304 EUR 12(3) 283,68 259,48 Source: European Commission, Directorate-General for AgricuHure. (1) Country 0. (2) Slaughter weight. (3) Weighted 0 ECU/1 00 kg. (4) Good conformation and average fat cover. (5) Fairly good conformation and average fat cover. (8) New agricultural conversion ECU. 1995 (6)
4 29085 284,28 287,32 283,75 399,84 288,53 300,37 278,09 313,54 315,84 287,15 290,85 321,52 2n.os 283,33 27568
:
TableS
Market
prices
(1)
for
beef/veal
HeifersR3
(4)
%TAV ~
1993
1994
1995
(6)
1994 5
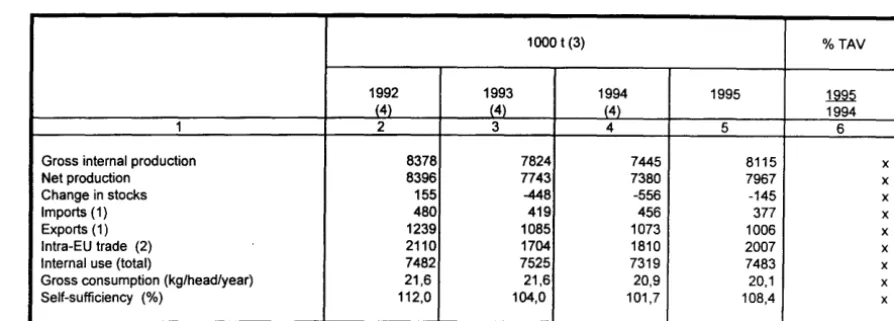
Table 6
Supply balance beef/veal
1000 t (3)
1992 1993 (4) (4)
1 2 3
Gross internal production 8378 7824 Net production 8396 7743 Change in stocks 155 -448 Imports (1) 480 419 Exports (1) 1239 1085 lntra-EU trade (2) 2110 1704 Internal use (total) 7482 7525 Gross consumption (kg/head/year) 21,6 21,6 Self-sufficiency (%) 112,0 104,0
Sources: Eurostat and European Commission, Directorate-General for Agriculture. (1) Total trade, with the exception of live animals.
(2) All trade, including live animals (figures based on imports).
(3) Carcass weight.
(4) EUR 12.
Table 7
1994 1995 (4)
4 5 7445 7380 -556 456 1073 1810 7319 20,9 101,7
Gross internal production and consumption of meat (1)
Relative share %
1992 1993
1 2 3
Gross internal production
- pigmeat 42,6 44,9 -beef/veal 24,8 22,8 - poultrymeat 20,5 20,4 - sheepmeat and goatmeat 3,5 3,4 -equine meat 0,1 0,3
-other 24 25
Total 94,1 94,3
Edible olfals 59 57
Total 100 100
Meat consumption
- pigmeat 43,3 44,1 -beef/veal 22,9 23,1 - poultrymeat 20,0 19,6 - sheepmeat and goatmeat 4,5 4,3 - equine meat 0,5 0,5
-other 27 28
Total 93,8 94,3
Edibleof'fals 62 57
Total 100 100
Source: European Commission, Directorate-General for Agriculture. (1) Carcass weight for meat.
(2) EUR 12.
1994 4 44,7 21,8 21,5 3,4 0,1 26 94,2 58 100 44,2 22,5 20,6 4,2 0,5 27 94,7 53 100 1000t
1995 1992 1993 1994
5 6 7 8
44,4 14444 15247 15122 22,6 8378 7743 7380 21,7 6932 6914 7259 3,2 1182 1169 1142 0,1 49 97 48 25 817 848 892
94,5 31802 32018 31843
55 2000 1952 1970
100 33802 33970 33813
kg/head
44,3 40,8 41,3 41,1 21,9 21,6 21,6 20,9 20,9 18,9 18,4 19,1 4,3 4,2 4,0 3,9 0,5 0,5 0,5 0,4 29 25 26 25
94,7 88,5 88,4 88,0
53 58 53 49
100 94,3 93,7 92,9
EUR15
%TAV
~
1994 6 8115 X
7967 X
-145 X
377 X
1006 X
2007 X
7483 X
20,1 X
108,4 X
EUR 15 (2)
%TAV
1995 1995 1994 9 10
15959 5,5 8115 10,0 7788 7,3 1162 1,8 54 12,1 895 04
33973 6,7
1980 05
35953 6,3
40,6 -1,2 20,1 -3,8 19,2 0,5 3,9 0,0 0,4 -2,7 26 36
86,9 -1,3
48 -1 7
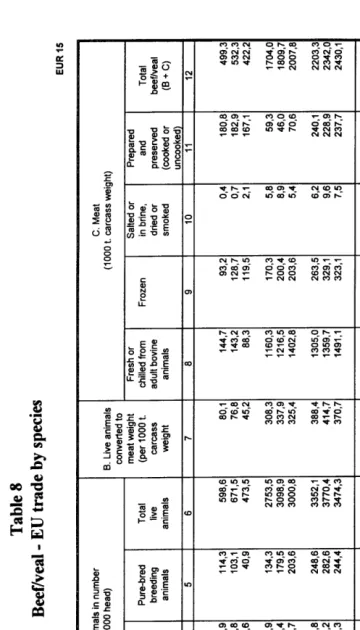
[image:15.585.79.511.340.701.2]Table 8 Beef/veal -EU trade by species A. Live animals in number (per 1000 head) Calves Adult Pure-bred bovine breeding animals animals 1 2 3 4 5
IMPORTS: Extra-EU
1993 (1) 395,4 88,9 114,3 1994 (1) 477,6 90,8 103,1 1995 407,0 25,6 40,9 lntra-EU 1993 (1) 1757,2 861,9 134,3 1994 (1) 1964,0 955,4 179,5 1995 1938,5 858,7 203,6 Total 1993 (1) 2152,6 950,8 248,6 1994 (1) 2441,6 1046,2 282,6 1995 2345,6 884,3 244,4
EXPORTS: Extra-EU
1993 (1) 3,1 400,4 78,9 1994 (1) 4,8 440,1 88,0 1995 4,1 521,1 134,9 lntra-EU 1993 (1) 1712,0 1024,7 117,2 1994 (1) 2065,5 1085,4 106,1 1995 1602,0 1058,0 108,3 Total 1993 (1) 1715,1 1425,1 196,1 1994 (1) 2070,3 1525,5 194,1 1995 1606,0 1579,1 243,3 Sources: European Commission, Directorate-General for Agriculture and Eurostat. NB: Coefficients: -Live animals: Carcass weight
=
live weight x 0,50.Total live
animals
6
598,6 671,5 473,5 2753,5 3098,9 3000,8 3352,1 3770,4 3474,3 482,5 532,9 660,1
2853,9 3257,0 2768,3 3336,4 3789,9 3428,4
-Boneless meat ) Product weight x 1 ,3
=
carcass weight. -Prepared and preserved meat ) (1) EUR 12. B. Live animals converted to meat weight (per 1000 t.carcass weight
7
80,1 76,8 45,2 308,3 337,9 325,4 388,4 414,7 370,7 143,2 147,9 193,5 336,5 375,7 374,3 479,7 523,6 567,7
[image:16.836.101.461.51.681.2]Table 9
Net balance of external trade (1) in meat (2) and self-sufficiency
Net balance (1)
EUR15 1000t
1992 1993
(3) (3)
1 2 3
Meat (2):
-pigmeat 391 819
-beef/veal 751 729
- poultrymeat 361 504
- sheepmeat and goatmeat -256 -240
- equine meat -129 -67
-other -57 -58
Total 1061 1687
Edible offals -18 97
Total 1043 1783
Source: European Commission, Directorate-General for Agriculture. (1) Exports minus Imports.
(2) Including live animals, carcass weight equivalent. (3) EUR 12.
1994 (3)
4
862 688 498
-236
-110
-53
1650
148
1798
Self-sufficiency
%
1995 1992 1993 1994
(3) (3) (3)
5 6 7 8
810 102,9 106,2 106,1
7n 112,0 104,0 101,7
664 105,8 108,1 107,5
-247 82,4 83,0 82,9
-100 27,3 29,4 30,5
-87 93,5 93,3 94,4
1816 104,5 103,8 103,3
183 99,1 105,3 108,1
1999 104,2 103,9 103,6
1995
9
105,4 108,4 108,8 82,5 35,0 91,1
105,1
110,2
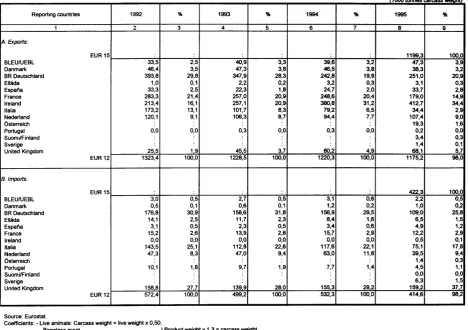
Table 10
Beef/veal - trade with non-member countries
(1000 tonnes can:ass weiahtJ
Reporting countries 1992 % 1993 % 1994 % 1995 %
1 2 3 4 5 6 7 8 9
A. Exports:
EUR15 : : : : : 11993 1000
BLEUIUEBL 33,5 2,5 40,9 3,3 39,6 3,2 47,3 3,9 Danmark 46,4 3,5 47,3 3,8 46,5 3,8 38,3 3,2 BR Deutschland 393,8 29,8 347,9 28,3 242,8 19,9 251,0 20,9
Ellllda 1,0 0,1 2,2 0,2 3,2 0,3 3,1 0,3
Espal\a 33,3 2,5 22,3 1,8 24,7 2,0 33,7 2,8 France 283,3 21,4 257,0 20,9 248,6 20,4 179,0 14,9 Ireland 213,4 16,1 257,1 20,9 380,8 31,2 412,7 34,4 ltalia 173,2 13,1 101,7 8,3 79,2 6,5 34,4 2,9 Nederland 120,1 9,1 106,3 8,7 94,4 7,7 107,4 9,0
Osterreich : : : : 19,3 1,6
Portugal 0,0 0,0 0,3 0,0 0,3 0,0 0,2 0,0
Suonu/Finland : : : : 3,4 0,3
Sverige : : : 1,4 0,1
United Kingdom 255 1 9 455 37 602 49 681 57 EUR12 1323,4 100,0 1228,5 100,0 1220,3 100,0 1175,2 98,0
B. Imports:
EUR15 : : : : : 4223 1000
BLEUIUEBL 3,0 0,5 2,7 0,5 3,1 0,6 2,2 0,5
Danmark 0,5 0,1 0,6 0,1 1,2 0,2 1,0 0,2
BR Deutschland 176,8 30,9 158,6 31,8 156,9 29,5 109,0 25,8
Ellada 14,1 2,5 11,7 2,3 8,4 1,6 6,5 1,5
Espal\a 3,1 0,5 2,3 0,5 3,4 0,6 4,9 1,2
France 15,2 2,6 13,9 2,8 15,7 2,9 12,2 2,9
Ireland 0,0 0,0 0,0 0,0 0,0 0,0 0,5 0,1
ltalia 143,5 25,1 112,8 22,6 117,6 22,1 75,1 17,8 Nederland 47,3 8,3 47,0 9,4 63,0 11,8 39,5 9,4
Osterreich : : : : : 1,4 0,3
Portugal 10,1 1,8 9,7 1,9 7,7 1,4 4,5 1,1
Suomi/Finland : : : : : 0,0 0,0
Sverige : : : 6,3 1,5
Un1ted Kingdom 1588 27 7 1399 280 1553 292 1592 377 EUR 12 572,4 100,0 499,2 100,0 532,3 100,0 414,6 98,2
Source: Eurostat.
Coefficients: - Live animals: Carcass weight = live weight x 0,50.
3. Bovine Spongiform Encephalopathy
Bovine Spongiform Encephalopathy (BSE) is a disease of cattle that first appeared in November 1986 in the United Kingdom and has progressively taken epidemic proportions in the United Kingdom's cattle herd during most of the following ten years but is now on the decline.
It is thought that BSE in the United Kingdom was triggered by changes in the production methods used to obtain meat-and-bone meal from animal materials. Because meat-and-bone meal is used as feedingstuff for cattle, these changes, especially the lowering of the processing temperature during rendering, are believed to have resulted in failure to completely de-activate the infectious agent present in the material of origin.
Measures adopted
bythe European Union from 1989 until March 1996
The European measures have been targeted at the protection of cattle and European consumers against any hypothetical possibility of transmission of the disease from cattle. They have strictly followed the recommendations of the Commission's Scientific committees. The United Kingdom adopted a series of control measures for BSE and the Community has adopted a series of measures to restrict trade in bovine animals and products from the United Kingdom.
By Commission Decision 94/381/EC the use of mammalian meat-and-bone meal in ruminant feed was prohibited throughout the EU, and minimum parameters for the rendering of cattle and other ruminant material were laid down in 94/382/EC for the whole of the EU.
The 22 March 1996 scientific advice
andCommission Decision 961239/EEC
On 20 March 1996, the United Kingdom Spongiform Encephalopathy Advisory Committe (SEAC), after considering ten cases of Creutzfeldt-Jacob disease in younger people identified in the United Kingdom, declared the following: 11
Although there is no direct evidence of a link, on current data and in the absence of any credible alternative the most likely explanation at present is that these (human) cases are linked to exposure to BSE before the introduction of the SBO ban in 1989. This is cause for great concern. 11
This information caused a crisis throughout the Union and consumer confidence in bovine meat fell dramatically, some Member States being more severely affected than others.
Milk and milk products, which an Expert Consultation by the World Health Organisation have confirmed pose no risk in respect ofBSE, are not included in that prohibition.
The United Kingdom implemented further measures to control BSE in its territory and to protect human and animal health, such as extending the SBO ban to become SBM (specified bovine material) ban by including further tissues and increasing the controls on removal of SBM. The UK prohibition of meat from cattle over 30 months (OTM) of age entering any food or feed chain was welcomed by the Council on 1 to 3 of April 1996 and the Commission adopted a Regulation for Community financing of the purchase of UK animals older than 3 0 months for destruction.
The Commission undertook as soon as possible to assess the export ban and consulted the Scientific Veterinary Committee especially on the safety of gelatin, tallow, semen and embryos. Acting upon the advice of the Committee, Decision 96/362/EC amending 96/239/EC was adopted on 11 June, whereby the ban on semen was lifted.
The parameters for the production of tallow and gelatine were defined, and gelatine and tallow exports could resume once the establishments had been approved and inspected by the Commission and once other preconditions been met. However, certain scientific data concerning the deactivation of the agent during gelatine manufacture became invalid. There has been no approval of UK establishments which produce gelatine from UK bovine material for the purpose of trade.
Commission inspection teams assisted by experts from Member States made several missions to the United Kingdom, Portugal and Switzerland in order to assess the measures taken for BSE.
The UK prohibited the use of mammalian materials in food for, all farm animals including fish. The programme for selective slaughter of animals most likely to having been exposed to infected meat-and-bone meal approved on 24 June 1996 by the Standing Veterinary Committee was delayed subject to further evaluation by the UK in the light of new scientific data but has now been implemented.
Commission Decision 96/449/EC adopted on 18 July 1996 required that all animal waste from mammalian animals in the EU be processed by a method that has been demonstrated to de-activate the agents of scrapie and BSE. The only such system is one operating at 133 degrees C at 3 bar for 20 minutes.
In Portugal there was extreme public concern about BSE resulting in a sharp fall in beef consumption. A plan for eradicating BSE in Portugal was approved 'by Commission Decision 96/381/EC and for France by Decision 97/18/EC. Ireland has also presented a similar eradication programme. Community market regulatory mechanisms are continually being adapted to compensate Member States for the costs incurred by the present crisis.
On 10 June 1996 t~e Commission invited third countries to a seminar on BSE, at which information was given about the latest developments and the measures taken by the European Community for the protection of public and animal health
During the June 1996 Florence summit the Commission presented its position paper on BSE in which a general framework programme was laid down for a gradual lifting of the ban on trade in UK bovines and bovine products. This was agreed by
all
Member States and was an important step for restoring the internal market. The framework programme contained several preconditions for a lifting of the ban such as implementation of a selective slaughter programme, improving animal identification and movement records, legislation for and removal of all meat-and-bone meal from agricultural premises and feed mills, effective implementation of the OTM-scheme and improved methods for the removal of SBM.Since March 1996 scientific committees have been convened several times to assess different public health and animal health issues. At present the safety of milk is being further assessed and the status of all member states as regards transmissible spongifonn encephalopathies is being evaluated in order to assess the need for further measures in the Union. Many of the research projects which have been initiated since the beginning of the epidemic are being finalized and thereby new information concerning for example, maternal transmission, risk in embryos, etc. are causing the present rules to be continually assessed in the light of the latest scientific knowledge.
On 9 October 1996, the Commission presented a report by ProfWeissman concerning priorities for research on transmissible spongiform encephalopathies in the future. The Commission recognizes that the absence of scientific certainty of the disease has created severe difficulties in dealing with the crisis and that it is imperative from a point of view of eradicating the disease and protecting human health that research efforts are increased.
On 21 October 1996 the Scientific Veterinary Committee gave advice to the Commission on the exclusion of certain risk materials from food and feed. This was in application of the recommendations from an Expert Consultation in World Health Organization on 3 April 1996. On the basis of this advice, the Commission made a proposal for the use of these materials to be banned, but this proposal was rejected by Council by a simple majority on 17 December 1996.
A Commission Decision has, however, been adopted and enters into force on 1 July 1997 which has the impact of prohibiting certain tissues in the production of cosmetics. The Commission will consider follow-up actions for other products.
THE COMMON MARKET ORGANISATION
Chapter 1-21 of the budget covers the following products:
• live animals;
• meat: fresh, chilled, frozen, other;
• processed products: other preparations and preserves of meat or offal, cooked or uncooked;
• offal.
The common market organisation in the beef and veal sector is governed by Council Regulation
(EEC) No 805/68, as last amended by Regulation (EC) No 2222/96. The marketing year runs f
rom I July to 30 June of the following year, beginning in 1996/97.
1. Import and export arrangements
The previous import and export arrangements laid down that a customs duty and a variable levy
were charged in relation to the difference between the guide price and the market price upon
import. The Council laid down the guide price for adult cattle, i.e. the desired average price on
the Community market for all qualities marketed during the marketing year. This was abolished
with the implementation of the GATT agreement on 1 July 1995. Since this agreement entered
into force, the system has been replaced by a fixed customs duty. There are special schemes in
certain fields.
In
so far as it is necessary to enable exports based on the market value or the prices of these
products, the difference between these market values and prices within the Union may be
covered by an export refund. This is the same for the whole Union and may be varied according
to use/destination.
Itis granted upon application by the person concerned. The level of refunds
is established periodically, and may be amended in the interim where necessary at the request of
a Member State.
In
order to take into account the possible effects of the BSE crisis, the forecast expenditure has
been revised.
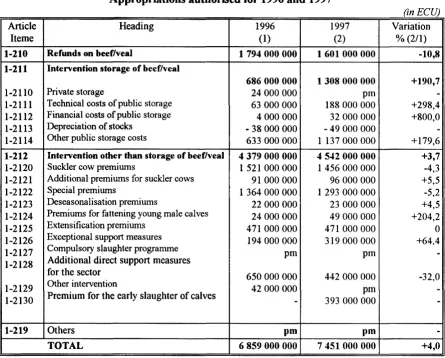
Itis at ECU 1 601 million for 1997 as against ECU 1 794 million for 1996.
Table 11
Appropriations authorised for 1996 and 1997
(in ECU)
Article Heading 1996 1997 Variation
lteme (1) (2) % (2/1)
1-210 Refunds on beef/veal 1 794 000 000 1601 000 000 -10,8 1-211 Intervention storage of beef/veal
686 000 000 1308 000 000 +190,7
1-2110 Private storage 24 000 000 pm
-1-2111 Technical costs of public storage 63 000 000 188 000 000 +298,4 1-2112 Financial costs of public storage 4 000 000 32 000 000 +800,0
1-2113 Depreciation of stocks -38 000 000 -49 000 000
-1-2114 Other public storage costs 633 000 000 1 137 000 000 +179,6
1-212 Intervention other than storage of beef/veal 4 379 000 000 4 542 000 000 +3,7 1-2120 Suckler cow premiums 1 521 000 000 1 456 000 000 -4,3 1-2121 Additional premiums for suckler cows 91 000 000 96 000 000 +5,5 1-2122 Special premiums 1 364 000 000 1 293 000 000 -5,2 1-2123 Deseasonalisation premiums 22 000 000 23 000 000 +4,5 1-2124 Premiums for fattening young male calves 24 000 000 49 000 000 +204,2 1-2125 Extensification premiums 471 000 000 471 000 000 0 1-2126 Exceptional support measures 194 000 000 319 000 000 +64.4
1-2127 Compulsory slaughter programme pm pm
-1-2128 Additional direct support measures
for the sector 650 000 000 442 000 000 -32,0
1-2129 Other intervention 42 000 000 pm
-1-2130 Premium for the early slaughter of calves
-
393 000 000-1-219 Others pm pm
-TOTAL 6 859 000 000 7 451 000 000 +4,0
Source: Final adoption of the general budget of the European Union for the financial year 1997, OJ L 44 of 14 February 1997.
2. Price and intervention system
In order to stabilise markets and ensure a fair level of income for the farmers concerned, avoiding or mitigating a significant decline in prices, provision is made for intervention measures. Compulsory use of a Community scale for grading carcases makes it possible to establish a single buying-in price for each grade of fresh or chilled meat eligible for intervention. For each grade or group, the buying-in prices and the quantities admitted for intervention are determined under tendering procedures which ensure equal access for all involved.
In order to reduce the amount of purchasing by inteJVention agencies, conditions and activating prices for inteiVention are laid down. InteiVention may be activated when, in a Member State or in a region of a Member State, the following two conditions occur simultaneously for two consecutive weeks:
a) the average market price in the Community for the grade or group of grades concerned is below 84% of the corresponding inteiVention price;
b) the average market price nationally for the grade or group of grades concerned is below 80% of the inteiVention price.
Buying-in under the normal arrangements may not exceed the following quantities per year for the Union as a whole: 500 000 tonnes in 1997 and 350 000 tonnes from 1998.
Acting as a safety net, a buying-in system relating to all bids presented may be introduced if, for two consecutive weeks:
a) the average market price in the Community for young non-castrated males under two years old or castrated males as defined in the Community scale is below 78% of the inteJVention pnce;
b) the average market price tn a Member State for these cattle falls below 60o/o of the inteiVention price.
In this case, buying-in is carried out for the categories concerned in the Member States or regions in which the price level is below this limit. The quantities bought in under this safety system are not taken into account in applying the maximum quantities for intervention.
The downward trend in beef7veal consumption in the European Union as a whole should increase inteJVention buying. This trend has been strengthened as a result of the BSE crisis. It is very difficult to predict accurately the extent of the resulting decline in consumption and, therefore, to forecast the costs of buying-in. In the meanwhile, the authorized appropriations have been considerably increased 2.
In order to avoid or mitigate a fall in prices, private storage aid may also be granted. This type of inteJVention is more flexible both quantitatively and qualitatively. The amount of aid has to be established taking into account the costs arising from storage, either under a tendering procedure or by establishing an ali-in price in advance. There are no appropriations planned under
item
1-2110 for 1997.2
3. Premium system
From 1993 onwards, the premium system
has
been adjusted to the reduction in intervention prices resulting from the CAP refonn. The system is now incorporated into the basic legislation on the market organisation.There are various premiums:
• suck/er cow premium
and
special premium,
to offset the loss of income resulting from the reduction in the intervention price introduced under the CAP refonn; along with export refunds, these two premiums account for most of the expenditure in the beef7veal sector (approximately 40%
of expenditure forecast for 1996 and 1997);• additional premium for suckler cows
in regions where development is lagging behind;• deseasonalisation premium
aimed at establishing market equilibrium throughout the year;• processing premium
andpremium for the early slaughter of calves
are intended to reduce meat production by removing lighter calves from production or encouraging their marketing, so as to reduce the number of animals fattened for red meat;• _extensification premium
to promote extensive stock raising.Item 1-2120: Suckler cow premiums
A producer keeping suckler cows on his fann may, on application, receive a premium for maintaining a herd of suckler cows. This is granted to two categories of producers:
a) those who deliver no milk or dairy products from their fann during a period of 12 months from the date of submission of their application and who keep, for at least six months in succession, a number of suckler cows at least equal to that for which an application for a premium has been made;
b) small dairy fanners (for whom the individual milk reference quantity does not exceed 120 000 kg), provided that they keep, for at least six months, a number of suckler cows at least equal to that for which the premium application has been made.
Entitlement to the premium is restricted by an individual ceiling corresponding to the number of animals for which a premium is granted during a reference year chosen by the Member State. Entitlements may be sold or transferred with or without fanns.
The Member States establish an initial reserve with duties levied on producers and a specific reserve for disadvantaged areas. As a temporary measure, steps were taken for 1997 and
The amount of the premium is laid down under Regulation (EEC) No 805/68 at ECU 144.90 per eligible animal for 1995.
There are two effects which, taken together, explain the variation in appropriations requested under item 1-2120 for the two financial years:
a) the assumed number of animals for which application for a premium would be made is revised downwards;
b) beginning in the 1997 financial year, expenditure under item 1-2127 for payment of compensation to Portuguese farmers which, in 1996 ( = budget 1997), amounted to ECU 12.08/head is included in item 1-2120. Item 1-2127 is therefore deleted from 1997.
Item 1-2121: Additional premiums for stickler cows
Member States may grant an additional national premium. On holdings in regions regarded as lagging behind in their development, and in Member States particularly specialising in suckler herds, part of this is funded by the EAGGF. This additional premium may not exceed ECU 30.19 per cow, the first ECU 24.15 being chargeable to the EAGGF Guarantee Section. Expenditure forecasts for 1996 were based on applications for premiums for 4 million head in 1995, while the forecast for 1997 is that premium applications will amount to 3.80 million head in 1996. This expected fall in applications does not lead to a reduction of appropriations under
item 1-2121 because it is offset by the rise in the double rate coefficiene.
Item 1-2122: Special premiums
Producers keeping male cattle on their farms may apply for a special premium. This is granted within ceilings set at regional level under Article 4b ofRegulation (EEC) No 805/68 on up to 90 animals per age bracket ( 10 months and 22 months) per calendar year and per holding. For the 1997/98 marketing year, the payment of this double premium has been replaced by payment of a single premium which is higher in the case of male non-castrated animals.
Where the total number of animals within a region which are the subject of a premium application exceeds the regional ceiling, the number of eligible animals per producer during the calendar year in question is reduced in proportion to the excess.
To quality for the premium, each animal for which an application is made must be kept for fattening by the producer for at least two months for each age bracket. Member States may choose to grant the premium at the farm or at the time of slaughter.
3
The premium is fixed at ECU 108.7 from 1997 for castrated animals and at ECU 135 for non-castrated animals. The appropriations requested
in
1997 under item 1-2122 are 16.4% down onthe previous year due to a forecast reduction
in
applications.It is important to point out that the number of animals eligible for the special premium or for the suckler cow premium is limited by the application of a density factor of(for 1996) 2.0 "livestock units" (LU) per hectare devoted to forage for the animals for which a premium application has been made.
Item 1-2123: Deseasonalisation premiums
In 1997, producers in Member States where the number of castrated male cattle slaughtered during the period 1 September to 30 November in a single year is more than 35% of total annual slaughterings of castrated male cattle may qualify for an additional "deseasonalisation" premium. This premium is set at ECU 72.45 for each castrated male bovine animal for which the special premium has already been paid, on condition that slaughter is deferred to the period 1 January to 30 April of the following year. In the Member States with a substantial production of male cattle, this premium is reduced progressively to ECU 18.11 for slaughterings carried out up to the twenty-third week of the following year.
Items 1-2124
and
1-2130: Premiums for fattening young male calvesand
for the early slaughter of calvesMember States decided that from December 1996 operators would be eligible for:
• a premium of ECU 120 (for a dairy calf) or ECU 150 (for a calf other than a dairy breed) for processing young male calves withdrawn production before they were 20 days old. In 1996 the number of animals slaughtered was 525 000 (the premium, the entire cost of which comes from the Community budget, was applied in the UK, Portugal and France) and/or
• a premium of ECU 60 for young calves whose carcase weight was 15% less than the average weight of calves slaughtered in the Member State concerned.
Item 1-2125: Extensification premiums
Item 1-2126: Exceptional support measures
Foil owing the decisions by the Council of Agriculture Ministers on 1, 2 and 3 April 1996, one of the measures decided upon by the Commission [Regulation (EC) No 716/96 of 19 April 1996),
in the context of eradicating BSE, permits the slaughter and destruction of animals, in particular culled animals in the United Kingdom, Portugal and France. The animal's value is established on the basis of the tnarket price prior to the crisis. The Community budget will refund 70% of the value. The Members States concerned will bear the remaining 30% and the costs associated with slaughter and destruction. In 1996, 1 130 000 animals were slaughtered in the United Kingdom. As this destruction is a market measure, and in order to identify it more readily from 1997 onwards, it is intended to fund compensation of the value of the destroyed animals from appropriations under a new item 1-2126. The appropriations required are estimated at ECU 319
million, after adjustment for the effects of the double rate, based on aid amounting to ECU 3 92/head and an assumption of 800 000 applications.
Item 1-2127: Compulsory selective slaughter programme
The new item 1-2127 is intended to cover expenditure relating to the compulsory selective slaughter programme for animals and/or livestock identified as most likely to have been exposed to meat and bone meal infected with BSE. This programme is to be approved by the Commission in accordance with the Standing Veterinary Committee procedure, on the basis of a programme to be presented by the Member States concerned, in particular the United Kingdom. The cost of this measure, 70% co-financed by the Community budget, depends upon the programmes and the amount of individual compensation approved. Given the high degree of uncertainty surrounding this programme, no precise evaluation has been carried out. Item 1-2127 is give apm (token entry) and will be funded in accordance with requirements by transfers from the temporary reserve in Chapter 1-70. The amount ofthis reserve is the balance between the guideline and the total of all foreseen agricultural expenditure rather than a precise forecast of expenditure.
Item 1-2128: Additional direct support measures for the sector
This appropriation covers the cost of the additional direct support measures in the bovine animal sector agreed in principle by the Agriculture Council on 30 Octobre 1996 as part of the bovine sector emergency plan to combat the consequences ofBSE.
Item 1-2129: Other intervention
Given the difficult circumstances surrounding BSE, and in order to restore consumer confidence in beef and veal, it has been necessary to completely withdraw from the market calves born in the United Kingdom and fattened in France, Belgium and the Netherlands. As a result, the slaughter and destruction of 161 000 calves aged between one and six months, funded at a rate of70% by the Community budget, was entered in the 1996 budget under item 1-2129. In 1997,
item 1-2129 is given a token entry.
4. Measures to promote consumption
ANNEX
Promotion measures: Beef/veal
Appropriations authorised 1996 Appropriations authorised 1997
commitments payments commitments
10 10 12
1.
TITLE OF OPERATION
Promotion and marketing of quality beef and veal.
2.
BUDGET HEADING
Bl-38
3.
LEGAL BASIS
Council Regulation (EEC) No 2067 /92;
Commission Regulation (EEC) No
1318/93.4.
DESCRIPTION OF OPERATION
4.1
General aim of the operation:
payments
12
(ECU million)
Variation%
commitments payments
+20 +20
To provide infonnation to the consumer about quality beef and veal which has characteristics
that are identifiable and verified
in
order to maintain a satisfactory level of consumption and to
upgrade the image of meat which has been produced in accordance with more stringent rules.
4.2
Period covered
bythe operation and procedures laid down for renewing it
Pennanent operation: annual or bi-annual programme.
5.
CLASSIFICATION OF EXPENDITURE
5.1
Compulsory expenditure
6. TYPE OF EXPENDITURE
600/o or 400/o funding of the real costs for proposals adopted by decision of the Commission from among those put forward by professional or interprofessional organisations via the Member States. The funding rate depends on whether or not there is control of the full set of measures.
7. FINANCIAL IMPACT
7.1 Method of calculating the cost of the measure
Itemised budget in accordance with the eligibility criteria set out in Annex III of the contracts for "indirect management".
7.2 Breakdown by elements of the operation
8. FRAUD PREVENTION MEASURES; RESULTS OF MEASURES TAKEN
Indirect management:
quarterly checks by the competent bodies as set out in the standard contract; deposit of a secured advance (110%) and performance guarantee (15%); where appropriate, on-site audits by the Commission.
9. ELEMENTS OF COST-EFFECTIVENESS ANALYSIS
9.1 Specific quantifiable objectives, target population
The objective is to ensure that in the medium term about 10-15% ofbeefi'veal consumption will be covered by these programmes.
The tonnage covered by promotion measures has risen from 150 000 tonnes in 1994 to about 350 000 tonnes in 1997 (about 5% of consumption).
The operations are targeted at all consumers and are based in particular on publicity campaigns
in the media, dissemination of information via the printed media, promotion at points of sale, public relations activities and participation in fairs or exhibitions.
9.2
Justification of the operation
9.3
Monitoring and evaluation of the operation
The two performance indicators for the measure are as follows:
a)
the market share for meat as monitored and identified, obtained by comparing the
consumption volumes monitored;
b)
changes in the image ofbeefand veal in the mind of the consumer.
The first evaluation reports on the first campaign have just reached the Commission. They show
an increase in sales of high-quality meat and the need for long-term action to restore the image
of beef and veal and to achieve the objectives set out above.
The need to pursue and reinforce the operation is also clear, given the current situation.
II - SHEEPMEAT AND GOATMEAT
THE SITUATION OF THE MARKETS
World sheepmeat and goatmeat production, currently estimated at approximately I 0 million tonnes annually, appears to be in decline in most of the major production regions in recent years. Production has fallen particularly in New Zealand, Australia and Eastern Europe.
The main reasons for this trend appear to be reduced profitability in comparison to other sectors including milk and forestry and the decreased demand for and value of wool.
World trade continues to be dominated by New Zealand and Australia with exports of 400 000 t and 300 000 t respectively. The European Union is the world's second largest producer after China and its largest importer and consumer. Exports from the Union are negligible.
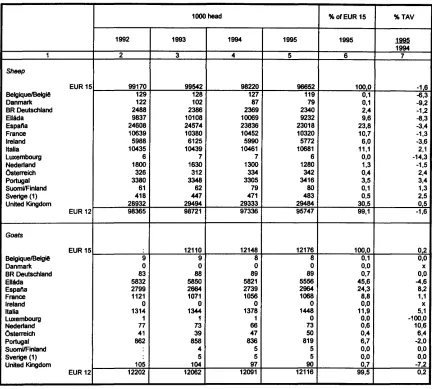
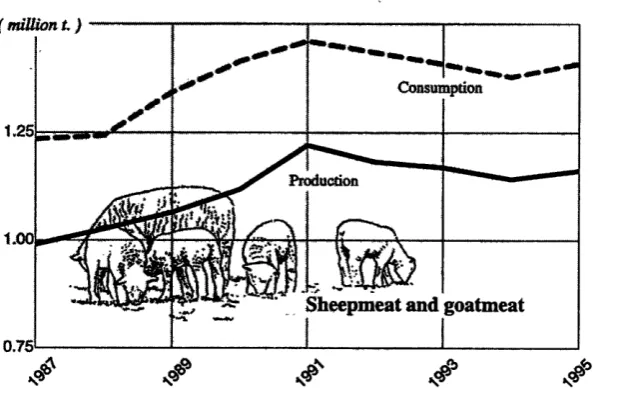
The number of sheep in the European Union is almost 94 million, with 12 million goats, and the Union is the world's third largest producer of sheepmeat after China and the States comprising the former USSR (Table 1). Recent years have seen a halt in the long-term upward trend in sheepmeat and goatmeat production since 1970 (see Graph). Production has stabilised at a level slightly above 1.1 million tonnes, to which may be added the small amount produced in 1995 by the three new Member States. Forecasts indicate that production in I996 should show a slight fall compared with 1995. Production is expected to fall by I. 6% to I I63 000 t in I996 due, in particular, to a significant fall in UK production which may mark the beginning of a rise in the breeding ewe population there (Tables 2 and 3). Consumption is set to rise marginally to 1 418 000 t as a result of increased consumption in the United Kingdom in the context of the BSE crisis (Table 4).
Intra Community trade rose in 1995 to 270 000 t as exports from the UK in particular continued to expand. In 1996, this figure is likely to decrease significantly due to an increase in domestic lamb consumption in the U.K. France remains the most important recipient of internal trade (Table 5).
In the first three months of 1996, market prices were weak due largely to consumer resistance. Since then, due in very large measure to the difficulties facing the beef industry, demand for lamb has been high with the result that market prices have been very significantly above those of recent years. As a result the average Community market price for lamb in 1996 reached ECU 363 per I 00 kg up I6% on 1995 (Table 6).
With regard to exports, the Union exports a small amount, about
5
000 tonnes per year. The degree of self-sufficiency is at present getting on for 800/o.Imports into the Union are expected to reach 270 000 t in 1996 up by 6% on 1995 as supplier countries take advantage of the strong market for sheepmeat. New Zealand, in particular, will probably fulfil almost all of its tariff free quantity of 226 700 t. However, despite the buoyant market, Eastern European countries are likely to supply less than in 1995 due to continued depletion of their own sheep flocks (Tables 7 and 8).
Imports into the Community are carried out principally under tariff reduced or free WTO (World Trade Organisation) quotas together with additional quantities provided for in the Europe Agreements. For market management reasons the quotas are managed on a calendar year basis. The total tariff reduced or free import possibility was almost 316 000 t in 1996.
The level of the Community ewe premium in 1995 was ECU 24.821 per ewe and the rural world premium was ECU 6.641 per ewe (see below "The common market organisation", chapter 5). Private storage stocks at the end of 1995 reached 750 t, mainly in Ireland.
In 1996 to date, two advances on the ewe premium have been fixed totalling ECU 12 3 64.
Although the conditions for opening private storage were met on several occasions, it was used during 1996 only for 100 tonnes in Finland.
Table 1
Sheep and goat numbers (preceding December)
1000 head % ofEUR 15 %TAV
1992 1993 1994 1995 1995 ~
1994
1 2 3 4 5 6 7
Sheep
EUR15 99170 99542 98220 96652 1000 -1 6
Belgique/Belgi! 129 128 127 119 0,1 -6,3
Oanmark 122 102 87 79 0,1 -9,2 BR Deutschland 2488 2386 2369 2340 2,4 -1,2 Elljda 9837 10108 10069 9232 9,6 -8,3 Espatia 24608 24574 23836 23018 23,8 -3,4 France 10639 10380 10452 10320 10,7 -1,3 Ireland 5988 6125 5990 5772 6,0 -3,6 ltalia 10435 10439 10461 10681 11,1 2,1 Luxembourg 6 7 7 6 0,0 -14,3 Nederland 1800 1630 1300 1280 1,3 -1,5 Osteneich 326 312 334 342 0,4 2,4 Portugal 3380 3348 3305 3416 3,5 3,4 Suomi/Finland 61 62 79 80 0,1 1,3 Sverige (1) 418 447 471 483 0,5 2,5 United Kingdom 28932 29494 29333 29484 305 05 EUR 12 98365 98721 97336 95747 99,1 -1,6
Goats
EUR15 : 12110 12148 12176 1000 02
Belgique/Belgi! 9 9 8 8 0,1 0,0
Dan mark 0 0 0 0 0,0 X
BR Deutschland 83 88 89 89 0,7 0,0 Elljda 5832 5850 5821 5556 45,6 -4,6 Espana 2799 2664 2739 2964 24,3 8,2 France 1121 1071 1056 1068 8,8 1,1
Ireland 0 0 0 0 0,0 X
ltalia 1314 1344 1378 1448 11,9 5,1 Luxembourg 1 1 1 0 0,0 -~00.0
Nederland 77 73 66 73 0,6 10,6 Osteneich 41 39 47 50 0,4 6.4 Portugal 862 858 836 819 6,7 -2,0 Suomi/Finland : 4 5 5 0,0 0,0 Sverige (1) : 5 5 5 0,0 0,0 United Kingdom 105 104 97 90 07 -7 2 EUR12 12202 12062 12091 12116 99,5 0,2
0.75~---~---~---~---~
~
A,.qj
[image:36.570.133.452.66.264.2]Sourc~: European Commission. DO for Agriculture.
Table 2
Sheep and goats slaughtered
1000hnd %TAV Average C8R:811 weight In kg %TAV
1992 1993 1994 1995 Jii5 1992 1993 1994 1995 1Im§
1994 1994
1 2 3 4 5 6 7 8 9 10 11
EUR15 .. 83951 82190 81257 79993 -16 141 140 140 142 14
BLEUIUEBL 316 238 205 226 10,2 20,1 20,0 20,1 20,2 0,5
Danmark 90 93 83 89 -16,9 22,3 21,5 22,6 21,7 -4,0
BR Deutlchland 2274 2206 2109 2089 ·1.9 19,3 18,5 19,0 20,2 6,3
Ellllda 12492 12459 12494 12531 0,3 10,6 10,4 10,4 10,2 -1,9
Elpal\a 22845 22305 22566 21976 -2,6 10,8 10,7 10,8 11,0 1,9
France 10005 9796 9257 8706 ~.o 17,2 16,6 16,7 17,0 1,8
Ireland 4357 4701 4417 4264 -3,5 21,7 21,0 21,0 20,8 -1,0
ltalla 9755 8901 8552 8443 -1,3 8,8 9,1 9,1 9,0 -1,1
Neder1and 723 789 702 643 -8,4 23,7 23,2 24,2 24,6 1,7
Osterrelch" 267 244 280 280 0,0 22,5 22,5 22,5 21,0 -6,7
Portugal 1372 1302 1338 1288 -3,7 10,2 10,5 10,6 10,6 0,0
Suomi/Finland" 61 83 67 75 11,9 19,8 20,6 20,8 18,8 -9,6
SVer1ge" 243 229 220 189 -14,1 17,9 18,6 18,5 18,5 0,0
Unled Ki1gdom 19151 16864 18967 19234 14 186 185 186 189 16
EUR12 83380 81654 80690 79449 -1,5 14,0 13,9 14,0 14,1 0,7
Table3
Gross internal sheepmeat and goatmeat production
1000t
1992 1993 1994
1 2 3 4
EUR15** 1190 1173 1162 BLEU/UEBL 3 3 3
Danmark 2 2 2
Deutschland 45 40 39 Ell6da '129 125 124 Espana 235 225 238 France 156 156 147 Ireland 97 102 99 ltalia 59 59 55 Neder1and 28 29 26 Osteneich** 6 6 6 Portugal 27 26 27 Suomi/Finland** 1 1 1 Sverige** 4 4 4 United Kingdom 397 399 391 EUR12 1179 1166 1151
Source: Eurostat.
Table4
Supply balance - sheepmeat and goatmeat
1000 t
1992 1993
1 2 3
Gross internal production 1182 1169 Imports -live animals (1) 19 15 Exports - live animals (1) 1 1 lntra-EU trade (1) 70 45 Net production 1200 1183 Change in stocks -4 :
Imports (2) 243 231 Exports (2) 5 6 lntra-EU trade (3) 195 208 Internal use 1434 1408 Gross consumption (kg/head/year) 4,2 4,0 Self-sufficiency(%) 82,4 83,0
Sources: Eurostat and European Commission, Directorate-General for Agriculture. (1) Carcass weight.
(2) Carcass weight - All trade with the exception of live animals.
1994 4
(3) All trade in carcass weight, withe the exception of live animals {figures based on imports). (4) EUR 12.
1142 19 1 42 1160 224 6 225 1378 4 82,9 1995 5
1181
-3 -2 41 135 ** 240 -14794
-54 22 7 30 **2 4 400 1168
TableS Sheepmeat and goatmeat -EU trade,
by
species A. Live animals, in number (per 1000 head) Pure-bred breeding Other live animals animals Sheep Goats Sheep 1 2 3 4 5IMPORTS: Extra
EU 1993 (1) 1,3 0,1 1605,2 1994(1) 0,8 0,0 1917,5 1995 1,2 0,3 1656,2 Intra EU 1993 (1) 40,2 12,2 355Q,9 1994(1) 56,7 1,3 3113,5 1995 67,7 0,5 2660,0 Total 1993(1) 41,5 12,3 5156,1 1994(1) 57,5 1,3 5031,0 1995 68,8 0,8 4316,2
EXPORTS: Extra
EU 1993(1) 1,2 0,8 46,5 1994(1) 1,9 0,8 32,8 1995 2,5 1,1 33,5 Intra EU 1993 (1) 33,5 0,1 3053,6 1994 (1) 77,4 0,2 3017,6 1995 27,3 1,2 2368,1 Total 1993 (1) 34,7 0,9 3100,1 1994(1) 79,3 1,0 3050,4 1995 29,8 2,3 2401,6 Sources: European Commission, Directorate-General for Agriculture and Eurostat. NB: Coefficients: • Live animals: Carcass weight = Live weight x 0,47 • Boneless meat ) Product weight x 1, 7 = carcass weight • Prepared and preserved meat ) (1)EUR 12. B. Live animals
converted to
Table6
Market prices for sheepmeat (1)
ECU/kg (2)
1992 1993 1994 1995
1 2 3 4 5
BelgiqueJBelgi! 3,402 2,867 3,246 3,558 Dan mark 2,196 2,044 1,849 2,529 BR Deutschland 2,729 2,591 2,879 3,297 Ellada 3,727 3,077 3,225 3,678 Espatla 3,292 2,847 3,050 3,357 France 2,849 2,758 2,854 3,237 Ireland 2,047 2,074 2,283 2,529 ltalia 3,399 2,927 2,961 3,197 Nederland 2,907 2,768 2,941 3,550 Osterreich : : : 4,254 Portugal 3,251 3,033 3,167 3,822 Suomi/Finland : : : 2,051
Sverige : 2,738
United Kingdom 2,245 2,295 2,522 2,779
Source: European Commission, Directorate-General for Agriculture.
(1) Belgique/Belgi4t Average price: 1) moutons extra (carcass weight 30 kg) - schapen extra (30 kg per stuk) 2) agneaux extra (carcass weight 16 kg) -lammeren extra (16 kg per stuk) Danmark: country 0: lambs 1st quality.
Deutschland: country 0: lambs carcass of 'L' - Mastlammer' quality. Ellada: country 0: 76 % amnos galaktos
24% amnos. Espal\a:
France: country 0 for 'carcasses d'agneaux de boucherie'. Ireland: country 0: 70 % prime quality
30% second quality.
ltalia: Average price: 1) agnelloni (approx.20 kg carcass weight) = 36 % (country 0).
%TAV(3)
~
1994 6
2) agnelli (approx. 10 kg carcass weight)= 64% (markets: Cagliari, Roma, Napoli, Firenze, L'Aquila). Nederland: country 0 'vette lammeren'.
Osterreich: Portugal: Suomi/Finland:
Sverige: Wholesale prices.
United Kingdom: 0 market prices for sheep qualifying for guaranteed prices (pence/kg net on the hoof). (2) Slaughter weight.
(3) Calculated on the basis of prices in national currency.
-9,3 13,4 -4,6 1,8 -3,4 -4,6 -4,9 3,8 0,2
X
1,9
X X
Table 7
Sheepmeat and goatmeat - trade with non-member countries
Reporting 1992
"'
1993 countries1 2 3 4
A. EXPORTS:
EUR15 : : BLEU/UEBL 0,0 0,0
Danmark 0,1 1,8
BR Deutschland 0,3 5,5
Elhllda 0,2 3,6
Espafta 1,5 27,3.
France 0,9 16,4
Ireland 0,1 1,8
ltalia 0,3 5,5
Nederland 0,0 0,0
Osterreich : :
Portugal 0,0 0,0
Suomi/Finland : :
Sverige : :
United Kingdom 21 382 EUR12 5,5 100,0
B. IMPORTS:
EUR15 : : BLEU/UEBL 8,6 3,3
Danmark 3,4 1,3
BR Deutschland 40,0 15,3
Ell~ a 21,8 8,3
Espana 10,6 4,0
France 21,7 8,3
Ireland 0,1 0,0
ltalia 25,1 9,6
Nederland 4,7 1,8
Osterreich : :
Portugal 7,8 3,0 Suomi/Finland : :
Sverige : :
United Kingdom 1181 451 EUR 12 261,8 100,0
Sources: European Commission, Directorate-General for Agriculture and Eurostat. NB: Coefficients: Live animals: Carcass weight: live weight x 0,47
: 0,1 0,1 0,3 0,2 1,9 0,9 0,0 0,0 0,2 : 0,1 : : 25 6,2 : 11,0 3,9 40,7 17,0 5,0 22,5 0,0 17,6 6,4 : 3,6 : 1184 246,0
Boneless meat ) Product weight x 1, 7 : carcass weight Prepared and preserved meat )
;:
Q 1000 tonnes carcass we1g1 I . h
"'
1994"'
1995 %5 6 7 8 9
: : : 65 1000
1,5 0,1 1,3 0,0 0,6 1,6 0,1 1,5 0,1 1,0 4,9 0,3 4,7 0,1 1,5 3,7 0,4 6,2 0,4 6,6 29,8 1,7 23,6 1,8 27,1 14,9 1,1 15,1 1,1 17,6 0,1 0,0 0,3 0,2 2,4 0,1 0,0 0,1 0,0 0,6 3,0 0,0 0,5 0,3 5,2
: : : 0,0 0,3 0,9 0,0 0,0 0,0 0,2
: : : 0,0 0,1
: : : 0,1 2,1
395 33 466 23 348 100,0 7,2 100,0 6,4 97,5
: : : 2538 1000 4,5 11,3 4,6 13,6 5,3 1,6 4,1 1,7 4,1 1,6 16,5 40,0 16,5 40,0 15,8 6,9 13,7 5,6 9,3 3,7 2,0 5,5 2,3 3,5 1,4 9,1 19,8 8,1 18,6 7,3 0,0 0,0 0,0 0,0 0,0 7,2 25,6 10,6 21,2 8,3 2,6 8,3 3,4 5,1 2,0
: : : 1,0 0,4 1,5 3,9 1,6 2,8 1,1
: : : 0,6 0,2
: : : 2,4 0,9
EUR15
1
Total imports
- New Zealand -Argentina -Australia -Hungary -Bulgaria -Poland - ex Yugoslavia -Uruguay -Romania - Other countries
Grand total
Table 8
Imports of sheepmeat (1)
t (2)
1992 1993 1994 {3) (3) (3)
2 3 4
209374 202906 196383 4580 2883 2943 16829 15939 15570 10823 8466 10123 2141 2503 3765 6511 4736 4717 3189 87 803 5025 5508 4458 507 405 739 2856 2661 3178
261835 246094 242679
1995
5
208867 1350 18151 9556 3499 3385 715 4280 748 3208
253754
Sources: European Commission, Directorate-General for Agriculture and Eurostat. (1) Incl. live animals.
(2) Tonnes carcass weight. (3) EUR 12.
%TAV
.1.995 1994
6
X X X
X X X X X X
X
THE COMMON
MARKET
ORGANISATION
The products covered are:
• live sheep and goats;
• meat: fresh, chilled or frozen; • offal;
• processed products: meat and offal, salted, dried or smoked, preserved, other.
The common market organisation in the sheepmeat and goatmeat sector, governed by Council Regulation (EEC) No 3013/89, comprises a pricing system and trade arrangements. The marketing year runs from the first Monday in January to the end of the previous day in the same month of the following year.
1. Import and export arrangements
From 1989 (for meat) and 1990 (for live animals), all imports under voluntary restraint agreements or similar autonomous arrangements were free of customs duties and levies. This situated lasted until 1 July 1995, on which date the trade agreements concluded as part of the GATT negotiations entered into force. For meat, the agreement lays down a zero rate of import duty, and for live animals an import duty of 10% under tariff quotas slightly higher than the quantities previously laid down in the voluntary restraint agreements (around 300 000 tonnes compared with around 280 000 tonnes previously). In addition, the customs duty on live animals was substantially reduced and even unilaterally suspended with regard to the countries of central and eastern Europe.
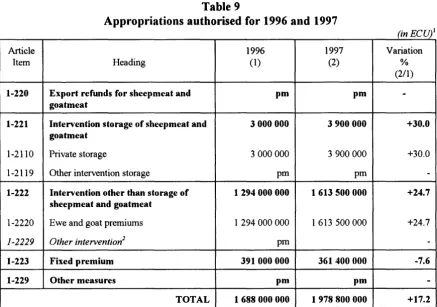
In the past and where necessary in order to permit exports, a refund matching the difference between the prices of the products on the world market and those in the Union could be granted. Thus far, the instrument in question has not been applied. Now, under the new arrangements, it no longer exists. For this reason, no appropriations are entered under Article
1-220 for either 1997 or 1996 (see Table 2).
2. Price arrangements
Each year, the Council fixes the basic price for fresh or chilled sheep carcases. This makes it possible to calculate the ewe premium and serves as a reference for triggering intervention measures. It is the same for the entire Union. The basic price is seasonally adjusted to take account of seasonal variations on this market. The basic price for 1997 is the same as for 1996, namely ECU 5 040.7 /tonne.