METHOD FOR THE ESTIMATION OF ERLOTINIB IN
ITS PHARMACEUTICAL DOSAGE FORM
Dissertation
Submitted in partial fulfilment of the requirement for the award of the degree of
MASTER OF PHARMACY
IN
PHARMACEUTICAL ANALYSIS
THE TAMILNADU Dr. M. G. R. MEDICAL UNIVERSITY
CHENNAI
DEPARTMENT OF PHARMACEUTICAL ANALYSIS
K. M. COLLEGE OF PHARMACY
UTHANGUDI, MADURAI – 625107
This is to certify that the all project entitled “DEVELOPMENT AND VALIDATION OF RP-HPLC METHOD FOR THE ESTIMATION OF ERLOTINIBIN ITS PHARMACEUTICAL DOSAGE FORM” submitted by
D.JYOTHI (Reg. No.261017201) in part fulfilment of the degree of Master of Pharmacy in Pharmaceutical Analysis K.M.COLLEGE OF PHARMACY,
MADURAI-625107 under To The Tamilnadu Dr. M.G.R. Medical University,
Chennai, carried out in NATCO PHARMAPVT. LTD, HYD, is a bonafide work carried out by her under my guidance and supervision during the
academic year 2011– 2012.This dissertation partially or fully has not been submitted for any other degree or diploma of this University or any other Universities.
GUIDE
Mr. M.S Prakash, M. Pharm,
Professor,
Dept. of Pharmaceutical Analysis,
K.M College of Pharmacy,
Uthangudi, Madurai -625107.
HEAD OF THE DEPARTMENT Dr. S. Meena, M. Pharm, Ph.D.,
Professor and Head,
Dept. of Pharmaceutical Analysis,
K.M College of Pharmacy,
Uthangudi, Madurai -625107.
PRINCIPAL
Dr. S. Jayaprakash, M. Pharm, Ph.D.,
Professor and Head,
Dept. of Pharmaceutics,
K.M College of Pharmacy,
Milestones in life are achieved, not by individual efforts but by blessings and
guidance of elders, near and dear ones. This project is the product of collective
wisdom and experience of all those who have shared their views far beyond those
found within the covers of book. I therefore take this opportunity to express my
acknowledgements to all of them.
Let me first thank almighty for giving me life and my parents for educating me
and keeping my requirements in priority at all situations. Without their unconditional
support and encouragement it would have been impossible to pursue my interest.
It gives me immense pleasure to express my deepest thanks, heartfelt,
indebtness and regards to my respected guide, Prof. M.S.Prakash, M.Pharm., ,Dept.
of Pharmaceutical Analysis, K.M. College of Pharmacy, Madurai, for providing much
of the stimuli in the form of suggestions, guidance and encouragements at all stages
of my work.
I owe my great debt of gratitude and heartful thanks to Prof.M.Nagarajan,
M.Pharm., M.B.A, DMS (IM) DMS (BM), Correspondent, K.M. College of Pharmacy, Madurai for providing me all the facilities and support for the successful
completion of my thesis work.
I express my whole hearted gratitude to Dr.S.Jayaprakash, M.Pharm., Ph.D.,
Principal and HOD, Dept. of pharmaceutics for their invaluable advice, suggestion
and encouragement extended throughout the work.
I express my deep sense of gratitude and profound thankfulness to
extended throughout the work.
My sincere thanks goes to Dr.M.Sundarapandian, M.Pharm., Ph.D.,
Assistant Prof. Dept. of Pharmaceutical Analysis, and Mr.M.Boopathi, M.Pharmacy,
Ph.D., Assistant Prof., Dept. of Pharmaceutical Analysis K. M. College of Pharmacy, Madurai, for their valuable help and support for my work.
I gratefully acknowledge Mr.SadasivaRao for referring me to the industrial
project and training at NATCO Pharma Pvt. Ltd. Hyderabad, which was the most
valuable opportunity in my career starting in Pharma field.
I take this golden opportunity to express my humble gratitude and respect to
Dr.B.R.Reddy, Director, Dr.J.Sreekanth General Manager, NATCO Pharma Pvt. Ltd. for giving me the opportunity to work for my project in NATCO Pharma Pvt. Ltd.
Hyderabad.
I express my deep sense of gratitude to my industrial guide Mr.V.Kalyan
Chakravarthy Manager and Mr.Anantha Rao Head of AR&D, NATCO Pharma Pvt. Ltd. HYD.
Thank u is a very small word to express my gratitude to Mr.Mahaboob Basha
who has been a constant guide to me thought this work and taught me the nuances of
experimentation and the interpretation of results which has shaped up my dissertation
in to its present form.
I extend my heartfelt thanks to Prof. K.V.Ramseshu, M.Sc., Dept. of
Biochemistry, K.M. College of Pharmacy, Madurai, for the invaluable advice,
work with Mr.Chaitanya, Mr.Yaswanth, Mr.Kishore, Mr.Nani, Mr.LakshmanDas,
Mr.Arun, Mr.Bhagavan, Mr.Valli, Mr.Siva, Mr.ShanthaKumar and Miss.Prathusa in Natco Pharma Pvt. Ltd. HYD for their constant invaluable guidance,
encouragement and moral support throughout the project work.
I take this golden opportunity to express my heartful gratitude and respect to
my mother Mrs.D.Bharathi Devi and my Brothers Mr.Sarath Babu and Mr.Kamesh
for giving me moral support and encouragement that crows all effort with success.
I owe my thanks to my friends and my family members for their help during
my work.
Extend my thanks to M. Shanthi, B.A, M.Li.Sc, Librarian, and Mrs.Angelo
Merina, Mrs.S.Kalpana Devi, Lab Assistant and Mrs.J.Sridevi and all other non teaching staff members of our college for their co-operation.
It is indeed a difficult task to acknowledge the services of all those gentle
people who have extended their valuable suggestions and support directly or
indirectly whose names have been unable to mention as they are like the countless
Stars in the Galaxy.
D.JYOTHI
% : Percentage
nm : Nanometer
v/v : Volume by volume
Min : Minute
mg : Milligram
µg : Microgram
ng : Nanogram
LC : Liquid chromatography
HPLC : High-performance liquid chromatography GC : Gas chromatography
UV : Ultraviolet
HPTLC : High-performance thin layer chromatography TLC : Thin layer chromatography
LC-MS : Liquid chromatography-Mass spectroscopy
mm : Millimeter
RSD : Relative standard deviation µ mol : Micromole
RP-HPLC : Reversed-phase high-performance liquid chromatography RI : Refractive index
USP : United States Pharmacopoeia
HETP : Height equivalent to theoretical plate LOD : Limit of detection
LOQ : Limit of quantification CV : Coefficient of variance S/N : Signal to noise ratio PDA : Photo diode array detector
INTRODUCTION
GENERAL INTRODUCTION:
Analytical chemistry is a branch of chemistry that determines the nature and identity of a substance and its composition. In the early twentieth century there were only four accepted branches of chemistry, organic chemistry, inorganic chemistry, physical chemistry, biochemistry. At that time, analysis was considered to be a service to the other four branches. Its importance grew and in the process, absorbed techniques and skills from all other four branches. So by the 1950’s, analytical chemistry was finally accepted as a branch of chemistry in its own right. There are basically two types of analysis, qualitative analysis and quantitative analysis. The former identifies the nature of substance and if it is mixture, the nature of the components present, where as the latter determines the elemental composition of the substance and/ or the quantitative distribution of each component.
Pharmaceutical analysis deals with the analysis of a pharmaceutical(s) substance. It is generally known that pharmaceutical is a chemical entity of therapeutic interest. A more appropriate term for pharmaceutical is active pharmaceutical ingredient (API) or active ingredient.
Pharmaceutical analysts in research and development(R&D) of Pharma industry plays a very comprehensive role in new drug development and follow up activities to assure that, a new drug product meets the established standards, its stability and continued to meet the purported quality throughout its shelf-life.
The different activity of R&D includes drug development (synthesis and manufacture) formulation, clinical trials, evaluation and finally launching i.e. finished products. Closely associated with these processes are regulatory and quality assurance functions.
Quality Assurance and Quality Control plays a central role in determining the safety and efficacy of medicines. A highly specific and sensitive analytical technique holds the key to design, development, standardization and quality control of medicinal products.1,2
Modern pharmaceutical analysis entails much more than the analysis of active pharmaceutical ingredients or the formulated product. There are physicochemical properties of pharmaceutical compounds through the use of advanced instrumental methods. There is a need for quality assurance of pharmaceutical products throughout their shelf life. This requires that interactions of the drug substances with the excipients in the presence of residual solvents, as well as other potential degradation reactions that may occur in the formulated product.
The pharmaceutical industry is under increased scrutiny from the government and public interest groups to contain costs and yet consistently deliver to market safe, efficacious products that fulfill unmet medical needs. The industry has streamlined its operations with respect to drug discovery, development and manufacturing.
Traditionally viewed as a service organization, the analytical department has become a significant partner in the drug development process. Analytical data has become a critical path activity for the selection of candidate molecules for full development. Working under sample-limited conditions and in full compliances of current good manufacturing practice (cGMP), Pharmaceutical analysts are called on to generate accurate and precise data – almost on demand.
Novel delivery systems pose special analytical challenges. The commonly used tests of pharmaceutical analysis generally entail compendial testing; these methods, method development, setting specifications, and method validation. The drug product remains with in specifications established to ensure its identity, strength, quality and purity. It is necessary to conduct stability studies to predict, evaluate and ensure drug product safety1.
MODERN PHARMACEUTICAL ANALYSIS: The activities that are highlighted are
• Discovery of NCE and high- throughput screening. • Solid-state analysis of drug substances.
• Degradation and impurity analysis of drug substances. • Preformulation analysis.
• Analysis of solid oral dosage forms. • Analysis of injectable dosage forms. • Compendial testing.
• Method development. • Setting specifications. • Method validation. • Stability studies.
• Analytical methodology transfer. • Documentation and inspections. • Innovative analytical platforms.
THE ANALYTICAL LITERATURE:
Selection of optimum conditions, possible interferences, sensitivity and selectivity, accuracy and precision are all factors pertinent to the performance of an assay that should be known to the analyst before experimental operations are begun. Vast amounts of information are available in the literature, and the skilled analyst will learn to find it and profit by it3.
The discipline involves qualitative analysis and quantitative analysis. QUALITATIVE ANALYSIS: deals with identification of the substance4.
QUANTITATIVE ANALYSIS: deals with the determination of how much of the constituent are present4.
The applied science of analytical chemistry is instrumental analysis, which involves the study of theoretical principle of various instrumental methods.
They are equally important in pharmacokinetics and drug metabolism studies both of which are fundamental to the assessment of bioavailability and the duration of clinical response.
The pharmaceutical analysts play a major role in assuring the identity, safety, efficacy and quality of drug product. Safety and efficacy studies require that drug substance and drug product meet two critical requirement.
¾ Established identity and purity
¾ Established bioavailability and dissolution
Until 1920 all the methods were based upon volume and mass like volumetric and gravimetric methods have come to be known as classical or chemical method of analysis.
After that there is a drastic change in the field of pharmaceutical analysis due to the introduction of highly sensitive instrumental methods. In instrumental methods a physical property of a substance is measured to determine its chemical composition. These methods may be used by the analytical chemist to save time with increased accuracy in the method. The following are the important instrumental techniques used5,6,7.
A. Electroanalytical Methods: These methods involve the measurement of current, voltage or resistance in relation to the concentration of a certain species in solution. Techniques are :
(i) Coulomety (ii) Voltametry (iii) Potentiometry (iv) Conductimetry
B. Spectroscopic Methods:Spectroscopic methods of analysis depend on:
Measurement of the amount of radiant energy of a particular wavelength absorbed or emitted by the sample.
(i) Absorption Methods
• Atomic absorption spectroscopy (AAS) (ii)Emission Methods
(iii) Magnetic Resonance Spectroscopy
• Electron spin resonance (ESR) spectroscopy (iv) Photoelectron Spectroscopy (PES)
(v)Scattering Methods
C. Chromatographic and Electrophoretic Methods: These are essentially separative processes for mixtures of substances but equipped with modern detector systems, they are also adapted to identify components of mixtures.
CHROMATOGRAPHY
Russian botanist Michael Tswett invented chromatography as a separation technique. He described in detail the separation of pigments, the colored substances by percolation through the column, followed by development with pure solvents. The first paper of Tswett, was published in 1903, contains a study of more than 100 absorbents used in conjunction with several different solvents.
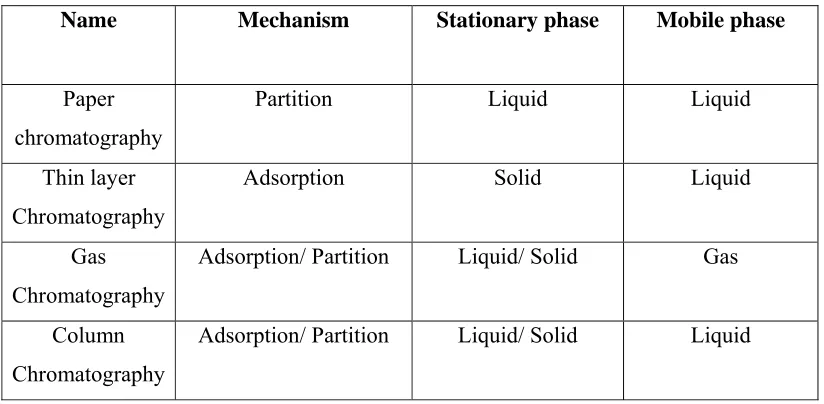
Types of Chromatography
Chromatography characterized as a separation method based on the differential migration of solute through a system of two phases, one is mobile phase another one is stationary phase. Chromatography is a technique by which the components in a sample, carried by the liquid or gaseous phase, are resolved by sorption, desorption steps on the stationary phase.
Chromatography is mainly divided into two categories:
1. Adsorption Chromatography8:
Separation is mainly due to the interaction between solute and surface on the adsorbent. In this, stationary phase is solid and mobile phase is liquid.
e.g: TLC and HPTLC
2. Partition Chromatography:
Separation is based on the partition between two phases. In this mode, both stationary phase and mobile phase are liquids
TABLE-1
DIFFERENT CHROMOTOGRAPHIC METHODS
A) High performance liquid chromatography (HPLC)
It is analytical chromatographic technique that is useful for separation of ions or molecules that are dissolved in a solvent.
TYPES OF HPLC:
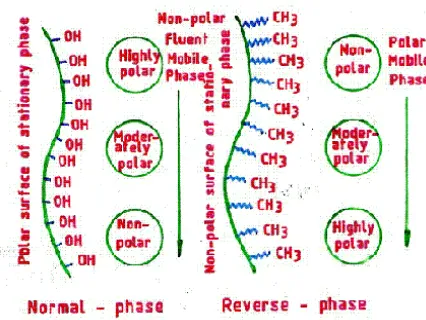
a) Normal phase chromatography9
Normal phase chromatography is chromatographic technique that uses organic solvents for mobile phase and a polar stationary phase. Here, the less polar compound elutes faster than the more polar compound.
b) Reverse phase chromatography
Reverse phase chromatography - a bonded phase chromatography technique, uses water as base solvent. Separation is based on solvent strength and selectivity. Separation is also affected by column temperature and pH. In general, the more polar compounds elute faster than the less polar compounds. UV detection is the most common detection technique used.
Name Mechanism Stationary phase Mobile phase
Paper chromatography
Partition Liquid Liquid
Thin layer Chromatography
Adsorption Solid Liquid
Gas Chromatography
Adsorption/ Partition Liquid/ Solid Gas
Column Chromatography
[image:12.612.118.530.142.344.2]
MECHANISM:
The separation mechanism in reverse phase chromatography depends on the hydrophobic binding interaction between the solute molecule in the mobile phase and the immobilized hydrophobic ligand, i.e. the stationary phase. Reverse phase chromatography is an adsorptive process by experimental design, which relies on a partitioning mechanism to effect separation. The solute molecules partition (i.e. an equilibrium is established) between the mobile phase and the stationary phase.
Stationary phase:
The most popular column is a octadecyl carbon chain (C18) bonded silica. This is followed by C8 bonded silica, pure silica, cyano bonded silica and phenyl bonded silica. C18, C8 and phenyl are dedicated reversed phase packing while cyano columns can be used in a reverse phase mode depending on analyte and mobile phase conditions.
Mobile phase:
[image:13.612.214.427.523.683.2]Mixture of water or aqueous buffers and organic solvents are used to elute analytes from a reversed phase column. The solvent have to be miscible with water and the most common organic solvents used are acetonitrile, methanol or tetrahydrofuran (THF). Other solvents can be used such as ethanol, 2-propanol (isopropyl alcohol). Elution can be performed isocratic (the water-solvent composition does not change during the separation process) or by using a gradient (the water-solvent composition does change during the separation process). The pH of the mobile phase can have an important role on the retention of an analyte and can change the selectivity of certain analytes.
Certain limitations of RP-HPLC are:
• Compounds much more polar than the compound of interest may be masked (eluted together) in the solvent front / void volume.
• Compounds very less polar than the analyte may elute either late during the chromatographic run or are retained in the column.
• The compounds with lower UV extinction coefficients or different wavelengths maxima may not be detectable at the low level.
Reverse phase chromatography is widely in use due to the following advantages10 • Many compounds such as biologically active substance, have limited
solubility in non-polar solvent that are employed in normal phase chromatography.
• Ionic or high polar compounds have high heats of adsorption on straight silica or alumina columns and therefore can elute as a tailing peaks.
• Column deactivation from polar modifiers is a problem in liquid – solid chromatography.
B) Size exclusion chromatography
It is also known as gel permeation or filtration chromatography. Here, separation is based on the molecular size or hydrodynamic volume of the components.
C) Ion Exchange Chromatography
The stationary phase is an ion exchange resin, and separations are governed by the strength of the interactions between solute ions and the exchange sites on the resin.
D
) Ion pair /Affinity chromatography
Separation is based on chemical interaction, specific to the target species. The more popular reverse phase mode uses a buffer and an added counter ion of opposite charge to the sample with separation being influenced by pH, ion strength, temperature, concentration and organic modifier.
E) Chiral Chromatography
COMPA PRO Polarity Polarity o Sample Retention ARISION OF OPERTIES
y of stationar phase
of mobile ph
e elution orde
[image:15.612.130.541.123.703.2]will increas
Fig. 2 Sch
F NORMAL
NO
ry
hase
er
se by Incre s De Inc s hematic diag TABLE-2 L PHASE A
ORMAL PH
High
Low to med
Non polar f
easing surfac stationary ph creasing pol mobile pha creasing pola sample mole
gram of an a
AND REVE
HASE
dium
first
ce area of hase, larity of ase arity of cules apparatus f ERSE PHAS REVERS L Low t Most p Increasing stationa Increasing mobile Decreasing sample m for HPLC. SE HPLC SE PHASE ow to high olar first
g surface of ary phase g polarity of
e phase g polarity of molecules
INSTRUMENTATION
The essential parts of apparatus for the High Performance Liquid Chromatography are:
1) Solvent reservior 2) Mobile phase 3) Pump system
4) Sample Injection System 5) Column
6) Detector
1. Solvent reservoir
A modern HPLC apparatus is equipped with one or more glass or stainless steel reservoirs. The reservoir is often equipped with an online degasser which removes the dissolved gasses usually oxygen and nitrogen, which interfere by forming bubbles. Degasser may consist of vacuum pumping system, distillation system, system devices for heating, and solvent stirrer.
2. Mobile phase
One of the greatest advantages of HPLC is versatility afforded by liquid mobile phase. Sufficient solubility of solute molecules in the mobile phase must be ensured in order to prevent precipitation.
3. Pumping system11
The function of the pump in HPLC is to pass mobile phase through the column at a controlled flow rate. Features of an ideal pumping system include:
• Generating pressure upto 6000 psi. • Pulse free output.
• Flow rates ranging from 0.1 to 10 ml/min.
• Flow control and reproducibility of 0.5% relative or better. • Corrosion resistant components.
There are three types of pumps commonly used
Reciprocating pumps
Displacement pumps
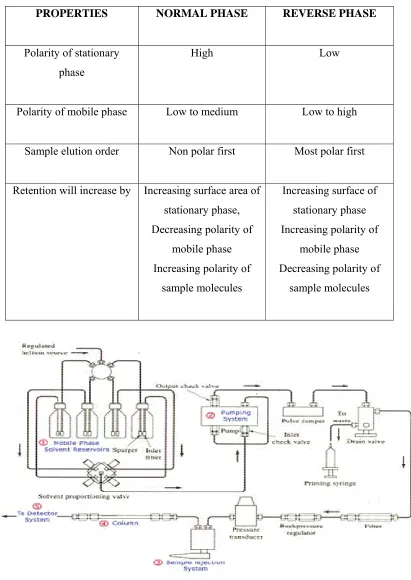
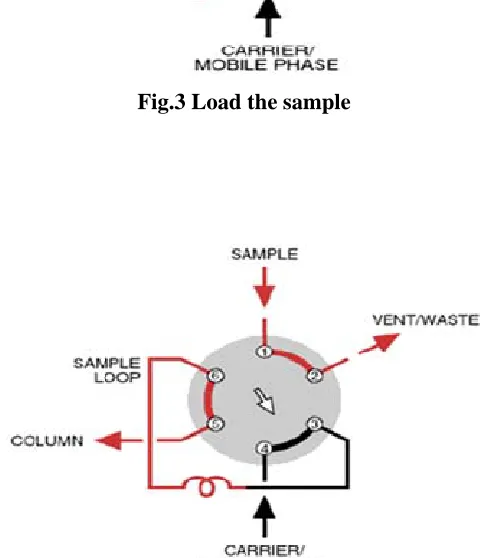
Pneumatic pumps 4. Sample injection system
The limiting factor in the precision of LC measurements lie in reproducibility with which samples are introduced into the column packing. The earliest and simple means of sample introduction was syringe injection through a self-sealing elastomeric septum. In stop flow injections, the flow of solvent is stopped momentarily, and fitting at column head is removed and the sample is injected directly into the head of column packing. After replacing the fitting the system is again pressurized.
Commercial chromatographs use valves for sample injection. With these devices, sample is first transferred at atmospheric pressure from a syringe into a sample loop. Turning the valve from load to inject position connects the sample loop into the high-pressure mobile phase stream, whereby the contents of the sample loop are transferred on to the column.
Fig.3 Load the sample
Fig.4 Inject the sample
5. Columns11
The columns most commonly used are made with 316-grade stainless steel (a Cr-Ni-Mo steel, relatively inert to chemical corrosion). The inside of the stainless steel tube should be as smooth as possible, so the tubes are precision drilled or electro-polished after manufacture. Common dimensions are 6.35 mm external diameter, 4.6 mm internal diameter and up to 25 cm long. The columns can be packed with 10, 5, 4 or 3 µm diameter particles.
[image:18.612.201.449.199.478.2]
packing. At the lower end there is another frit to retain the packing and then, for the 4.6 mm type, a reducing union and a short length of 0.25 mm (0.01 in.) i.d. tubing to connect the column to the detector. Materials other than stainless steel that are used for columns include glass, glass lined steel tube and polyethene or other inert plastics.
[image:19.612.171.479.308.434.2]Most chromatography suppliers now offer a range of plastic fittings that can be tightened to be leak free, by hand. These are commonly made of Kel-F (PCFE) or Peek (a polyketone). Peek has excellent chemical resistance to most organic and inorganic liquids (except H2SO4, HNO3 and tetrahydrofuran) and the tubing can be used at pressures up to 6000 psi for the smaller diameters.
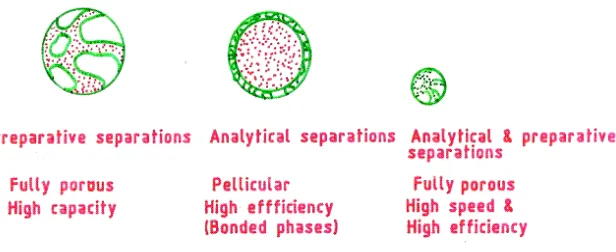
Fig.5 Properties of particles in various types of columns
5.1 Analytical columns
The majority of LC columns range in length from 5 to 30 cm. The inner diameter of columns is often 4 to 5 mm. Most common particle size of packing is 5 to 10 µm. Columns of this type contain 40000 - 60000 plates per meter.
5.2 Preparative columns
5.3 Guard columns
[image:20.612.150.525.214.471.2]Usually, a short guard column is introduced before the analytical column to increase its life. It removes particulate matter, contaminants from the solvents and also sample components that bind irreversibly to stationary phase. The composition of the guard column packing should be closely similar to that of analytical column.
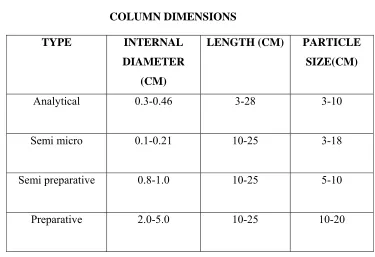
Table-3
COLUMN DIMENSIONS TYPE INTERNAL
DIAMETER (CM)
LENGTH (CM) PARTICLE SIZE(CM)
Analytical 0.3-0.46 3-28 3-10
Semi micro 0.1-0.21 10-25 3-18
Semi preparative 0.8-1.0 10-25 5-10
Preparative 2.0-5.0 10-25 10-20
6. DETECTORS12
The function of the detector in HPLC is to monitor the mobile phase emerging from the column. The output of the detector is an electrical signal that is proportional to some property of the mobile phase and/or the solutes.
LC detectors are basically of two types.
Most common HPLC detectors
• UV-Visible absorbance detector (UV-VIS) • Photo-diode array detector (PDA)
• Fluorescence detector • Electrochemical (ECD) • Refractive Index (RI) • Mass detectors (MS) • Conductometric detector
• Chiral detector (Polarimetric & circular dichrosim) • Evaporative Light scattering detector (ELSD) • Radiochemical detector
QUANTIFICATION
Quantitative analysis using chromatography is based on calibration curves obtained from each of the substances analyzed. Calibration is needed in all those cases in which a signal related to mass or concentration of a component in mixture, is obtained. Chromatographic test methods use either external or internal standards for quantification.
1. External standard method
An external standard method is used when the standard is analyzed on a separated chromatogram from the sample. Quantification is based on a comparison of the peak area / height (HPLC or GC) or spot intensity (TLC) of the sample to that of a reference standard of the analyte of interest.
The external standard method is more appropriate for samples as follows:
• Samples with a single target concentration and narrow concentration range, e.g., acceptance and release tests. Simple sample preparation procedure.
• Increased baseline time for detection of potential extraneous peaks, e.g., impurities test.
2. Internal standard method
response ratio of a similar preparation of the reference standard (HPLC or GC). This technique is rarely used for TLC methods.
The internal standard method is more appropriate for samples as follows:
1. Complex sample preparation procedures, e.g., multiple extractions.
2. Low concentration sample (sensitivity being an issue), e.g., pharmacokinetic studies.
3. Wide range of concentrations expected in the sample for analysis, e.g., pharmacokinetic studies.
Selection of Internal Standard
A compound added to a sample in known concentration to facilitate the qualitative identification or quantitative determination of the sample components. Internal standards (IS) - substance used as reference in quantitative analysis, the internal standard is first mixed with standard solutions, later it is added to the unknown, and the ratio of peak heights (or areas) of internal standard and analyte is used for quantitative analysis.
3. Standard addition method
VALIDATION
GUIDELINES FOR ANALYTICAL METHOD VALIDATION
Validation13
Validation of an analytical method is the process by which it is established, by laboratory studies, that the performance characteristics of the method meet the requirements for the intended analytical applications
Validation is defined as follows by different agencies
Food and Drug administration (FDA)
Establishing documentation evidence, which provides a high degree of assurance that specific process, will consistently produce a product meeting its predetermined specification and quality attributes.
World Health Organization (WHO)
Action of providing that any procedure, process, equipment, material, activity, or system actually leads to the expected results
European Committee
Action of providing in accordance with the principles of good manufacturing practice that any procedure, process, equipment, material, activity or system actually leads to the expected results. In brief validation is a key process for effective quality assurance.
Reasons for Validation
There are two important reasons for validating assays in the pharmaceutical industry. The first, and by for the most important, is that assay validation is an integral part of the quality-control system. The second is that current good manufacturing practice regulation requires assay validation.
Steps followed for validation procedures
1. Proposed protocols or parameters for validations are established. 2. Experimental studies are conducted.
3. Analytical results are evaluated. 4. Statistical evaluation is carried out.
Objective and Parameters of Analytical Method Validation
The primary objective of validation is to form a basis for written procedure for production and process control which are designed to assure that the products have the identity, strength, quality and purity they purport or are represented to possess quality, safety and efficacy must be designed to build into the product. Each step of the manufacturing process must be controlled to maximize the probability that the finished products meet all quality and design specification.
ANALYTICAL METHOD DEVELOPMENT
Methods are developed for new products when no official methods are available. Alternate methods for existing (non-Pharmacopoeia) products are developed to reduce the cost and time for better precision and ruggedness. Trial runs are conducted, method is optimized and validated. When alternate method proposed is intended to replace the existing procedure, comparative laboratory data including merit and demerits are made available15.
Steps of method development16,17
Documentation starts at the very beginning of the development process, a system for full documentation of the development studies must be established. All data relating to these studies must be recorded in laboratory notebook or an electronic database.
1. Analyte standard characterization
a. All known information about the analyte and its structure is collected i.e., physical and chemical properties.
b. The standard analyte (≈100% purity) is obtained. Necessary arrangement is made for its proper storage (refrigerator, desicators and freezer).
c. When multiple components are to be analyzed in the sample matrix, the number of components is noted, data is assembled and the availability of standards for each one is made.
2. Method requirement
The goals or requirements of the analytical method that need to be developed are considered and the analytical figures of merit are defined. The required detection limits, selectivity, linearity, range, accuracy and precision are defined.
3. Literature search and prior methodology
The literature for all types of information related to the analyte is surveyed. Such as synthesis, physical and chemical properties, solubility and relevant analytical methods. Books, periodicals, chemical manufacturers and regulatory agency compendia such as USP / NF, AOAC and ASTM publications are reviewed. Chemical Abstracts Service (CAS) automated computerized literature searches are convenient. 4. Choosing a method
a) Using the information in the literatures and prints, methodology is adapted. The methods are modified wherever necessary. Sometimes it is necessary to acquire additional instrumentation to reproduce, modify, improve or validate existing methods for in-house analytes and samples.
b) If there are no prior methods for the analyte in the literature, from analogy, the compounds that are similar in structure and chemical properties are investigated and are worked out. There is usually one compound for which analytical method already exist that is similar to the analyte of interest.
5. Instrumental setup and initial studies
The required instrumentation is setup. Installation, operational and performance qualification of instrumentation using laboratory Standard Operating Procedures (SOP’s) are verified. Always new consumables (e.g. chemicals, solvents and gases) are used.
The analyte standard in a suitable injection / introduction solution and in known concentrations and solvents are prepared. It is important to start with an authentic, known standard rather than with a complex sample matrix. If the sample is extremely close to the standard (e.g., bulk drug), then it is possible to start work with the actual sample.
6. Optimization
organized methodical plan and every step is documented (in a lab notebook) in case of dead ends.
7. Documentation of analytical figures of merit
The originally determined analytical figures of merit limit of quantitation (LOQ), Limit of detection (LOD), linearity, time per analysis, cost, sample preparation etc., are documented.
8. Evaluation of method development with actual samples
The sample solution should lead to unequivocal, absolute identification of the analyte peak of interest apart from all other matrix components.
9. Determination of percent recovery of actual sample and demonstration of quantitative sample analysis
Percent recovery of spiked, authentic standard analyte into a sample matrix that is shown to contain no analyte is determined. Reproducibility of recovery (average +/- standard deviation) from sample to sample and whether recovery has been optimized has been shown. It is not necessary to obtain 100% recovery as long as the results are reproducible and known with a high degree of certainty.
The validity of analytical method can be verified only by laboratory studies. Therefore documentation of the successful completion of such studies is a basic requirement for determining whether a method is suitable for its intended application.
METHOD VALIDATION14
This process consists of establishments of the performance characteristics and the limitation of the method.
METHOD PERFORMANCE PARAMETERS ARE DETERMINED USING EQUIPMENT THAT IS:
1. Within specification 2.Working correctly 3. Adequately calibrated
METHOD VALIDATION IS REQUIRED WHEN: 1. A new method is being developed
2. Revision of the established method
4. Comparision of method
5. When quality control indicates method changes
PERFORMANCE CHARACTERISTICS EXAMINED WHEN CARRYING OUT METHOD VALIDATION ARE18:
1. Accuracy 2. Precision 3. Specificity 4. Selectivity 5. Sensitivity
6. Limit of detection. 7. Limit of quantification 8. Linearity and Range 9. Ruggedness
10. Robustness 11.System suitability
1. Accuracy
The accuracy is the closeness of the measured value to the true value for the sample.
The ICH documents recommended that accuracy should be assessed using a minimum of nine determinations over a minimum of three concentrations levels the specified range (i.e, three concentrations and three replicates of each concentration).
Accuracy was tested (% Recovery and % RSD of individual measurements) by analyzing samples at least in triplicate, at each level (80,100 and 120 % of label claim) is recommended. For each determination fresh samples were prepared and assay value is calculated. Recovery was calculated from regression equation obtained in linearity study. Accuracy was determined from the mean relative error for a set of replicate analysis (i.e. the difference between measured and nominal concentration) for spiked samples.
2. Precision
Precision of an analytical method is usually expressed as the standard deviation, relative standard deviation or coefficient of variations of a series of measurements. The ICH documents recommend the repeatability should be assessed using a minimum of nine determinations covering specified range of procedure. Precision may be measure of either the degree of reproducibility or of repeatability of the analytical method under normal operating conditions.
Repeatability:
Repeatability expresses the precision under the same operating conditions over a short interval of time. Repeatability is also termed intra –assay precision.
Intermediate Precision:
Intermediate precision expresses with in laboratories variations: different days, different analyst and different equipment.
Reproducibility:
When the procedure is carried out by different analyst in different laboratories using different equipment, regents and laboratories setting. Reproducibility was determined by measuring repeatability and intermediate precision. Reproducibility is assessed by means of an inter-laboratory trial.
3. Specificity
An investigation of specificity should be conducted during the validation of identification tests, the determination of impurities. An ICH document defines specificity as the ability to assess unequivocally the analyte in the presence compounds that may be expected to products and matrix components.
The definition has the following implications: Identification test:
Suitable identification tests should be able to discriminate compounds of closely related structure which are likely to be present .Ensure identity of an analyte, the analyte should have no interference from other extraneous components and be well resolved from them.
Purity Test:
Assay:
To provide an exact result, this allows an accurate statement on the content or potency of the analyte in a sample.
4. Selectivity:
It is a procedure to detect qualitatively the analyte in the presence of compounds that may be expected to be present in the sample matrix or the ability of a separative method to resolve different compounds. It is the measure of the relative method location or two peaks.
Determination of selectivity:
Selectivity is determined be comparing the test results obtained on the analyte with or without addition of potentially interfering material. When such components are either unidentified or unavailable a measure of selectivity can be obtained by determining the recovery of a standard addition of pure analyte to a material containing a constant level of the other compounds.
5. Sentivity:
Sensitivity is the capacity of the test procedure to record small variation in concentration. It is the slope of the calibration curve.
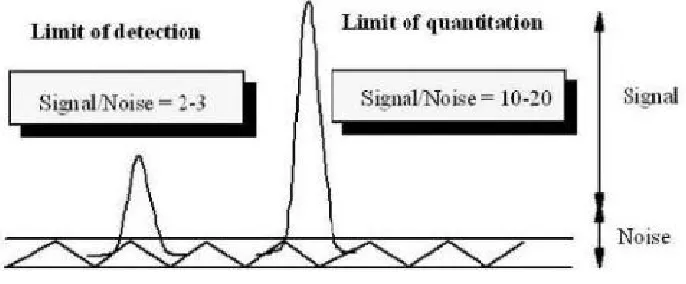
6. Limit of detection (LOD):
It is the lowest amount of analyte in a sample that can be detected, but not necessarily quantities as an exact value, under the stated experimental conditions. The detection limit is usually expressed as the concentration of analyte (percentage parts per million) in the sample.
Determination of detection limit
For instrumental and non- instrumental methods detection limit is generally determined by the analysis of samples with known concentration of analyte and by establishing the minimum level at which the analyte can be reliably detected.
LOD = 3 x SD / slope of calibration curve SD = Standard deviation of intercepts
7. Limit of quantification (LOQ):
Determination of quantification limit
For instrumental and non- instrumental methods, the quantitation limit is generally determined by the analysis of samples with known concentration of analyte and by establishing the minimum level at which the analyte can be determined with acceptable accuracy and precision.
[image:30.612.157.500.238.380.2]LOQ = 10 x SD / slope of calibration curve SD = Standard deviation of intercepts
Fig. 6 Limit of detection and Limit of quantification via signal to noise
8. Linearity and Range
The linearity of an analytical procedure is its ability to obtain test results that are directly proportional to concentration of analyte in samples. The range of an analytical is the intervals between the upper and lower concentration of analyte in the sample for which it has been demonstrated that the analytical procedure has a suitable level of precision accuracy and linearity.
Determination of linearity and range:
9. Ruggedness
Degree of reproducibility of test results obtained by the analysis of the same samples under a variety of condition such as different laboratories, different analysts, different instruments etc., normally expressed as the lack of influence on test results of operational and environmental variable of the analytical method.
Ruggedness is a measurement of reproducibility of test results under the variation in condition normally expected from laboratory to laboratory and from analyst to analyst. Degree of representative of test results is then determined as a function of the assay variable.
By analysis of aliquots from homogenous lots in different laboratories, by different analyst, using operational and environmental conditions that may differs but is still with in the specified parameter of the assay variable.
10. Robustness
Robustness of an analytical method is measure of its capacity to remain unaffected small but deliberate variations in method parameters and provides an indication of its reliability during normal usage.
Testing varying some or all condition: • Column temperature
• pH of buffer in mobile phase • Flow rate
• Wave length 11. System Suitability19
System suitability tests are based on the concept that the equipment, electronics, analytical operations and samples constitute an integral system that can be evaluated as a whole.
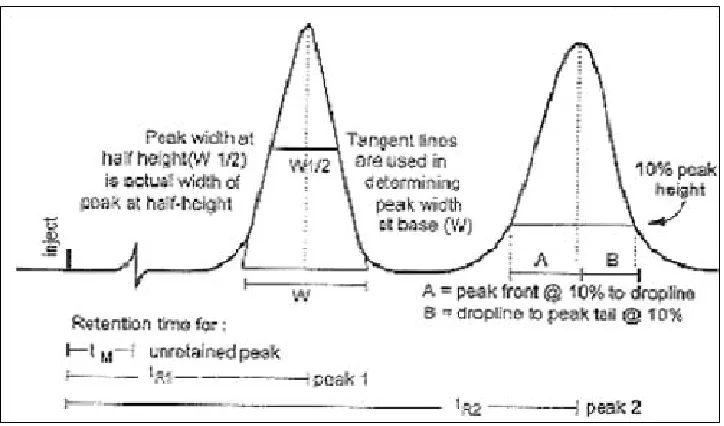
[image:32.612.162.524.108.321.2]
SYSTEM SUITABILITY SPECIFICATIONS:
Fig.7 Typical chromatogram with examples of retention measurements
Wx = Width of the peak determined at either 5% or 10% above baseline f = Distance between peak maximum and peak front at Wx
to = Elution time of void volume or non-retained components tr = Retention time of the analyte, R
tw = Peak width measured at baseline of the extrapolated straight sides to baseline.
The parameters that are affected by the changes in chromatographic conditions are, • Capacity factor (k’)
• Peak asymmetry / tailing factor (As) • Column efficiency (N)
a) Capacity factor (k')
The capacity factor, K’ is related to the retention time is a reflection of the proportion time of a particular solute residues in the stationary phase as opposed to the mobile phase. Long retention times results in large valves of K’. The capacity factor K’ can be calculated for every peak defined in a chromatogram, using the following equations.
Moles of solute in stationary phase Capacity factor K’ = --- Moles of solute in mobile phase
K' = (t R- t0) / t 0
The capacity factor is a measure of the degree of retention of an analyte relative to an unretained peak, where tR is the retention time for the sample peak and to is the retention time for an unretained peak.
Recommendations
The peak should be well-resolved from other peaks and the void volume. Generally the value of k' is > 2.
Precision / Injection repeatability (RSD) of < 1% for ‘n’ > 5 is desirable.
b) Tailing factor (T)
A measure of the symmetry of a peak, given by the following equation where W0.05 is the peak width at 5% height and f is the distance from peak front to apex point at 5% height. Ideally, peaks should be Gaussian in shape or totally symmetrical.
T = W0.05 / 2f
Recommendations
T of </= 2 is preferred
c) Theoretical plate number / Efficiency (N)
A measure of peak band spreading determined by various methods, some of which are sensitive to peak asymmetry. The most common are shown here, with the ones most sensitive to peak shape shown first:
• 4-sigma / tangential
N = 16 (tR / W)2 = L / H
• Half height
N = 5.54 (tR/ W) 2 = L / H
Theoretical plate number is a measure of column efficiency .Theoretical plate number is a measure of column efficiency, that is, how many peaks can be located per unit run-time of the chromatogram, where tR is the retention time for the sample peak and W is the peak width.
N is fairly constant for each peak on a chromatogram with a fixed set of operating conditions H, or HETP, the height equivalent of a theoretical plate, measures the column efficiency per unit length (L) of the column. Parameters which can affect N or H include peak position, particle size in column, flow-rate of mobile phase, column temperature, viscosity of mobile phase, and molecular weight of the analyte.
Recommendations
The theoretical plate number depends on elution time but in general should be > 2000.
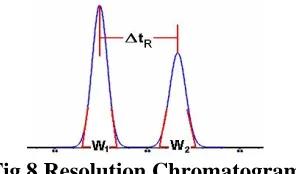
d) Resolution (Rs)
Fig.8 Resolution Chromatogram
RS = (tR2-tR1) / 0.5(w1+w2)
Where tR1 &
t
R2 are the Retention time of the two compounds and w1 & w2 are the width of the two compounds. For reliable quantitation, well-separated peaks are essential for quantitation.Recommendations
Rs of> 2 between the peak of interest and the closest potential interfering peak (impurity, excipient, degradation product, internal standard, etc.) are desirable.
e) Dead Volume
Dead Volume means any empty space or unoccupied volume, the presence of which can lead to disastrous losses in efficiency. There will be dead volume in the column itself, which will be the space that is not occupied by the stationary phase. The other sources of dead volume are the injection unit, the tubing and fittings at each end of the column and the detector cell.
f) Retention time (Rt)
Retention time is the difference in time between the point of injection and appearance of peak maxima. Retention time is the time required for 50% of a component to be eluted from a column. Retention time is measured in minutes of seconds. Retention time is also proportional to the distance moved on a chart paper, which can be measured in cm or mm.
g) Retention volume (Rv)
Retention volume is the mobile required to elute 50% of the component from the column. It is the product of retention time and flow rate.
STATISTICAL PARAMETERS
Statistics consists of a set of methods and rules for organizing and interpreting observations. The precision or reproducibility of the analytical method was determined by repeating the analysis six times and the following statistical parameters were calculated.
Statistical procedures and representative calculations
The consistency and suitability of the developed method are substantiated through the statistical analysis like standard deviation, relative standard deviation and theoretical plates per meter.
Mean :
Best estimation of the population mean mcg/ml for random samples from a population.
Where
X = Mean
x = Individual observed valve n = Number of observation
STANDARD DEVIATION:
Standard deviation, σ= 1
) x x
( i 2
− −
∑
n
Where,
x = sample,
xi = mean value of samples, n = number of samples
Relative Standard Deviation = σ/xi × 100
Sandell, sensitivity (µg/cm2/0.001 absorbance units) = C/A×0.001 Where,
Standard error
It provides a measure of how well a sample mean approximates the population mean. Less value is more accurate
SE = SD/v n
Correlation: (Fit of regression line)
Purpose:Measurement of the relation between two or more variables / measures how close the points are to the regression line.
Correlation co-efficient can range from -1.00 + 1.00 Correlation value denotes with the letter r
n(∑xy) – (∑x) (∑y)
r = ___________________________
√ (n∑x2 – (∑x)2 (n∑y2 – (∑y)2
Regression: Purpose:
1. When the concentration range is so wide that the errors, both random and systematic, are not independent (which is assumption).
2. When pairing is inappropriate for other reason, notably a long time span
between two analysis (sample aging, change in laboratory conditions etc.) Regression line
Y = mx + b Where,
b = intercept of the line with the Y axis m = Slope (tangent)
Slope m
n(∑xy) – (∑x)(∑y) m = --- n(∑(x2)) – (∑x)2
Intercept b
(∑y)( ∑(x2) - (∑x)(∑xy) b = ---
HPLC method validation
Everyday many chromatographers face the need to develop a HPLC separation whereas individual approaches may exhibit considerable diversity; method development often follows the series of steps summarized in the following fig.
Validation method for release to routine laboratory
Fig.9 Steps involved in HPLC method validation 1. Introduction on sample
Define separation goals
2. Need for special HPLC
Procedure, sample, pretreatment, etc
3. Choose detector and Detector settings
4. Choose LC method; Preliminary run; estimate best separation conditions
5. Optimize separation condition
6. Check for problems or requirementsfor special procedure
7c.Qualitative
method 7b.Quantitative
calibration 7a. Recover
METHODS USED FOR THE EXAMINATION OF PHARMACEUTICAL MATERIAL MAY BE BROADLY CLASSIFIED AS FOLLOWS20,21
Class A:
Tests designed to establish identity, whether of bulk drug substances or have a particular ingredient in a finished dosage form.
Class B:
Methods designed to detect and quantitate impurities in a bulk drug substances or finished dosage form.
Class C:
Methods used to determine quantitatively the concentration of bulk drug substance or of a major ingredient in a finished dosage form.
Class D:
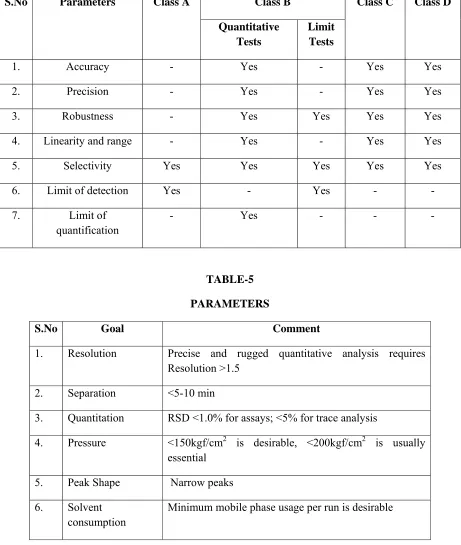
TABLE-4
CHARACTERISTIC THAT SHOULD BE CONSIDERED FOR DIFFERENT TYPES OF ANALYTICAL PROCEDURE
(As per WHO guidelines)
S.No Parameters Class A Class B Class C Class D Quantitative
Tests
Limit Tests
1. Accuracy - Yes - Yes Yes
2. Precision - Yes - Yes Yes
3. Robustness - Yes Yes Yes Yes
4. Linearity and range - Yes - Yes Yes
5. Selectivity Yes Yes Yes Yes Yes
6. Limit of detection Yes - Yes - -
7. Limit of quantification
[image:40.612.93.554.164.709.2]- Yes - - -
TABLE-5 PARAMETERS
S.No Goal Comment
1. Resolution Precise and rugged quantitative analysis requires Resolution >1.5
2. Separation <5-10 min
3. Quantitation RSD <1.0% for assays; <5% for trace analysis
4. Pressure <150kgf/cm2 is desirable, <200kgf/cm2 is usually essential
5. Peak Shape Narrow peaks
6. Solvent consumption
LEARN ABOUT CANCER22 What is cancer?
Cancer is the general name for a group of more than 100 diseases in which cells in a part of the body begin to grow out of control. Although there are many kinds of cancer, they all start because abnormal cells grow out of control. Untreated cancers can cause serious illness and even death.
Normal cells in body
The body is made up of trillions of living cells. Normally body cells grow, divide, and die in an orderly fashion. During the early years of a person’s life, normal cells divide faster to allow the person to grow. After the person becomes an adult, most cells divide only to replace worn-out or dying cells or to repair injuries.
How cancer starts:-
Cancer starts when cells in a part of the body start to grow out of control. Cancer cell growth is different from normal cell growth. Instead of dying, cancer cells continue to grow and form new, abnormal cells. Cancer cells can also invade other tissues, something that normal cells cannot do. Growing out of control and invading other tissues are what makes a cell a cancer cell. Cells become cancer cells because of damage to DNA.
Tumors that are not cancer
Not all tumors are cancerous. Tumors that aren’t cancer are called benign. Benign tumors can cause problems-they can grow very large and press on health organs and tissues. But they cannot grow into (invade) other tissues. Because they can’t invade, they also can’t spread to other parts of the body (metastasize).These tumors are almost never life threatening.
Cancer types
• Adrenal cortical cancer
• Anal cancer
• Bladder cancer
• Breast cancer
• Cervical cancer
• Endometrial cancer
• Eye cancer
• Gallbladder cancer
• Kidney cancer
• Liver cancer
• Lung cancer- non-small cell
• Lung cancer- small cell
Erlotinib23 (er-lot-tin-nib)
Trade/other name: Tarceva, OSI-774 How does this drug work?
Erlotinib is a type of targeted therapy known as a tyrosine kinase inhibitor. Its target is a tyrosine kinase protein called epidermal growth factor receptor (EGFR), which is located on the surface of certain cells in the body. Some cancers have higher than normal number of these receptors on their surfaces. Erlotinib blocks the receptor so that it can’t signal the cell to divide and grow.
Interactions with other drugs
The following drugs can cause Erlotinib to build up in the body, raising the risk of serious side effects:
• The antidepressant nefazodone (serzone), fluvoxamine (luvox)
• HIV drugs such as indinavir, ritonavir, fosamprenavir, nelfinavir, atazanavir, and others
•Anti-seizure drugs carbamazepine (Tegretol). Phenobarbital (luminal) and phenytoin (dilantin).
•TB drug rifampin (Rifadin, Rimactance;also in Rifamate And Rifater), andrifabutin (mycobutin)
•Any H2 blocker such as cimetidine (tagamet), ranitidine (zantac), famotidine (pepcid) or nizatidine (axid).
Interactions with foods
Taking this drug with food can raise the levels of the drug in the body, so it should be taken on an empty stomach.
How is this drug taken or given?
Erlotinib is in pill form, and is taken by mouth, once a day. The dose depends on a number of factors, including the type of cancer being treated.
Possible side effects
Common
• Skin rash on face, neck, and trunk, diarrhea.
• Feeling tired
Less common
• Shortness of breath
• Cough
Rare:
• Eye irritation
DRUG PROFILE
24Name : ERLOTINIB
Structure :
Chemistry:
Chemical Name : N-(3-ethynylphenyl)-6,7-bis(2-methoxyethoxy)4- quinazolinamine hydrochloride.
Molecular Formula : C22H23N3O4.HCl
Molecular Weight : 429.90
Description : white to cream coloured , amorphous powder.
PKa : 5.42 at 25°c
Solubility : Very slightly soluble in water, slightly soluble in
methanol,practically insoluble in acetonitrile,acetone,
ethyl acetate and hexane.
Mechanism of action : Selective epidermalgrowth factor receptor tyrosine
kinase inhibitor.
Contraindication : Monotherapy for the treatment of patients with locally
advanced or metastatic non-small cell lung cancer.
Bulk density : 0.1899 g/ml
PHARMACOKINETICS
Oral absorption : Erlotinib is about 60%absorbed after oral
administration and its bioavailability is substantially
increased by food to almost 100%.
Distribution : Peak plasma levels is 3 to 4 hrs after oral administration
Steady state achieved in 7-8 days.
Crosses blood brain barrier.
Plasma protein binding 93% to albumin and alpha-1
acid glycoprotein (AAG)
Metabolism : Primarily hepatic via CYP3A4,lesser extent by
CYP1A2 and extra hepatic isoform CYP1A1
Excreation : Excreation predominantly via feces(83%),urine
8%. Elemination half life 36.2 hrs.
Adverse effects : Rash/acne,diarrohea.
Dosing : Daily dose of erlotinib is 150mg atleast one hour before
or 2 hrs after ingestion of food. When dose reduction is
necessary, should be reduced in 50mg.
Elderly no dose adjustment is required.
Interaction : CYP3A4 inhibitors (phenytoin, carbamazepine)
Dept of Pharmaceutical Analysis Page 40
LITERATURE REVIEW
Chahbouni A25et.al:developed and validated liquid chromatography (LC)-mass spectrometry (MS)/MS method in human plasma for the tyrosine kinase inhibitors erlotinib, gefitinib, and imatinib in human plasma. Pre-treatment of the samples was achieved by using liquid-liquid extraction and imatinib as internal standard. Separation was performed on a Waters Alliance 2795 LC system using an XBridge RP18 column. The mass spectrometer Micromass was equipped with an electro spray ionization probe, operating in the positive mode. The calibration curves in plasma were linear for erlotinib, gefitinib, and imatinib over the concentration range of 5 to 3,000; 5 to 3,000, and 5 to 5,000 ng/mL, respectively. The intraday and interday accuracy ranged from 90% to 110% and the intraday and interday precision of the method was within 5%.
Dept of Pharmaceutical Analysis Page 41
101.6 ± 3.7%, 12.7 nM; Sunitinib: 100.8 ± 4.3%, 12.6 nM; Sorafenib: 93.9 ± 3.0%, 10.8 nM, respectively. This was reproducible for plasma, whole blood, and serum. The method was observed to be linear between the LOQ and 4000 ng/ml for each analyte.
V.Rajesh27et.al:developed a simple, specific and precise high performance thin layer chromatographic method for estimation of Erlotinib hydrochloride as bulk drug. The chromatographic development was carried out on precoated silica gel 60 F254 aluminium plates using mixture of Methanol: Ammonia (8:0.2 v/v) as mobile phase and densitometric evaluation of band was carried out at 250 nm using Camag TLC Scanner-3 with win CAT 1.4.3 version software. The RF value of drug was found to be 0.52 ± 0.01. The method was validated with respect to linearity, accuracy, precision and robustness. The calibration curve was found to be linear over a range of 200- 1200 ng/ band. The % assay (Mean ± S.D.) was found to be 101.3 ± 1.02. The proposed HPTLC method was found to provide a faster and cost effective quantitative control for routine analysis of Erlotinib hydrochloride as bulk drug.
Dept of Pharmaceutical Analysis Page 42
G.Usha Rani29et.al:developed and validated extractive colorimetric method for estimation of erlotinib in bulk and tablet dosage form. Two simple, rapid sensitive, precise and economic spectrophotometric methods for the estimation of erlotinib. The solution of the drug formed colored ion-pair complexes with Bromocresol Green (BCG) and Methyl Orange (MO) in phosphate buffer pH 2.5, and extracted in chloroform.The complex of etoricoxib with BCG and MO showed λ max at 418.5nm and 424.4nm respectively. The complex was stable up to 22 hrs and obeyed Beer’s law over the concentration ranges of 10-1000 ug/ml. Correlation coefficient was found to be 0.9985.
M.Padmalatha30et.al:developed a spectrophotometric method for the determination of erlotinib in pure and pharmaceutical dosage form. The developed methods were based on reaction of erlotinib with Phenol red, BromoCresolGreen and Erichrome black T. They are quantified spectrophotometrically at their absorption maximum at 418nm (MethodA), 424nm (MethodB) and 333nm (MethodC). Beer’s law was obeyed in the concentration range of 40-80ug/ml, 20-40ug/ml and 10-50ug/ml for the three method respectively. The colors were found to be stable for more than 4 hrs.
Dept of Pharmaceutical Analysis Page 43
G.Vidya Sagar32et.at:developed and validated a simple, accurate and cost efficient spectrophotometric method, for the estimation of erlotinib in tablet dosage form. The optimum conditions for the analysis of the drug were established. The maximum wave length (λmax) was found to be 247 nm. The percentage recovery of erlotinib was in the range of 99.7±0.12.Beer’s law was obeyed in the concentration range of 2-10ug/ml. Calibration curves showed a linear relationship between the absorbance and concentration.
M.Padmalatha33et.al:developed and validated High Performance Liquid Chromatographic Method for the determination of Erlotinib. They used 250x4.6mm, 5µ particle, IntersilODS-3V C18column with 0.03M potassium dihydrogen orthophosphate in water pH 3.2, orthophosphoric acid acetonitrile (55:45),as mobile phase at a flow rate of 0.8 ml/min. PDA detection was performed at 246.0nm.Injection volume was20µl.HPLC grade water, Acetonitrile(50:50v/v)was used as diluents. The method was validated for accuracy, precision, linearity, specificity and sensitivity. Total run time was 20min, erlotinib eluted with retention time of 4.75min.Calibration plots were linear over the concentration range 5-40µg/ml. Intra and inter day relative standard deviation for erlotinib was less than 3.3 and 4.1% respectively.
Dept of Pharmaceutical Analysis Page 44
Lutz Gotze35et.al:development and clinical application of a LC/MS/MS method for simultaneous determination of various tyrosine kinase inhibitors in human plasma. Developed and validated a specific, simple and rapid quantification method for various TKI’s in human plasma. A simultaneous test for six TKI’s (erlotinib, imatinib,lapatinib, nilotinib, sorafenib, sunitinib) was developed using liquid chromatography tandem mass spectrometry in a multiple reaction monitoring mode. After protein precipitation the specimens were applied to the HPLC system and separated using a gradient of acetonitrile containing 1% formic acid with 10mM ammonium formate on an analytic RP C18 column. The calibration range was 10-1000ng/ml for sunitinib and 50-5000ng/ml for the other TKI’s with coefficient of determination ≤15% and the chromatographic run time was 12 min. Plasma specimens were stable for measurement for atleast 1 week at 4°c.
S.S Pujeri36et.al:developed and validated stability – indicating chromatographic method for the assay of erlotinib active pharmaceutical ingredient in the presence of its degradation products on a C18 column using a mobile phase of 0.01M ammoniumformate-acetonitrile-containing formic acid with a flow rate of 1.0ml/min. Selectivity was validated by subjecting the stock solution of erlotinib to acidic, basic, photolysis, oxidative and thermal degradation. The linearity range and values for limit of detection (LOD) and quantification (LOQ) were found to be 1-198, 0.33, and 1.1ug/ml, respectively. The analysis of the tablet containing erlotinib was quite precise (relative standard deviation<1%).
Dept of Pharmaceutical Analysis Page 45
was monitored with dual U.V detection at wavelengths of 348nm erlotinib and 383nm erlotinib hydrochloride. The calibration graph was linear in the range of 100-4500ng/ml, with values for accuracy and precision ranging from 87.9 to 96.2% and 2.13 to 5.10% respectively, for three different sets of quality control samples.
Rasoulzadeh F38et.al:studied the mutual interaction of anticancer drug erlotinib hydrochloride with bovine serum albumin (BSA) using fluorescence and U.V /VIS spectroscopy. The BSA solution(0.1Mm) was prepared daily in tris buffer (0.05mol-1,ph=7.4) and treated at final concentration of 1.67x10⁻⁵M with different amount of erlotinib hydrochloride to obtain final concentration of 0,0.2,0.4,0.8,1,2,4,6,8,20 and 42µm respectively. The mixture was allowed to stand for 5 min and the fluorescence quenching spectra were recorded at 298,303, 308 and 313k. It was found that erlotinib hydrochloride caused the fluorescence quenching of BSA by the formation of a BSA –ERLOTINIB HYDROCHLORIDE complex. The mechanism of the complex formation was then analysed by determination of the number of binding sites the apparent binding constant Ka, and calculation of the corresponding thermodynamic parameters. Such as the free energy (∆G), enthalpy (∆H) and entropy changes (∆S) at different temperatures. Results showed that binding of erlotinib hydrochloride to BSA was spontaneous and the hydrophobic forces played a major role in the complex formation. The distance r between donar (BSA) and the acceptor (ERLOTINIB HYDROCHLORIDE) was found to be less than 8nm. Non radioactive energy transferring and static quenching between these two molecules. The presence of single binding site on BSA and Ka values for the association of BSA with ERLOTINIB HYDROCHLORIDE increased by the increase in temperature.
Dept of Pharmaceutical Analysis Page 46
the solvent evaporation and reconstitution steps. Erlotinib was used as the internal standard. The SLE extraction recovery was 101.3%.The validated linear curve range was 2 to 2,000 ng/mL based on a sample volume of 0.100-mL, with a linear correlation coefficient of > 0.999. The validation results demonstrated that the present method gave a satisfactory precision and accuracy: intra-day CV < 5.9% (<8.4% for the lower limit of quantitation, LLOQ) with n = 6 and the accuracy of 98.0–106.0%; inter-day CV < 3.2% (<1.5% for LLOQ) with n = 18 and the accuracy of 100.0– 103.2%. A dilution factor of 10 with blank plasma was validated for partial volume analysis. The stability tests indicated that the erlotinib in human plasma is stable for three freeze-thaw cycles (100.0–104.5% of the nominal values), or 24-h ambient storage (100.0–\104.8% of the nominal values), or 227-day frozen storage at both -20 ºC (91.5–94.5% of the nominal values) and -70 ºC (93.3–93.8% of the nominal values). The results also showed no significant matrix effect (<6.3%) even with direct injection of organic extract into the LC-MS/MS system.
Fouad Chiadmi40et.al:developed and validated an isocratic high-performance liquid chromatographic method for the determination of erlotinib in human plasma with detection at 348 nm. Quinine was used as internal standard. A reversed-phase symmetry C18 column (250 mm x 4.6 mm, 5 μm), was equilibrated with a mobile phase composed of potassium dihydrogen phosphate 0.05M and acetonitrile (60:40, v/v) with a final pH of 4.8 and having a flow rate of 1 mL/minute. The elution time for erlotinib and internal standard was approximately 7.4 and 2.6 minutes, respectively. Calibration curves of erlotinib in human plasma were linear in the concentration range of 50-1,000 ng/mL. Limits of detection and quantification in plasma were 6.3 and 21 ng/mL, respectively. Intra- and inter-day relative standard deviation for erlotinib in plasma was less than 3.3 and 4.1%, respectively.
Dept of Pharmaceutical Analysis Page 47
intermediates and long procedures. New intermediates and final compounds were identified by 1H NMR, 13C NMR and their purities were determined by HPLC. Invitro proliferative assay indicates that these two metabolites possessed antiproliferative activity against some conventional tumor cell lines and EGFR tyrosine kinase over- expression tumor cell lines as compared to Erlotinib control and their antitumor activity in cellular level was reported.
Han-Qing Li42et.al: developed and validated a new HPLC-UV method for the quantitative determination of epidermal growth facto rreceptor inhibitor erlotinib in the plasma of tumor bearing BALB/c nude mice. Erlotinib and its internal standard 1-(3-((6,7-bis (2-methoxyethoxy) quinazolin-4-yl) amino) phenyl) ethanone were extracted from mice plasma samples using liquid-liquid extraction with a mixed solvent