Effect of Pre-Strain on Transformation and Deformation Behavior
in Ti–50 at%Ni Shape Memory Alloy
*Toshio Sakuma
1, Yuji Mihara
2, Yasuo Ochi
3and Kiyoshi Yamauchi
41
Department of Human Welfare Engineering and Assistive Technology, Oita University, Oita 870-1192, Japan
2Piping Engineering Center, Chiyoda Co., Yokohama 230-8601, Japan
3Department of Mechanical Engineering and Intelligent Systems, University of Electro-Communications, Tokyo 182-8585, Japan
4Biomedical Engineering Research Organization, Tohoku University, Sendai 980-8579, Japan
In many cases that shape memory alloys are applied to engineering and medical fields, it is necessary to deform them in martensitic phase and after that, to recover them by heating. However, if a slip-deformation occurs, a shape recovery does not occur completely even if heated up above a reverse transformation finish temperatureAf. It is reported that transformation temperatures are changed by pre-deformation and in
constrained strain condition. Therefore, it is important to investigate the relationship between the pre-deformation and the deformation and transformation characteristics such as the recovery stress, the transformation temperatures and so on. The purpose of this paper is to clarify the influence of the pre-deformation on the recovery strain, the recovery stress and the transformation temperatures in a Ti–Ni shape memory alloy. The material used in this study is Ti–50 at%Ni alloy annealed at 1103 K for 60 s. The variation of the recovery strain, the recovery stress and the transformation temperatures by the pre-straining are investigated experimentally, and also the variation of the transformation and deformation characteristics by the pre-straining is discussed in relation to the volume fraction of slip-deformed martensite.
(Received October 14, 2005; Accepted December 15, 2005; Published March 15, 2006)
Keywords: shape memory alloy, titanium–nickel alloy, pre-strain, recovery stress, recovery strain, transformation temperature, volume fraction of slip-deformed martensite
1. Introduction
In many new materials, which have been developing nowadays, shape memory alloys (SMAs) are remarkably noticed for using as machine elements by means of their functional characteristics. Especially, a Ti–Ni based SMA has superior mechanical property and corrosion resistance, and so on, then, they are used practically in fields of engineering and medicine.1–3)In cases that those SMAs are
applied for using the recovery deformation and the recovery force by their shape memory effects, it is necessary to deform them in martensitic phase, and after that, to recover them by heating, then, to use their recovery functions with the reverse transformation. However, when the SMAs are deformed, the slip-deformation occurs in the alloys, the shape recovery does not occur completely even if they are heated up to the reverse transformation finish temperature ofAf. And also, it has been
reported that the recovery stress and the reverse trans-formation start and finish temperatures of As and Af are
effected by deformation conditions in the martensitic phase.4–10)Therefore, in order to apply the SMAs to use as functional materials for actuators and other devices, it is important to investigate the relationship between the pre-deformation and the pre-deformation, the transformation char-acteristics such as the recovery stress, the transformation temperatures and so on.
When the SMAs are loaded at a little higher temperature than the reverse transformation start temperature ofAs, the
martensitic phase of the SAMs preferentially occurs slip deformation.11) The slip-deformed martensitic phase does
not transfer to the parent phase by heating, and remains locally in the parent phase. Authors have defined the remained fraction of martensitic phase in the parent phase
as the volume fraction of slip-deformed martensite , and have clarified that the value ofcan be used as a criterion of pre-strain induced dislocation.12,13) And also, elastic strain energy is stored in the materials by the martensitic deforma-tion, and the energy promotes the reverse transformadeforma-tion, then it acts to restrain the martensite from transforming.7–10) Therefore, if the elastic strain energy is released by the deformation of the martensitic phase, the transformation temperature increases.
In this study, the Ti–50 at%Ni SMA is loaded with various pre-strains and heated after the unloading tests under conditions of constrained strain and stress free. And then, it is the purpose of the paper to clarify the effect of pre-strain on the recovery strain, the recovery stress and the transformation temperature. Also, the variation of the transformation and deformation characteristics will be discussed in relation to the slip-deformed martensite.
2. Experiment
2.1 Material and specimen
The material used in this study is Ti–50 at%Ni shape memory alloy, and it is performed by solid solution treatment at 1103 K for 60 s after cold extension working. The specimen is a wire with 1.0 mm in diameter and 70 mm in length. The transformation temperatures measured by DSC (Differential Scanning Calorimeter) and elastic moduli of martensitic phase and parent phase obtained by tensile tests are listed in Table 1, respectively. In the tensile tests obtained both elastic moduli, the tests were carried out at the fixed temperature of Afþ20K for the modulus of parent phase,
and at the fixed temperature ofAs20K after cooling down
to Mf30K for the modulus of the complete martensitic
phase. Where, temperaturesAsandAf show the start and the
finish temperatures of reverse transformation, respectively, andMsshows the martensite start temperature.
*This Paper was Originally Published in Japanese in J. Jpn. Inst. Met.69
(2005) 568–574.
2.2 Experimental procedure
2.2.1 Heating test under stress free condition
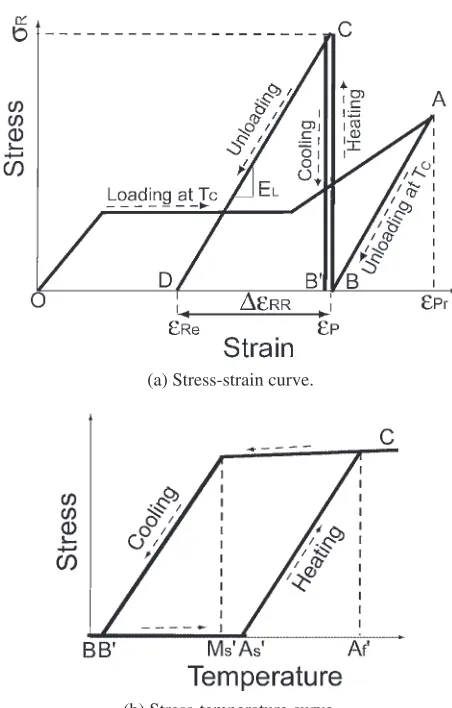
Figure 1(a) shows a schematic diagram of stress–strain curve in the heating test under the stress free condition. After the specimen was cooled to the martensitic phase at Mf
30K, it was loaded to a given pre-strain "pr at the fixed
temperature ofAs20K and unloaded (O–A–B). And then,
the specimen was heated under the stress free condition (B–C). The start temperature As0 and the finish temperature
Af0of the reverse transformation after the pre-strain loading
and unloading were obtained by the strain-temperature curve [see Fig. 1(b)], respectively. The percentage of recovery strain"Rby heating to"pris defined as the strain recovery
rateRR¼"R="pr100(%), and the percentage of residual
strain"Reafter heating to"pris defined as the strain residual
rateRp¼"Re="pr100(%). Where,"Reis the residual strain
after heating.
Moreover, the specimen was loaded again (C–D) after heating to Af0þ20K, and an apparent elastic modulusEL
was obtained from the stress–strain curve (C–D). Then, the volume fraction of slip-deformed martensite with various pre-strains was defined as the eq. (1),12,13)where,EAandEM
are elastic moduli of parent phase and martensitic phase, respectively.
¼EMðEAELÞ ELðEAEMÞ
ð1Þ
2.2.2 Heating test under constrained strain condition
Figure 2(a) shows a schematic diagram of stress– strain curve in the heating test under the constrained strain condition. After the specimen was cooled to the temperature at Mf30K, it was loaded to a given pre-strain"pr at the
fixed temperature of Tc¼As20K, and unloaded (O–A–
B). And then, the specimen was heated and cooled under the constrained strain condition (B–C–B0). From the stress– strain curve and the stress-temperature relation during heating-cooling process [see Fig. 2(b)], the recovery stress
R, the start and the finish temperature of reverse
trans-formation As0,Af0 and the martensite start temperatureMs0
after the pre-strain loading and unloading were obtained, respectively.
Moreover, the specimen was unloaded in the condition of re-heating to the temperature atAf0þ20K (B–C–D) after the
pre-strain loading and unloading, and an apparent elastic modulusELwas obtained from the stress–strain curve during
unloading process. Then, the volume fraction of slip-deformed martensitewas evaluated from the eq. (1). And, the recovery strain during unloading"RRwas defined as the
amount of recovery strain under the constrained strain condition.
(b) Strain-temperature curve. (a) Stress-strain curve.
Fig. 1 Schematic drawing of experimental procedure of stress free test.
(b) Stress-temperature curve. (a) Stress-strain curve.
Fig. 2 Schematic drawing of experimental procedure of constrained strain test.
Transformation temperatures (K) Young’s moduli (GPa)
Mf Ms As Af EM EA
[image:2.595.311.537.66.420.2] [image:2.595.52.538.74.456.2] [image:2.595.49.285.80.453.2]3. Results and Discussion
3.1 Effects of pre-strain on recovery strain and residual strain
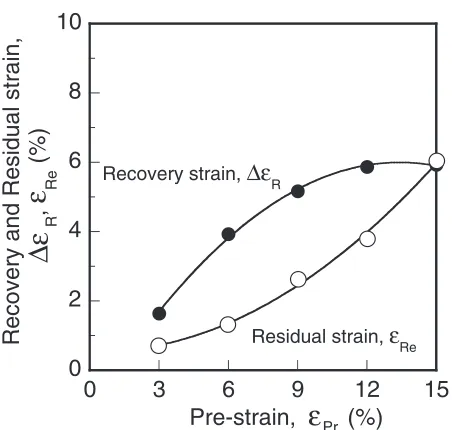
Figure 3 shows the relationship between the recovery and the residual strain "R, "Re and the pre-strain "pr in the
heating tests under the stress free condition. Both of strains increased with an increase in"pr, but"Rhas a tendency to
saturate over 12% of"pr.
Figure 4 shows the relationship between the recovery ratio and the residual ratio of strainRR,Rpand"pr.RRdecreases
and Rp increases with an increase in "pr, respectively.
Therefore, the shape memory function degrades with an increase in"pr. The slip deformation occurs in the martensitic
phase with an increase in the pre-strain. It is considered that the internal damage in material subjected to the slip
deformation increases with an increase in the pre-stain. As it is assumed that the shape memory function of martensitic phase is lost by the slip deformation, the martensitic phase with the shape memory possibility decreases with an increase in the slip deformation, and then, the shape memory recovery function decreases. Therefore, in this study, we discussed with using the volume fraction of slip-deformed martensite
as an index of the internal damage induced by the pre-strain. Figure 5 shows the relationship between and"prin the
case of the heating test under constrained strain and stress free conditions after the pre-strain loading. The values of
increase linearly with an increase in"prin both cases, and the
values of in the case of constrained strain condition are larger than those in the case of the stress free condition. In the latter condition, the internal damage in material occurs in the process of only pre-strain loading. In the former condition, the recovery stress is generated by the reverse transformation with an increase in temperature. Since there exist both of the parent phase and the martensitic phase in material during the process of the reverse transformation, the martensitic phase having the lower critical stress occurs the slip deformation by the recovery stress.11) Therefore, in the former condition adding the internal damage by the pre-strain loading to slip deformation by the recovery stress with heating,becomes larger than that in the latter condition.
Figure 6 shows the relationship between residual strain"Re
after heating under the stress free condition, the residual strain "Re after unloading under the constrained strain
condition and the volume fraction of slip-deformed marten-site. From the figure, in spite of difference in the condition, the relation between them shows the same linear relationship and the values of"Reincrease linearly with an increase in.
As the residual strain can be taken macroscopic damage in material, it is considered that it shows a factor of shape memory function released by plastic deformation, and then, the value ofis an index for evaluating generally the internal damage of material in spite of difference in the strain conditions at heating tests.
0
2
4
6
8
10
0
3
6
9
12
15
Recovery and Residual strain,
R
,
ε
Re(%)
Pre-strain, (%)
Recovery strain,
∆ε
R
Residual strain,
ε
Re
∆ε
ε
PrFig. 3 Variation of recovery and residual strain"R,"Re with pre-strain
"pr.
0
20
40
60
80
100
0
3
6
9
12
15
Recovery and Residual ratio,
R
R, R
P
(%)
Recovery ratio, RR
Residual ratio, R
P
Pre-strain, (%)
ε
PrFig. 4 Variation of recovery and residual ratioRR,Rpwith pre-strain"pr.
0
10
20
30
40
50
0
3
6
9
12
15
Volume fraction of
slip-deformed
martensite,
ξ
(%)
Constrained strain
Stress free
Pre-strain, (%)
ε
Pr [image:3.595.57.283.70.285.2] [image:3.595.313.540.75.275.2] [image:3.595.57.284.341.552.2]3.2 Effects of pre-strain on recovery stress
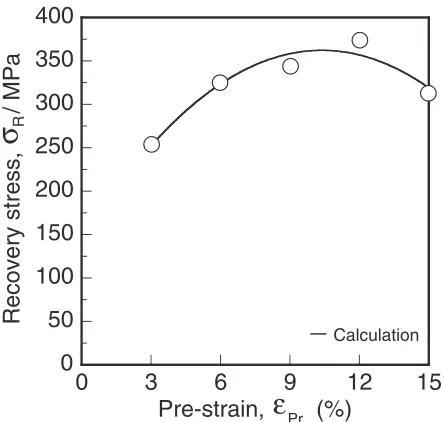
Figure 7 shows the relationship between the recovery stressRand the pre-strain"prin the heating tests under the
constrained strain condition.Rincreases with an increase in
"prup to about 9%, but it shows maximum in the
neighbor-hood of 9–12% of"prand then after that it decreases with an
increase in "pr. In order to increase the amount of shape
recovery with an increase in"pr(see Fig. 3), it is considered
that the recovery stress also increases. Therefore, the slip-deformed portion increases with an increase in"pras shown
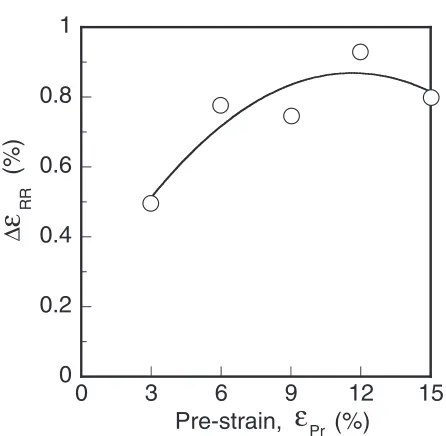
in Fig. 5, then it is assumed that the recovery stress decreases above 12%"pr. Figure 8 shows the relationship between the
recovery stressRand the amount of recovery strain"RRin
the heating test under the constrained strain condition. Since the residual strain increases with an increase in slip deformation in material, it is considered that the amount of the recovery strain becomes larger with a decrease in the internal damage of material. As the larger"RRis, the higher
Ris from Fig. 8, it is clear that the specimen has the higher
recovery stress as showing in the lower internal damage of material.
Here, we proposed a two-phase model considering of the parent phase and the martensitic phase connected in series as shown in Fig. 9. It is assumed that the specimen is applied by tensile loading of"RRby means of the constrained strain at
heating. Then,Ris expressed by following eq. (2) using the
apparent elastic modulusELand"RRafter heating,
R¼EL"RR ð2Þ
where, the apparent elastic modulus EL is obtained by
following eq. (3) using the values of obtained by experi-ments,
EL¼
EAEM
ð1ÞEMþEA
ð3Þ
0
5
10
0
10
20
30
40
50
Residual strain, (%)
Volume fraction of
slip-deformed martensite,
ξ
(%)
Stress free Constrained strain
ε
ReFig. 6 Relationship between residual strain"Re and volume fraction of
slip-deformed martensite.
0
50
100
150
200
250
300
350
400
0
3
6
9
12
15
Recovery stress, / MPa
σ
RCalculation
Pre-strain, (%)
ε
PrFig. 7 Variation of recovery stressRwith pre-strain"prof constrained
strain condition.
0
100
200
300
400
0
0.2
0.4
0.6
0.8
1
Recovery stress, /
MPa
RR
(%)
ε
σ
R∆
Fig. 8 Relationship between recovery stressRand recovery strain"RRof
constrained strain condition.
[image:4.595.62.283.70.307.2] [image:4.595.316.539.76.295.2] [image:4.595.309.543.352.467.2] [image:4.595.61.283.363.574.2]"RRcan be expressed approximately by following eq. (4)
as a function of"prresulted from the Fig. 10,
"RR¼ 4:8103"prþ0:1"prþ0:2 ð4Þ
Robtained from the eq. (3) are shown in Fig. 7 as the solid
curve. The curve expresses well the relation betweenRand
"pr.
3.3 Effect of pre-strain on transformation temperature
Figure 11 shows the relationship between the start temper-ature As0, the finish temperature Af0 of the reverse
trans-formation after pre-straining and the pre-strain "pr by the
heating test under the stress free condition. Figure 12 also shows the relationship betweenAs0,Af0and"prby the heating
tests under the constrained strain condition. Both of the transformation temperatures increase with an increase in"pr
under both conditions, and these results suggest that the elastic strain energy stored in material is released by loading of"pr. Moreover, the increasing rate ofAf0for"prin the case
of the heating test under the constrained strain condition is larger than that under the stress free condition.
Heating under the constrained strain condition generates the recovery stress. Since the recovery stress acts as the reverse force against the shape recovery of specimen, it acts as the resistance for the reverse transformation. Therefore, there needs a large driving force in order to finish the reverse transformation, and then, the reverse transformation finish temperature ofAfincreases remarkably under the constrained
strain condition.
Figure 13 shows the relationship between the temperature changes Ms (¼Ms0Ms) of the martensite start
temper-0
0.2
0.4
0.6
0.8
1
0
3
6
9
12
15
RR
(%)
∆
ε
[image:5.595.60.283.68.286.2]Pre-strain, (%)
ε
PrFig. 10 Variation of"RRwith pre-strain"pr.
0
3
6
9
12
15
300
330
360
390
420
450
A
s', A
f
' / K
AfAs '
'
[image:5.595.311.540.76.284.2]Pre-strain, (%)
ε
PrFig. 11 Variation of transformation temperaturesAs0 andAf0 with
pre-strain"prof stress free condition.
300
330
360
390
420
450
0
3
6
9
12
15
A
s', A
f
' / K
A
f'
A
s'
[image:5.595.57.283.328.545.2]Pre-strain, (%)
ε
PrFig. 12 Variation of transformation temperaturesAs0 andAf0 with
pre-strain"prof stress free condition.
0
3
6
9
12
15
0
20
40
60
80
100
∆
M
s
/ K
s
'
∆
M
s
∆
M
Pre-strain, (%)
ε
Pr [image:5.595.317.538.343.559.2]atureMsand"prunder the constrained strain conditions. The
value ofMs increases with an increase in"pras similar as
the other transformation temperatures, but it saturates above 6% of "pr. It has been reported from the study of the cold
worked SMAs that the transformation temperatures of SMAs decrease by inducing of dislocation.1)Therefore, the value of
is used as a criterion of dislocation density induced by"pr.
Supposing that the super cooling rate TPMð¼AfMsÞ
needed for the martensitic transformation is constant being independent on "pr, the temperature change Ms0 are
obtained as the following eq. (5).
Ms0¼Af0TPMMs ð5Þ
Ms0obtained by the eq. (5) is shown as the broken curve in
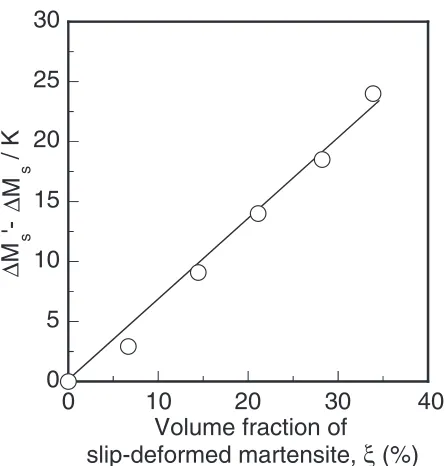
Fig. 13. Figure 14 shows the relationship between the change (Ms0Ms) and. From the figure, they show the linear
relation and the decreased change of Ms increases linearly
with an increase in . Therefore, the increase of the martensite start temperature Ms is restrained with an
increase inby increasing of"pr.
Figure 15 shows the relationship between the transforma-tion hysteresis (Af0Ms0) and"pr by heating test under the
constrained strain condition. It is clear that the hysteresis increases linearly with an increase in"pr. The temperatureAf0
increases remarkably with an increase in "pr, however, the
temperature Ms0 saturates above 6% of "pr as mentioned
before. Then, the transformation hysteresis (Af0Ms0)
increases constantly with an increase in"pr.
In cases of using the shape recovery and the recovery stress of SMAs, the smaller the heating quantity needed for finishing the reverse transformation is, the more the temper-ature responsive property increases. Figure 16 shows the relationship between the heating temperature difference (Af0As0) needed for finishing the reverse transformation
and"pr. From the figure, the value of (Af0As0) decreases
with an increase in"pr. The smaller the value of (Af0As0) is,
the smaller the driving force needed for finishing the reverse transformation is, and it is considered that the larger the"pris,
the more superior the temperature responsive property is. Therefore, the temperature responsive property increases with an increase in"prin both cases of the constrained strain
and stress free conditions. And also, there needs the larger heating temperature under the constrained strain condition than that under the stress free condition, and it is clear that the temperature responsive property becomes lower in that case. That is because of remarkable increase inAf0 in the case of
the constrained strain condition as shown in Fig. 12.
4. Conclusion
In this study, the effect of pre-strain "pr on the
trans-0
10
20
30
40
0
5
10
15
20
25
30
Volume fraction of
slip-deformed martensite,
ξ
(%)
s
'-s
/ K
∆
M
∆
[image:6.595.59.282.71.304.2]M
Fig. 14 Relationship between the (Ms0Ms) and the volume fraction
of slip-deformed martensite.
0
10
20
30
40
50
0
3
6
9
12
15
Hysteresis, (A
f
'-M
s
') / K
Constrained strain
Pre-strain, (%)
ε
PrFig. 15 Variation of transformation hysteresis (Af0Ms0) with pre-strain
"prof constrained strain condition.
0
10
20
30
40
50
0
3
6
9
12
15
A
f'-A
s
' / K
Constrained strain
Stress free
[image:6.595.312.541.75.290.2]Pre-strain, (%)
ε
Pr [image:6.595.312.538.348.563.2]formation and the deformation characteristics were inves-tigated in the Ti–50 at%Ni shape memory alloy. And we discussed by using the volume fraction of slip-deformed martensiteas the fraction of remained martensitic phase in the parent phase by pre-straining. The results obtained are summarized as the followings,
(1) Both of the recovery strain under the stress free condition and the recovery stress under the constrained strain condition increase with an increase in "pr to the
values of 9–12% and after that they decrease with"pr.
(2) Both of the start and the finish temperatures of the reverse transformation increase with an increase in"pr
in both cases of the constrained strain and the stress free conditions. The reverse transformation finish temper-ature increases larger in the case of the constrained strain condition than that in the case of stress free condition.
(3) The martensite start temperature also increases with an increase in "pr; however, the increase is restrained
above 6%"prdue to the increase in.
(4) The heating temperature difference (Af0As0) from
the start temperature to the finish one of the reverse transformation decreased with an increase in "pr, and
the temperature responsive property increases with in"pr.
(5) The changes of the transformation and the deformation characteristics with the pre-strain are explained qual-itatively by using as a criterion of slip-induced dislocation density in material.
REFERENCES
1) S. Miyazaki, T. Sakuma and T. Shibuya: Properties and Application Development of Shape Memory Alloy (CMC, Japan 2001).
2) T. Honma: J. Jpn. Soc. Mech. Eng.87(1984) 517–522. 3) K. Yamauchi: Jpn. Inst. Met.7(1993) 495–499.
4) K. Kaneko, H. Aoki, M. Kubo, T. Suzuki, M. Uehara and A. Yoshida: J. Jpn. Inst. Met.5(1994) 512–518.
5) P. Lin, H. Tobushi, K. Tanaka, T. Hattori and M. Makita: Trans. Jpn. Soc. Mech. Eng.60A(1994) 113–119.
6) P. Lin, H. Tobushi, K. Kimura, H. Iwanaga and T. Hattori: Trans. Jpn. Soc. Mech. Eng.60A(1994) 120–125.
7) H. G. Yong and C. M. Wayman: Acta Met.22(1974) 887–896. 8) G. B. Olson and M. Cohen: Scr. Met.9(1975) 1247–1254. 9) R. J. Salzbrenner and M. Cohen: Acta Met.27(1979) 739–748. 10) M. Piao, K. Otsuka, S. Miyazaki and H. Horikawa: Mater. Trans., JIM
34(1993) 919–929.
11) S. Miyazaki, T. Imai, Y. Igo and K. Otsuka: Met. Trans. A17A(1986) 115–120.
12) T. Sakuma, M. Hosogi, N. Okabe, U. Iwata and K. Okita: Mater. Trans.
43(2002) 815–821.
13) T. Sakuma, M. Hosogi, N. Okabe, U. Iwata and K. Okita: Mater. Trans.