DEVELOPMENT OF NEW SHOWER HEAD BASED ON WATER FLOW ANALYSIS
NUR AMALINA BINTI MUSTAFA
This thesis is submitted in partial fulfilment of requirement for the completion Bachelor of Mechanical Engineering (Thermal-Fluids) with honours
Faculty of Mechanical Engineering Universiti Teknikal Malaysia Melaka
ii
SUPERVISOR DECLARATION
“I hereby declare that I have read this thesis and in my opinion this thesis is sufficient in terms of scope and quality for the award of the degree of
Bachelor of Mechanical Engineering (Thermal-Fluids) (Hons.)”
ii
DECLARATION
“I hereby declare that the work in this report is my own except for summaries and quotations which have been duly acknowledged.”
iv
Special dedication to my mom and dad
iv
ACKNOWLEDGEMENT
Bissmillahirrahmanirrahim,
Alhamdulillah. Thanks to Allah SWT, whom with His bless gave me the opportunity to complete this Final Year Project which is titled Development of New Shower Head Based on Water Flow Analysis. This Final Year Project (FYP) report was prepared for the Faculty of Mechanical Engineering, University Teknikal Malaysia Melaka (UTeM). This report is partial fulfilment of requirement for the completion of Bachelor of Mechanical Engineering (Thermal-Fluids) with honor.
v
ABSTRACT
vi
ABSTRAK
viii
TABLE OF CONTENT
CHAPTER TITLE PAGE
SUPERVISOR DECLARATION ii
DECLARATION iii
DEDICATION iv
ACKNOWLEDGEMENT v
ABSTRACT vi
ABSTRAK vii
TABLE OF CONTENT viii
LIST OF TABLE x
LIST OF FIGURE xi
LIST OF SYMBOLS xiii
LIST OF APPENDICES xiv
CHAPTER 1 INTRODUCTION
1.1 Background Study 1
1.2 Problem Statement 2
1.3 Objectives 2
1.4 Scope of Study 3
1.5 Importance of Study 3
CHAPTER 2 LITERATURE REVIEW
2.1 Background Study 4
2.2 History of Shower Head 4
2.3 Water Velocity in Pipe 5
2.4 The Bernoulli Equation 6
ix
CHAPTER TITLE PAGE
2.6 Diameter of Nozzle Hole 7
2.7 Skin Pressure 8
2.8 Baseline Water and Energy Consumption 9
2.9 Water Consumption 9
2.10 Water Flow and Supply Pressure 11
2.11 Type of Shower Head and Shower System 12
CHAPTER 3 METHODOLOGY
3.1 Background Study 17
3.2 Project Flowchart 17
3.3 Apparatus 19
3.4 Collection of Data 21
3.5 SolidWorks Setting 22
3.6 Designs of Shower Head 23
3.7 ANSYS Setup 27
CHAPTER 4 RESULTS AND DISCUSSIONS
4.1 Background Study 31
4.2 Analysis 32
4.3 Discussion 47
CHAPTER 5 CONCLUSION AND RECOMMENDATION
5.1 Conclusion 53
5.2 Recommendations 54
REFERENCES 56
BIBLIOGRAPHY 59
ix
LIST OF TABLE
NUM. TITLE PAGE
2.1 Maximum Velocity of Water on Different Application 4 2.2 Water Velocity in Different Pipe Diameter 4 3.1 Dimensions of All Parts in Current Shower Head 21
3.2 General Setup 27
x
LIST OF FIGURE
NUM. TITLE PAGE
2.1 American Virgunia Stool Shower 5
2.2 Skin Pressure Measurement 8
2.3 Daily Peak Instantaneous Flow Rates, 12 Study Sites 10 2.4 Pressure Flow Relationship 11
2.5 Multiple Shower Head 12
2.6 Cascading Shower Head 13
2.7 Shower Panel 14
2.8 Rain System Shower Head 14
2.9 Body Spas System 15
2.10 Recirculating Shower Head 16
3.1 Project Flowchart 18
3.2 Vernier Calliper 19
3.3 Startup of SolidWorks 22
3.4 Balls 23
3.5 Model of Current Shower Head 24
3.6 Cross Section View of Current Shower Head 24
3.7 Model of New Design 1 25
3.8 Cross Section View of New Design 1 25
xi
3.10 Cross Section View of New Design 2 26
3.11 Fluent Launcher 27
3.12 Initialization Set Up 29
3.13 Current Shower Head Completed Calculation 30
4.1 Mesh For Current Shower Head 32
4.2 Contour of Y Velocity For Current Shower Head 33 4.3 Velocity against Distance (Current Shower Head) 34 4.4 Vector of Y Velocity For Current Shower Head 35 4.5 Contour of Pressure For Current Shower Head 36 4.6 Contour of Pressure For Current Shower Head (Magnify) 36
4.7 Mesh For New Design 1 37
4.8 Contour of Y Velocity For New Design 1 38 4.9 Velocity against Distance (New Design 1) 39 4.10 Vector of Y Velocity For New Design 1 40 4.11 Contour of Pressure For New Design 1 41 4.12 Contour of Pressure For New Design 1 (Magnify) 41
4.13 Mesh For New Design 2 42
xii
LIST OF SYMBOLS
mm = Milimeter
m/s = Milimeter per second
Pa = Pascal
kPa = Kilopascal
psi = Pounds per square inch
GPD = Gallons Per Day Used For Showers
P = Population
SPD = Showers per person per day
f = Shower flow rate
t = Shower duration
𝑃
𝜌 = Flow Energy
𝑉2
2 = Kinetic Energy
gz = Potential Energy
𝑉𝑎𝑣𝑔 = Average flow velocity (m/s)
D = Characteristic length of the geometry (diameter) (m) v = 𝜌
xiii
LIST OF APPENDICES
NUM. TITLE
1 APPENDIX 1
Gantt Chart of PSM 1 and PSM 2
2 APPENDIX 2
Parts of Shower Head and ANSYS Result
3 APPENDIX 3
1
CHAPTER 1
INTRODUCTION
1.1 BACKGROUND STUDY
People are using water around 150 litres per day. But, water is a precious resource that user should minimise from wasting it. If people use water wisely, it can help reducing the amount of water taken from rivers or underground water. One of the easiest way to make the most of potential benefits is to reduce the amount of water use at home.
There are a lot of home appliances use water such as, toilet, shower head, laundry, dish washer and kitchen faucet. In general, to be known that almost 38% of daily water usage is came from shower (www.south-staffs-water.co.uk, 2010). Thus, this paper will focus on shower head.
2
This study is comparing the water flow pattern from the new designs with current design of shower head. The time taken of user in the shower also affects the amount of water usage. Water-saving shower head is the most selected as it can reduce the water usage even though the bather shower at a longer time. The new design is supposedly to be more economic in water flow compared to the current design. The analysis will be based on the comparison of the water flow.
1.2 PROBLEM STATEMENT
There are factors that should be highlighted in order to produce a good product without having any problems. Today, a homeowner has many choices to choose hundreds of models of shower head available. At the beginning of the production of shower head must have many problems in satisfying customers demand. One choice that is not available, however, is complete control of the water flow: since 1992, by law, all shower head that are manufactured in the United States must restrict water flow to 2.5 gallons (9.5 liters) per minute or less. This is down from the prior level of 4.5 gallons (17 liters) of water per minute. As a result, many shower head developed since that time aerate the water flow in order to provide a fuller spray (Peter, 2006).
The invention relates to a shower head having a housing and a surface where jets exit the housing. The surface has numerous exit apertures. Various forms of shower heads of that type have long been known and inherently have numerous modes of system (Woolf, 2005).
1.3 OBJECTIVES
The objectives of this project are as follows: a) To design new shower heads.
b) To analyse the flow analysis of shower heads.
3
1.4 SCOPE OF STUDY
The scopes of this project are as follows:
a) Design new shower heads.
Shower heads are designed by using SolidWorks software.
b) Analyse water flow of the new shower heads.
The water flow of the new designs of shower heads are analysed using Computational Fluid Dynamic (CFD).
c) Analysis to compare the water flow pattern of the new shower heads and the current one.
The water flow analysis of the new shower heads are compared with the current design which focusing on velocity and pressure of the outlet.
1.5 IMPORTANCE OF STUDY
4
CHAPTER 2
LITERATURE REVIEW
2.1 BACKGROUND STUDY
Water is a scarce resources around the world. Yet, human have numerous opportunities on the best way to save it. One of the opportunities is by water preservation is the shower (Kappel and Grechenig, 2009).
2.2 HISTORY OF SHOWER HEAD
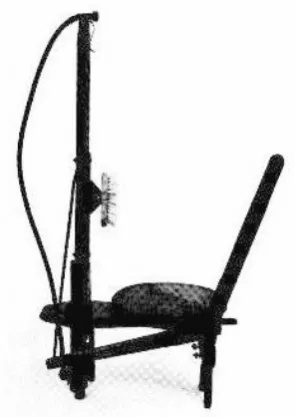
5
Figure 2.1: American Virgunia Stool Shower (Source : Etindustries, 2015)
2.3 WATER VELOCITY OF PIPE
[image:19.595.245.393.70.279.2]In order to avoid noise and damaging wear and tear of pipes and fittings, the fluid flow velocities of water should not exceed certain limits. Table 2.1 shows the different application will give different velocity.
Table 2.1: Maximum Velocity of Water on Different Application (Source: Engineeringtoolbox, 2015)
Application Maximum Velocity (m/s)
Tap water (low noise) 0.5 – 0.7
Tap water 1.0 – 2.5
Cooling water 1.5 – 2.5
Suction boiler feed water 0.5 – 1.0 Discharge boiler feed water 1.5 – 2.5
Condensate 1.0 – 2.0
[image:19.595.130.506.534.709.2]6
[image:20.595.165.473.232.429.2]Other than the application of the water, the cross section area of the pipe also affects the velocity of the water. The cross section area is more or less depends on the diameter of the pipe. The larger the pipe size, the velocity of water is increasing. As a rule of thumb, the following velocities can be used in design of piping and pumping system for water as shown in Table 2.2.
Table 2.2 : Water Velocity in Different Pipe Diameter (Source: Engineeringtoolbox, 2015) Pipe diameter (mm) Water velocity (m/s)
25 1
50 1.1
75 1.15
100 1.25
150 1.5
200 1.75
250 2
300 2.65
2.4 THE BERNOULLI EQUATION
The Bernoulli equation is an approximate relation between pressure, velocity and elevation. It is valid in regions of stead, incompressible flow where net frictional force are negligible (A. Cengel and M. Cimbala, 2010). The pressure and velocity is inversely proportional. It means, high pressure will have low velocity and vice versa. Equation 1 shows the steady and incompressible flow in Bernoulli.
Steady, incompressible flow: 𝑃1
𝜌 + 𝑉12
2 + g𝑧1 = 𝑃2
𝜌 + 𝑉22
2 + g𝑧2 ( 1 ) Where:
𝑃
𝜌 = flow energy 𝑉2
7
2.5 LAMINAR AND TURBULENT FLOW
The transition from laminar to turbulent flow depends on the geometry, surface roughness, flow velocity, surface temperature and the of fluid. After exhaustive experiments in the 1880s, Osborne Reynolds discovered that the flow regime depends mainly on the ratio of inertial forces in the fluid. This ratio is called as Reynolds number. It can be express for internal flow as in Equation 2 below.
Re = 𝐼𝑛𝑒𝑟𝑡𝑖𝑎𝑙 𝑓𝑜𝑟𝑐𝑒𝑠𝑉𝑖𝑠𝑐𝑜𝑢𝑠 𝑓𝑜𝑟𝑐𝑒𝑠 = 𝑉𝑎𝑣𝑔𝐷
𝑣 = 𝜌𝑉𝑎𝑣𝑔𝐷
𝜇 ( 2 )
Where:
𝑉𝑎𝑣𝑔 = Average flow velocity (m/s)
D = Characteristic length of the geometry (diameter) (m)
v = 𝜌
𝜇 = Kinematic velocity of the fluid (/s)
Laminar flow generally happens when dealing with low flow velocity. Meanwhile, the turbulent flow happens at high flow velocity and larger pipe size or larger space. In turbulent, vortices, eddies and wakes make the flow is unpredictabe (A. Cengel and M. Cimbala, 2010).
2.6 DIAMETER OF NOZZLE HOLE
8
efficient means of delivery. It will also be shown that surface pressure is extremely difficult to assess (Woolf et al., 2006).
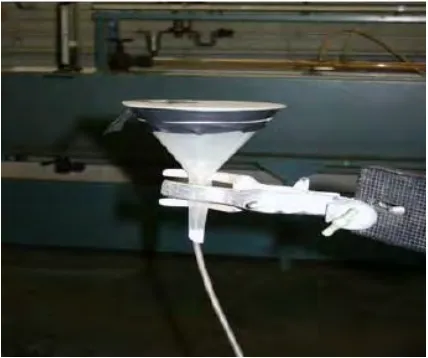
2.7 SKIN PRESSURE
The pressure applied by a shower on the skin of the consumer has been assessed (Woolf et al., 2006) at around 50 Pa, or around 5 mm water gauge. Pressure of this request can be measured utilizing the effect of a shower on a microbalance (British Standards, 1983) however this procedure is troublesome to use except for vertical impact and just to be used in laboratory.
In the present work we have utilized a method indicated as in Figure 2.2. A thin rubber diaphragm is fixed on to a plastic funnel, and connected with a thin plastic funnel to an electronic manometer with a 2000 Pa full scale and 0.1 Pa resolution (Alkhaddar et al., 2007).
[image:22.595.212.426.423.602.2]9
2.8 BASELINE WATER AND ENERGY CONSUMPTION
The baseline water use for showers in the United States can be used to put the water and energy savings potential into perspective. The calculations below show that showers consume 3.7 billion gallons, or approximately 9,000 acre-feet, of water every day in the United States (Peter, 2006).
GPD = P·SPD·f·t ( 3 )
Where:
GPD = gallons per day used for showers P = Population = 290 million
SPD = Showers per person per day = 0.70 f = Shower flow rate = 2.2 gpm t = Shower duration = 8.2 minutes
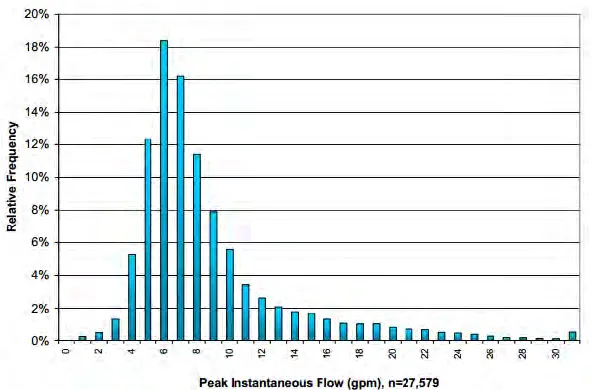
2.9 WATER CONSUMPTION
At the end of the information collection of The Residential End Uses of Water Study (REUWS), 28,015 complete days of data (as known as "logged days") were collected from the 1,188 participating study homes. Frequency distributions of the peak instantaneous flow rate observed during each of the logged days for each one study house were created. The frequency distribution, indicated in Figure 2.3 shows that the observed peak instantaneous flow regardless of water use classification (indoor and outside) (Peter and William, 1999).
10
35 gpm. The largest water size meter utilized as a part of this study was a 1 ½ inch meter (a bit unordinary in the single-family sector).
More than 90% of the recorded peak instantaneous flows were less than or equivalent to 15 gpm (Peter and William, 1999).
Figure 2.3: Daily Peak Instantaneous Flow Rates, 12 Study Sites. (Sources: Peter and William, 1999)
[image:24.595.172.468.201.396.2]