UNIVERSITI TEKNIKAL MALAYSIA MELAKA
FIBER OPTIC SENSOR (FOS) FOR ETHANOL DETECTION
AND OPTIMIZATION PERFORMANCE USING ANALYSIS
TECHNIQUE
This report submitted in accordance with requirement of the Universiti Teknikal Malaysia Melaka (UTeM) for the Bachelor of Electronic Engineering Technology
(Telecommunication) with Honours
by
SYAMIMI WAHIDAH BINTI AHMAD NIZAR
B071210513
910604-08-5360
UNIVERSITI TEKNIKAL MALAYSIA MELAKA
BORANG PENGESAHAN STATUS LAPORAN PROJEK SARJANA MUDA
TAJUK: Fiber Optic Sensor For Ethanol Detection And Optimization Performance Using
Analysis Technique
SESI PENGAJIAN: 2015/2016 Semester 1
Saya SYAMIMI WAHIDAH BINTI AHMAD NIZAR
mengaku membenarkan Laporan PSM ini disimpan di Perpustakaan Universiti Teknikal Malaysia Melaka (UTeM) dengan syarat-syarat kegunaan seperti berikut:
1. Laporan PSM adalah hak milik Universiti Teknikal Malaysia Melaka dan penulis. 2. Perpustakaan Universiti Teknikal Malaysia Melaka dibenarkan membuat salinan untuk
tujuan pengajian sahaja dengan izin penulis.
3. Perpustakaan dibenarkan membuat salinan laporan PSM ini sebagai bahan pertukaran antara institusi pengajian tinggi.
4. **Sila tandakan ( )
SULIT
TERHAD
TIDAK TERHAD
(Mengandungi maklumat yang berdarjah keselamatan atau kepentingan Malaysia sebagaimana yang termaktub dalam AKTA RAHSIA RASMI 1972)
(Mengandungi maklumat TERHAD yang telah ditentukan oleh organisasi/badan di mana penyelidikan dijalankan)
( )
Alamat Tetap:
NO, 10 JALAN 5A
TAMAN BUKIT BADONG 45600,
BESTARI JAYA, SELANGOR
Tarikh: ________________________
Disahkan oleh:
( )
Cop Rasmi:
Tarikh :
Tarikh: _______________________
iii
DECLARATION
I hereby, declared this report entitled “(Fiber Optic Sensor) FOS For Ethanol
Detection And Optimization Performance Using Analysis Technique” is the result of
my on research except as cited in references.
Signature : ………..
Name : SYAMIMI WAHIDAH BINTI AHMAD NIZAR
iv
APPROVAL
This report is submitted to the Faculty of Engineering Technology of UTeM as a partial fulfillment of the requirements for the degree of Bachelor of Engineering Technology departments of Electronic and Computer Engineering Technology.
v
ABSTRACT
vi
ABSTRAK
vii
DEDICATION
viii
ACKNOWLEDGEMENT
Alhamdulillah, thank to ALLAH, finally the Bachelor Degree Project report is completed. It order to complete this report many obstacle and many people contributed towards my understanding and thought.
Foremost, I would like to thank my supervisor Mr, Md Ashadi Bin Md Johari for the full of supports and pointed guidance given all along my bachelor degree project.
After that, the important I would like to express my family for their whole hearted supported during my study. Without their encouragement and supported in both of financial and mental, I not going so far on this time.
ix
TABLE OF CONTENTS
DECLARATION………..iii
APPROVAL………..iv
ABSTRACT………v
ABSTRAK………vi
DEDICATIONS……….vii
ACKNOWLEDGMENTS………..viii
TABLE OF CONTENTS………...ix
LIST OF FIGURES………xiii
LIST OF TABLE………xv
LIST OF SYMBOLS AND ABBREVIATIONS………...xvi
CHAPTER 1……….1
1.0 Introduction ………...1
1.1 Background of Project ……….1
1.2 Objective ………..2
1.3 Problem Statement ………..3
x
CHAPTER 2………...……5
2.0 Introduction ………...5
2.1 Fiber Optic ……….…5
2.1.1 Why Glass Fibers? ………6
2.1.2 Single-Mode and Multi-Mode Fiber ……….6
2.1.3 How the Fiber Optic Work ………8
2.1.4 Advantage and Disadvantage of Fiber Optic ………8
2.2 Fiber Optic Sensor ………...9
2.2.1 Study of Characterization of Intensity Modulated Fiber Optic Sensor………...10
2.2.2 Electrically Insulated Sensing of Respiratory Rate and Heartbeat Using Optical Fibers ………16
2.2.3 Fiber Optic Sensor for Detection of Toxic and Biological Threats..………..21
2.3 Ethanol ………....24
2.4 Light Source ………25
2.4.1 Laser Diode ……….…26
CHAPTER 3……….…27
3.0 Introduction ……….27
3.1 Project Methodology ………...27
xi
3.1.2 Literature review ……….…...29
3.1.3 Deciding Raw Material……….29
3.1.4 Develop Sensor……….30
3.1.5 Testing Sensor………..30
3.1.6 Analyses the result………30
3.2 Flow Chart ………...31
3.3 Research the hardware and equipment needed……….32
3.3.1 OSA( Optical Spectrum Analyzer)………...32
3.3.2 ASE (Amplifies Spontaneous Emission)………..33
3.3.3 Single Pigtail Optical Fiber………..34
3.3.4 Cleaning the fiber cable………35
3.3.5 Splicing method………36
3.3.5.1 Stripping and cleaving the fiber………...36
3.3.6 Fusion Splicing ………38
3.3.7 Concentration of ethanol ……….39
3.4 Overview of Fiber Optic sensor………....40
3.4.1 Light source through fiber cable………...40
xii
CHAPTER 4……….42
4.0 Introduction………..42
4.1 Fiber Optic Sensor of Diagram……….42
4.2 Result of Detection Measurement for Ethanol Concentration……….…44
4.3 Analysis result from the graft line for every slope with power source wavelength 850nm and 1550nm ………..48
CHAPTER 5……….50
5.0 Introduction………..50
5.1 Discussion and conclusion chapter 3………51
5.2 Discussion and conclusion chapter 4………51
5.3 Future Work………..52
APPENDIX ………...53
REFERENCE………...54
xiii
LIST OF FIGURES
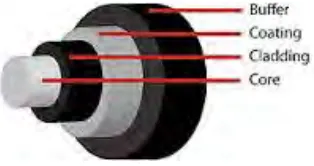
Figure 2.1: Fiber optic cable layer ……….6
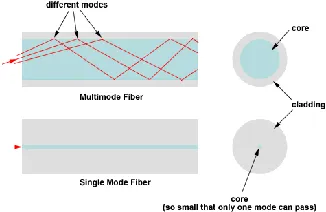
Figure 2.2: b) Diameter of single mode fiber. a) Diameter of multi-mode fiber………...7
Figure 2.2.1: Single mode and multi-mode cross sectional view………...7
Figure 2.3: Graph indicating the relation between concentration and refractive index of common salt solution and sugar………...11
Figure 2.4 : Experiment setup………..12
Figure.2.5: Graph showing variation of output power with refractive index of guiding liquid common salt solution at operating wavelengths 820nm & 850nm………13
Figure 2.6: The power loss at each concentration for both guiding liquids can be calculated using the following relation……….13
Figure 2.7: The relationship between refractive index and power loss at operating wavelengths 860nm and 850nm for guiding liquid of common salt solution…………..14
Figure 2.8:The relationship between refractive index and power loss at operating wavelengths 820nm and 850nm for guiding liquid of common sugar solution………...14
Figure 2.9: Diagram of the respiratory rate and heartbeat sensors placed on the isolated patient………...18
Figure 2.10: Show the respiratory rate (a) is heartbeat (b) is sensors………..19
Figure 2.11: Test subject using fiber optic sensor………19
Figure 2.12: Composite signal with the respiratory rate and the heartbeat………..20
Figure 2.13: Experiment set-up for sensor testing………23
Figure 2.14:Sensor response of chemical vapor of hydrazine………..24
Figure 2.3.1: Ethanol………....24
Figure 2.15: Laser Light Source For Fiber Optic……….25
Figure 3.1:Flow step ………28
Figure 3.2: Flowchart of steps the implement hold project………..31
xiv
Figure 3.4: Amplified Spontaneous Emission………..34
Figure 3.5: SC Fiber Optic Pig tail………...35
Figure 3.6: Cleaning the Fiber optic cable using alcohol……….35
Figure 3.7 : Cleaving and stripping process of fiber optic………...37
Figure 3.8: Cleaved by cleaver ………37
Figure 3.9 : a) before splicing of fiber cable between single mode fiber and pig tail single mode fiber and b) after the process………38
Figure 3.10: Concentration Ethanol……….39
Figure 3.11: Connection of fiber sensor with ASE and OSA equipment, left side overview from upper and right side from in front………...40
Figure 3.12 : Light source pass through fiber cable. ………...40
Figure 3.13: Drop the concentration of ethanol at test area……….41
Figure 4.1: Design the Fiber Optic Sensor………..42
Figure 4.2: Real overviews of fiber optic sensor detect ethanol experiment setup……..43
Figure 4.4: Graft line corresponding of concentration detection of ethanol with power source wavelength 850nm and 1550nm………...45
Figure 4.5: 1st slope for 850nm light source with trend line………46
Figure 4.6: 2nd slope for 850nm light source with trend line………...46
Figure 4.7: 1st slope for 1550nm light source with trend line ...46
xv
LIST OF TABLE
xvi
LIST OF ABBREVIATIONS, SYMBOL AND NOMENCLATURE
LAN Local Area Network FOS Fiber Optic Sensor NRC National Research Council
OPS Organic Conducting Polymer MPD Modal Power Distribution
LED Light Emitting Doide ELED Edge Emitting LED SLED Surface Emiting LED
LD Laser Diode
ASE Amplified Spontaneous Emission OSA Optical Spectrum Analyzer
1
CHAPTER 1
INTRODUCTION
1.0 Introduction
In this chapter, the purpose of the experiment design will be described generally. Begin with a brief explanation about the background of the experiment. Then the problem statement the lead to the idea of the experiment project and several objectives the aimed to achieve are established in order to overcome from the problem statement. This chapter also discuss about scope and objective are related with this experiment design.
1.1 Background of Project
2
mode. The other type is multi-mode, it is 10 times bigger than single mode that means light beams can travel thought the core by the following a different paths. This project of create difference style using fiber optic normally used in communication lines. Fiber optic sensor is system consist of a fiber optic cable connected to a remote sensor or amplifier. Fiber optic is a technology had been proven as good sensor. It can replace with the other device sensor. Compare it them is unique for type of application, mainly where device sensor are difficult to develop the same wealth of information. Fiber optic sensor can measure the difference parameter such as liquid, chemical, temperature and so on. For this section ethanol had been used as parameter. Fiber optic sensor is system consist of a fiber optic cable connected to a remote sensor or amplifier. However this project for analyze the fiber optic sensor performance in determine the detection of ethanol with difference concentration. Ethanol the type of alcohol normally used on food and drink. Ethanol is also material that alcohol nature, thus it material non-halal follow the rules by Islam religion view. To detect this liquid it need to go through various chemical test that take quit long times for make sure its validity.
3
1.2 Objective
1. To study about fiber optic communication. 2. To analyze the result using the analysis technique.
3. To develop sensor could detect ethanol using fiber optic sensor.
1.3 Problem Statement
Malaysian Halal-food issue becomes warm topic in chest press. In Malaysia there is various types of food and drinks that are unique and attract this attention because diversity religion. Majority Malaysians that are religious Islam making legal issue is very sensitive and emphasized food and drinks. Inside foods content and drinks with often suspicious has made respective party take various steps to overcome this problem.
4
1.4 Scope
5
CHAPTER 2
THEORETICAL BACKGROUND
2.0 Introduction
This chapter will cover the literature review based on the previous research is depth study about the ethanol, based on this project ethanol is material to use for the experiment. Ethanol is the part of alcohol, so what the application of ethanol to the food industry. What is the concentration of ethanol in the food. In this chapter will be summarize about the fiber optic case, fiber optic sensor case, what is ethanol and type of light on fiber optic.
2.1 Fiber Optic
6
2.1.1 Why Glass Fibers?
[image:22.612.267.424.325.408.2]Why are optical fiber made of glass, glass is the remarkable material which has been in use in pure form the least 9000 years. The composition remained relatively unchanged for millennia and its uses have been widespread. The three important of glass which makes it of unprecedented value because there is a wide range of accessible temperatures where its viscosity is variable and can be well controlled unlike most materials, likes water and materials which remain liquid until their cooled down to their freezing temperature and suddenly become solid and highly pure silica is characteristic with extremely low loss. Ajoy Ghatak.(2008).
Figure 2.1: Fiber optic cable layer
2.1.2 Single-Mode and Multi-Mode Fiber
7
distance, higher bandwidth runs by Telecommunication, CATV companies, and Colleges and Universities.
[image:23.612.153.461.160.259.2]
Figure 2.2: b) Diameter of single mode fiber. a) Diameter of multi-mode fiber
Another type is multi-mode, each optical fiber in a multi-mode cable is about 10 times bigger than one in a single-mode cable. This means light beam can travel thought the core following a verity of different paths create to ability for more data pass thorough at given time. Chris Woodford (2015). The application is typically used for short distance, the example in data and audio/video applications in LANs. RF broadband signals. Multimode fiber is usually 50/125 and 62.5/125 in construction. This means that the core to cladding diameter ratio is 50 microns to 125 microns and 62.5 microns to 125 microns.
Figure 2.2.1: Single mode and multi-mode cross sectional view.
[image:23.612.231.394.481.587.2]8
2.1.3 How the Fiber Optic Work
Optical fibers carry light signals down them in what are called modes. There just different ways of travelling a mode is simply the path that a light beam follows down the fiber. One mode is to go down the middle of the fiber. Another bounce down the fiber at a shallow angle. Other modes involve bouncing down the fiber at the other angle, more or less sleep. Light travels down a fiber optic cable by bouncing repeatedly off the walls. Each tiny photon (particle of light) bounces down the pipe like a bobsleigh going down an ice run. Now you might expect a beam of light, travelling in a clear glass pipe, simply to leak out of the edges. But if light hits glass at a really shallow angle (less than 42 degrees), it reflects back in again as though the glass were really a mirror. This phenomenon is called total internal reflection. It's one of the things that keeps light inside the pipe.
The other thing that keeps light in the pipe is the structure of the cable, which is made up of two separate parts. The main part of the cable in the middle is called the core and that's the bit the light travels through. Wrapped around the outside of the core is another layer of glass called cladding. Cladding is to keep the light signals inside the core. It can do this because it is made of a different type of glass to the core. It has a lower refractive index than the core. This causes total internal reflection that stops the light escaping and keeps it bouncing down the core.
2.1.4 Advantage and Disadvantage of Fiber Optic