Does Anticipation Help or Hinder Performance in a
Subsequent Speech?
Mike Brown and Lusia Stopa
University of Southampton, UK
Abstract.This study examined the effects of anticipatory processing on a subsequent speech in high and low socially anxious participants. Forty participants (n=20 in each group) gave two speeches, one after no anticipatory processing and one after 10-minutes of anticipatory processing. In anticipatory processing, high socially anxious participants were more anxious, and experienced more negative and unhelpful self-images than low socially anxious participants did. However, both groups rated memories of past speeches as having a somewhat helpful effect on their speech preparation. High socially anxious participants tended to use the observer perspective more in the anticipated speech, while, in the unanticipated speech, they might have been switching between observer and field perspectives. Low socially anxious participants tended to use the field perspective in both speeches. High and low socially anxious participants reported better speech performances after the anticipated, compared to after the unanticipated speech. Results suggest that anticipatory processing may have both positive and negative effects on socially anxious individuals’ cognitive processing and performance before and during a speech.
Keywords:Anticipatory processing, social anxiety, performance, perspective-taking.
Introduction
Clark and Wells’ (1995) cognitive model of social phobia proposes a number of anticipatory processes that maintain anxiety in the disorder. The model states that, “As [socially phobic individuals] start to think about the event, they become anxious and their thoughts tend to be dominated by recollections of past failures, [and] by negative images of themselves during the event. . .. Sometimes these ruminations lead the phobic to avoid the event completely” (Clark and Wells, 1995, p. 74). If this does not happen and the individual participates in the event, “he or she is likely to be in a self-focused processing mode, to expect failure, and to be less likely to notice any signs of being accepted by other people” (Clark and Wells, 1995, p. 74). This implies that anticipatory processing contributes to the individual’s negative experience of the event.
Only two studies have explicitly investigated anticipatory processing in social anxiety. Vassilopoulos (2004) conducted a psychometric study to collect basic information about anticipatory processing. High socially anxious participants reported more intrusive negative thoughts in anticipatory processing, compared to low socially anxious participants. The high
Reprint requests to Mike Brown, School of Psychology, University of Southampton, Highfield, Southampton SO17 1BJ, UK. E-mail: [email protected]
social anxiety group also anticipated how they would act in front of others, as if they were “watching a movie in which they were the protagonists” (Vassilopoulos, 2004, p. 309). This description is similar to Clark and Wells’ (1995) suggestion that socially phobic individuals experience images in which they see themselves as if viewed from an observer’s perspective. In addition, some low socially anxious participants reported that anticipatory processing decreased their anxiety, suggesting that it may have had a positive quality for them.
Hinrichsen and Clark (2003) designed two studies that examined anticipatory processing in social anxiety. The first study used a semi-structured interview to compare high and low socially anxious individuals’ anticipatory processing. Results showed that, in anticipatory processing, high socially anxious participants recalled significantly more past social failures and experienced more negative, observer perspective images, compared to low socially anxious participants. A second study investigated the anxiety inducing effects of the cognitive processes that were found to be characteristic of high socially anxious participants in the first study. High and low socially anxious participants either had a period of anticipatory processing or completed a distraction task before giving a speech. Engaging in the cognitive processes typical of high socially anxious individuals was associated with continued increases in anticipatory anxiety in both high and low socially anxious individuals, and led to higher peak anxiety during the speech.
While Vassilopoulos’ (2004) and Hinrischen and Clark’s (2003) studies are valuable additions to a sparse literature on anticipatory processing, they have some limitations. For example, Vassilopoulos’ (2004) study and Hinrischen and Clark’s (2003) first study were based on self-report questionnaires and may not accurately reflect socially anxious individuals’ anticipatory processing when exposed to real social events. In addition, Hinrischen and Clark’s (2003) second study measured the effect of anticipatory processing on anxiety only. Moreover, the study used a between-subjects design to compare distraction and anticipatory processing, in which individual differences between participants might have obscured interesting effects. Lastly, participants were instructed to engage in a number of anticipatory cognitive processes, as outlined in Clark and Wells’ (1995) model. In contrast, we opted for a more “naturalistic” type of anticipatory processing, in which participants were not directed as to how they should use their time in anticipatory processing. This allowed for potential group differences in anticipatory processing, and set up the experiment as a specific test of anticipatory processing in a speech task, rather than as a more general test of Clark and Wells’ (1995) model of anticipatory processing.
speeches, compared to low socially anxious participants. In addition, we predicted that, during the second speech, participants would report more public and private self-awareness, less awareness of their surroundings, use the observer perspective more, report more negative thoughts and have a higher belief in these thoughts, rate predicted and actual performance worse, and be more anxious, compared to during the unanticipated speech. Moreover, we predicted that the magnitude of these differences would be greater among high, compared to low socially anxious participants.
Method
Participants
Students (n=177) at the University of Southampton were screened using the Brief Fear of Negative Evaluation scale (BFNE: Leary, 1983), which was administered twice – once for screening and once again during the study. Students with scores of 28 (low social anxiety) and44 (high social anxiety) were eligible to participate. These two cut off points corresponded to oneSDbelow and above the mean BFNE score (M=35.7,SD=8.10; Leary, 1983). Forty-five participants were tested (4 men, 36 women). Five participants were excluded, two because they no longer met criteria on the BFNE and three because they refused to give the unanticipated speech. BFNE scores of the remaining 40 participants at testing produced a high (n=20) and a low (n=20) social anxiety group.
Design
There was one between-subjects variable (low and high social anxiety) and one within-subjects variable (no anticipatory processing and 10 minutes of anticipatory processing). There were two possible speech topics (Topic A: The Advantages and Disadvantages of University Top Up Fees, and Topic B: The Advantages and Disadvantages of Legalizing Cannabis) that were counterbalanced across participants in the low and high social anxiety groups. A third topic (Topic C: The Advantages and Disadvantages of Britain Going to War with Iraq) was offered if participants did not want to speak on topics A or B. Participants spoke on a different topic in each condition.
Descriptive measures
Brief Fear of Negative Evaluation Scale (BFNE: Leary, 1983). The 12-item BFNE uses a 5-point rating scale, ranging from 1 (not at all characteristic of me) to 5 (extremely characteristic of me), rather than the true-false format of the original FNE scale (Watson and Friend, 1969). Total BFNE scores range from 12 to 60. Undergraduates’ responses were correlated highly with the original FNE scale (r=.96; Leary, 1983), and the BFNE demonstrated both high internal consistency (Cronbach’sα=.90–.91) and 4-week test-retest reliability (r=.75) in undergraduate samples (Leary, 1983). In this study, the BFNE demonstrated a significant relationship with the SPS (r=.73,p<.001) and the SIAS (r=.68,p<.001), suggesting it is a valid screening measure of social anxiety.
on a 5-point scale from 0 (not at all characteristic or true of me) to 4 (extremely characteristic or true of me). The SIAS and SPS are scored by summing the ratings and total scores range from 0–80. Both scales show good test-retest reliability over 4 and 12 weeks (SIAS,r=.92; SPS,r=.93) and have high levels of internal consistency (SIAS,r=.94; SPS,r=.93). The SIAS and SPS also discriminate well between individuals with social phobia and non-patient controls (Mattick and Clark, 1998).
Beck Anxiety Inventory (BAI: Beck and Steer, 1993). The BAI is a self-report scale consisting of 21 items that are descriptive of anxiety symptoms. Items are rated on a 4-point scale from 0 (not at all) to 3 (severely) with a range of 0–63. The BAI has good test-retest reliability (r=.75) and a high level of internal consistency (α=.92; Beck, Epstein, Brown and Steer, 1988).
Outcome measures during the 10-minutes of anticipatory processing phase
Anticipatory anxiety. Anxiety was rated on a 0–100 point scale of 0 (not at all anxious) to 100 (extremely anxious).
Self-images and memories of past speeches. Participants rated the degree to which they found self-images and memories of past speeches to be either “negative” or “positive”, using a 7-point bipolar rating scale that ranged from−3 to 0 to+3. On this scale,−3 to−1 was labelled as “Negative”, 0 was labelled as “Neutral”, and+1 to+3 was labelled as “Positive”. Participants were instructed to circle only one number – negative, positive, or neutral. They also rated the degree to which they found these images and memories “helpful” or “unhelpful” in their speech preparation, on a 0 (not at all helpful) to 100 (extremely helpful) scale.
Outcome measures during the unanticipated and anticipated speeches
State anxiety. “Happy”, “angry”, “depressed”, and “anxious” moods were measured on a 0 (not at all X) to 100 (extremely X) visual analogue scales. Anxiety was the key measure and the other moods were used as filler scales. This measure was also used to assess participants’ anxiety at baseline and after the 10-minute rest period.
Perspective
Participants rated whether they experienced images of themselves during the two speeches from either an observer or a field perspective. It was explained to participants that viewing an image of themselves from an “observer’s perspective” involved “. . .seeing yourself giving the speech as if from another person’s perspective”, whilst viewing an image of themselves from a “field perspective” involved “. . .seeing yourself giving the speech as if you were viewing the scene from behind your own eyes, observing the details around you.” As in previous studies (e.g. Cole, Turk, Heimberg and Fresco, 2001; Hackmann, Surawy and Clark, 1998; Spurr and Stopa, 2003; Wells, Clark and Ahmad, 1998; Wells and Papageorgiou, 1998), ratings of perspective were made on a scale from−3 to−1 (field) to+1 to+3 (observer). In addition to rating perspective, participants also wrote down in as much detail as possible the content of the perspective images they experienced during the speeches.
Cognitions
Cognitions were rated using a Negative Thoughts Checklist (NTC) that was adapted from the Public Speaking Rating Scale (Rapee and Lim, 1992) and the Social Cognitions Questionnaire (Wells, Stopa and Clark, 1993). The NTC comprised 20 items such as (I was going red) and (I was stuttering). Items were rated for frequency and belief. Frequency was measured on a 5-point scale of 0 (thought did not occur) to 4 (thought occurred all of the time). Belief was measured on a scale of 0 (I did not believe this thought at all) to 100 (I was completely convinced this was true). The NTC has high levels of internal consistency for frequency (Cronbach’s
α=.93) and belief (Cronbach’sα=.93), and good split-half reliability for frequency (r=.95) and belief (r=.94; Spurr and Stopa, 2003). Cronbach alpha’s of .92 (NTC: frequency subscale) and .96 (NTC: belief subscale) were obtained in this current sample.
Performance
Participants predicted how well they thought they would perform during the two speeches and how well they actually performed during them, on a 0–100 point scale of 0 (not at all well) to 100 (very well).
Materials and apparatus
We used one camcorder, mounted on a tripod, puzzle books, and magazines. The puzzle books were used during the 10-minutes of no anticipatory processing condition. Specifically, participants worked on a number of “word searches” (i.e. groups of words hidden in a grid of random letters), selected not to cause anxiety (e.g. capital cities of the world). The magazines were given to participants to browse during the 10-minute rest period.
Procedure
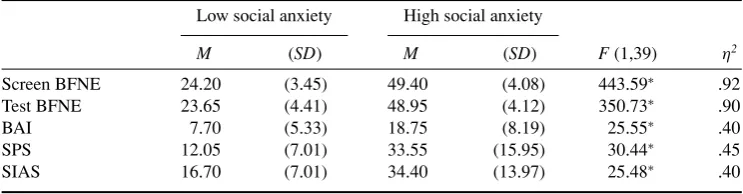
Table 1.Characteristics of participants in each social anxiety group Low social anxiety High social anxiety
M (SD) M (SD) F(1,39) η2
Screen BFNE 24.20 (3.45) 49.40 (4.08) 443.59∗ .92 Test BFNE 23.65 (4.41) 48.95 (4.12) 350.73∗ .90 BAI 7.70 (5.33) 18.75 (8.19) 25.55∗ .40 SPS 12.05 (7.01) 33.55 (15.95) 30.44∗ .45 SIAS 16.70 (7.01) 34.40 (13.97) 25.48∗ .40
Note. BFNE, Brief Fear of Negative Evaluation questionnaire; BAI, Beck Anxiety Inventory; SPS, Social Phobia Scale; SIAS, Social Interaction Anxiety Scale.∗p<.001.
anticipatory processing condition. Participants were then told that they would have to give a 2-minute speech on topic’s A or B in front of a video camera, and that their speech performance would be rated at a later date by a group of psychologists. They predicted how well they thought they would perform and then gave the speech in a different room, and completed the SSAS, NTC, perspective, performance, and anxiety measures. Participants had a 10-minute rest period in the original room and then rated current anxiety.
Participants were told that they would have to give a second speech and that they had 10-minutes to prepare themselves (anticipatory processing condition). They were told that the speech would be evaluated later by a different group of psychologists, and that they should use the full 10-minutes to prepare themselves mentally for what they would say during the speech. After this, participants completed the anticipatory processing measures, namely, anxiety, self-images, and memories of past speeches, and predicted how well they would perform the second speech. They performed the second speech in a different room and repeated the measures completed following the first speech, the social anxiety measures, and were debriefed. The experimenter remained in the room during both speeches.
Results
Participant characteristics
Table 1 shows the means and statistics for the standardized questionnaires for the two groups. Scores were compared using a MANOVA. There was a significant effect of group, F(1, 59)=82.65, p<.001, η2=.94. The high social anxiety group had higher scores on all measures of social anxiety than the low social anxiety group. The high social anxiety group’s mean score on the SIAS was very close to the mean score for the socially phobic patients (M=34.40 vs. M=34.60, t(1)=345.00, p<.01) in Mattick and Clark’s (1998) sample. The high social anxiety group’s mean score on the SPS was comparable to the mean score for the socially phobic patients (M=33.55 vs.M=40.00,t(1)=11.40,p=.06) in Mattick and Clark’s (1998) sample. The groups did not significantly differ on either gender (High group: 18 female, 2 male: Low group: 18 female, 2 male),χ2(1,N=40)=.000,ns, or on
The effect of anticipatory processing on participants’ anxiety, self-imagery, and memories of past speeches
Anticipatory anxiety. High socially anxious participants (75.50,SD=14.31) experienced significantly more anticipatory anxiety about giving the second speech than low socially anxious participants (58.50,SD=18.99),t(38)=−3.19,p<.05,η2=.08.
Self-imagery. Eighty-five percent of high and 65% of low socially anxious participants reported experiencing images of themselves giving the second speech,χ2(1,N=40)=2.13, ns. In the high social anxiety group, participants reported negative images of themselves giving the speech (M=−1.23, SD=1.37), whereas in the low social anxiety group, participants reported positive images of themselves giving it (M=0.23,SD=1.64),t(28)=2.68,p<.05,
η2=.10. High socially anxious participants (M=38.23,SD=18.10) also reported that the images had a more unhelpful influence on their speech preparation, compared to low socially anxious participants (M=57.69,SD=19.64),t(28)=2.81,p<.01,η2=.10.
Memories of past speeches. Significantly more high socially anxious participants (80%) recalled memories of speaking in public than low socially anxious participants (35%),χ2(1, N=40)=8.26,p<.05,η2=.20. However, contrary to our prediction, both groups rated the memories as rather neutral (High group:M=0.12,SD=1.59; Low group:M=0.71,SD=1.8; t(21)=.68,ns) and as having a somewhat helpful influence on their speech preparation (High group:M=58.12,SD=22.57; Low group:M=52.85,SD=27.51;t(21)=−.48,ns).
The effect of no anticipatory processing versus 10-minutes of anticipatory processing on participants’ self-awareness, perspective taking, anxiety, negative thoughts, and performance during the speeches
Manipulation check. To help assess whether participants’ performance in the first speech affected their preparation during anticipatory processing, we compared their anxiety levels at baseline and after the 10-minute rest period. Low socially anxious participants’ anxiety scores were positively skewed and therefore all anxiety scores were log transformed, which was successful in achieving normality.1 Participants’ anxiety ratings were analysed using a 2×2 (Time×Group) mixed ANOVA. There was a main effect of group,F(1, 38)=4.20, p<.05,η2=.10. High socially anxious participants reported significantly more overall anxiety (M=72.50, SD=50.35) than low socially anxious participants (M=45.50, SD=41.48). There was no main effect of time, F(1, 38)=1.93, ns, η2=.05, and no Time×Group interaction, F(1, 38)=1.28, ns, η2=.03. These results suggest that anxiety during the first speech was unlikely to have affected participants’ speech preparation in anticipatory processing.
Self-awareness. Table 2 shows the mean scores for the overall levels of public and private self-awareness and awareness of surroundings, and for the three SSAS subscales
1Participants’ perspective, anxiety (during the speeches), negative thoughts, and performance data were also positively
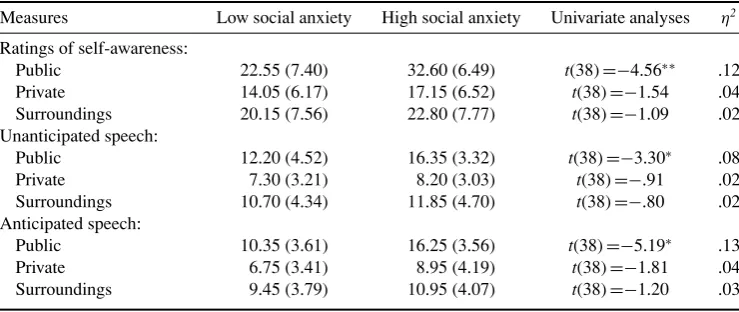
Table 2.Self-awareness means and standard deviations (in parenthesis) for high and low social anxiety groups during the unanticipated and anticipated speeches
Measures Low social anxiety High social anxiety Univariate analyses η2
Ratings of self-awareness:
Public 22.55 (7.40) 32.60 (6.49) t(38)=−4.56∗∗ .12 Private 14.05 (6.17) 17.15 (6.52) t(38)=−1.54 .04 Surroundings 20.15 (7.56) 22.80 (7.77) t(38)=−1.09 .02 Unanticipated speech:
Public 12.20 (4.52) 16.35 (3.32) t(38)=−3.30∗ .08 Private 7.30 (3.21) 8.20 (3.03) t(38)=−.91 .02 Surroundings 10.70 (4.34) 11.85 (4.70) t(38)=−.80 .02 Anticipated speech:
Public 10.35 (3.61) 16.25 (3.56) t(38)=−5.19∗ .13 Private 6.75 (3.41) 8.95 (4.19) t(38)=−1.81 .04 Surroundings 9.45 (3.79) 10.95 (4.07) t(38)=−1.20 .03
Note.η2=Effect size.∗p<.01;∗∗p<.001.
for the two speeches. The SSAS ratings were analysed using a 2×3×2 (Experimental Condition×Subscale×Group) ANOVA. Mauchly’s test indicated that the test of sphericity had been violated for the Experimental Condition×Subscale interaction, χ2 (2)=7.95, p<.05, and therefore the analyses reported below use the Greenhouse-Geisser corrected values. Although a number of main effects and two-way interactions reached statistical significance, they were of little interest because there was a significant three-way (Experimental Condition×Subscale×Group) interaction,F(1.67, 63.69)=6.14,p<.01,η2=.14. Post-hoc t-tests using a significance level ofp<.008 (after a Bonferroni adjustment of .05/6) showed that high socially anxious participants reported more overall public self-awareness, compared to low socially anxious participants. Participants did not differ in overall private self-awareness or in awareness of surroundings (see Table 2 for means and statistics).
Pairedt-tests using a significance level ofp<.008 (after a Bonferroni adjustment of .05/6) showed no differences between the two speeches in public self-awareness (High group, t(19)=.19,ns,η2=.001; Low group,t(19)=2.35,ns,η2=.12), private self-awareness (High group, t(19)=−1.00, ns, η2=.05; Low group,t(19)=1.01, ns, η2=.05) or awareness of surroundings (High group,t(19)=.98,ns,η2=.05; Low group,t(19)=1.83,ns,η2=.07), in either group.
Perspective
Perspective was measured on a +3 (observer) to −3 (field) bipolar scale. In the high and low social anxiety groups, the mean perspective ratings were (Unanticipated speech:−.15, SD=2.03;−1.20,SD=1.50) and (Anticipated speech: 1.05,SD=1.40;−1.05,SD=1.57), respectively. Perspective ratings were analysed using a 2×2 (Experimental condition× Group) mixed ANOVA. There were main effects of perspective, F(1, 38)=8.59, p<.01,
High Low
Social Anxiety Group
10
0
0
-1
Untransformed Mean
[image:9.493.73.399.72.424.2]Anticipated Speech Unanticipated Speech
Figure 1.Untransformed mean perspective taken by low and high socially anxious participants during the unanticipated and anticipated speeches
perspective in the anticipated speech, whilst, in the unanticipated speech, they gave ratings around zero, which may indicate that they were switching between observer and field perspectives. By comparison, low socially anxious participants tended to use a field perspective in both speeches.
Post hoct-tests showed a significant difference in perspective between the two groups during the anticipated speech, t(38)=−4.41, p<.001, η2=.12, but not during the unanticipated speech,t(38)=−1.85,ns,η2=.04. In the high social anxiety group, there was a significant difference in perspective between the two speeches,t(19)=−3.55,p<.01,η2=.19, but there was no difference in reported perspective in the low social anxiety group,t(19)=−.45, ns,
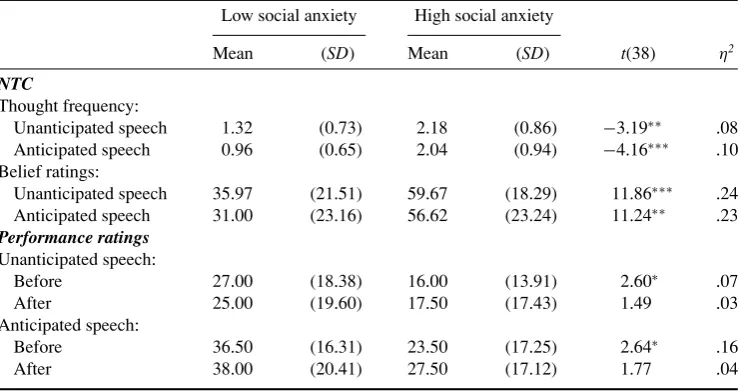
Table 3.Untransformed mean scores (with standard deviations in parentheses) on the negative thoughts checklist (NTC; frequency and belief ratings) during the unanticipated and anticipated speeches and
performance ratings before and after the two speeches
Low social anxiety High social anxiety
Mean (SD) Mean (SD) t(38) η2
NTC
Thought frequency:
Unanticipated speech 1.32 (0.73) 2.18 (0.86) −3.19∗∗ .08 Anticipated speech 0.96 (0.65) 2.04 (0.94) −4.16∗∗∗ .10 Belief ratings:
Unanticipated speech 35.97 (21.51) 59.67 (18.29) 11.86∗∗∗ .24 Anticipated speech 31.00 (23.16) 56.62 (23.24) 11.24∗∗ .23 Performance ratings
Unanticipated speech:
Before 27.00 (18.38) 16.00 (13.91) 2.60∗ .07 After 25.00 (19.60) 17.50 (17.43) 1.49 .03 Anticipated speech:
Before 36.50 (16.31) 23.50 (17.25) 2.64∗ .16 After 38.00 (20.41) 27.50 (17.12) 1.77 .04
Note.NTC, Thought frequency.∗p<.05,∗∗p<.01,∗∗∗p<.001.
Anxiety
Participants rated anxiety on a 0–100 scale during the unanticipated speech (Low group: M=54.00, SD=24.79; High group: M=71.50,SD=21.34) and anticipated speech (Low group:M=37.00,SD=23.19; High group: M=66.50,SD=23.23). Anxiety ratings were analysed using a 2×2 (Experimental condition×Group) mixed ANOVA. There were main effects of experimental condition, F(1, 38)=4.54, p<.05, η2=.10, and of group, F(1, 38)=13.37,p<.001,η2=.26. High socially anxious participants were more anxious overall (pooledM=138.00,SD=39.14) than low socially anxious participants (pooledM=91.00, SD=40.50), t(38)=−3.59,p<.001,η2=.09. There were no differences in anxiety in the two speeches in the high,t(19)=.92,ns,η2=.04 or in the low social anxiety,t(19)=1.96,ns,
η2=.10, groups. The Experimental condition×Group interaction was not significant,F(1, 38)=2.79,ns,η2=.07.
Negative thoughts
Table 3 shows the mean scores for frequency and belief on the NTC. Frequency and belief were analysed separately with 2×2 (Experimental condition×Group) mixed ANOVAs.
frequency of negative thoughts did not differ in the two speeches,t(19)=1.17,ns,η2=.06. However, participants in the low social anxiety group reported significantly more negative thoughts in the unanticipated, compared to in the anticipated speech,t(19)=3.84,p<.001,
η2=.20. The Experimental condition×Group interaction was not significant,F(1, 38)=2.80, ns,η2=.07.
Belief in negative thoughts. There were main effects of experimental condition,F(1, 38)= 7.37,p<.01,η2=.16 and of group,F(1, 38)=12.00,p<.001,η2=.24. High socially anxious participants believed their negative thoughts overall significantly more than low socially anxious participants (see Table 3). High socially anxious participants’ belief in their negative thoughts did not differ in the two speeches,t(19)=1.68,ns,η2=.06. However, in the low social anxiety group participants believed their negative thoughts significantly more in the unanticipated, compared to in the anticipated speech, t(19)=2.18, p<.05, η2=.11. The Experimental condition×Group interaction was not significant,F(1, 38)=1.35,ns,η2=.03.
Performance (predicted and actual)
Table 3 shows the mean scores for participants’ predicted and actual performance ratings for the two speeches (higher scores indicate better performance). Predicted and actual performance ratings were analysed separately with 2×2 (Experimental condition×Group) mixed ANOVAs.
Predicted performance. There were main effects of experimental condition,F(1, 38)= 7.79, p<.01, η2=.17 and of group, F(1, 38)=8.66, p<.01, η2=.17. High socially anxious participants predicted overall significantly worse performance than low socially anxious participants did (see Table 3). High socially anxious participants’ predicted ratings of performance did not differ between the two speeches, t(19)=−1.55, ns, η2=.08. In the low social anxiety group, participants predicted significantly better performance for the anticipated than for the unanticipated speech, t(19)=−3.52, p<.01, η2=.18. The Experimental condition×Group interaction was not significant,F(1, 38)=.006,ns.
Actual performance. There was a main effect of experimental condition,F(1, 38)=16.95, p<.001, η2=.31, but no main effect of group, F(1, 38)=3.37, ns, η2=.08. Ratings of performance did not differ in the two speeches in either group (see Table 3). Both groups rated their performance better in the anticipated, compared to in the unanticipated speech,t(19)=−2.81,p<.01,η2=.15 andt(19)=−3.16,p<.01,η2=.17, respectively. The Experimental condition×Group interaction was not significant,F(1, 38)=.24,ns,η2=.006.
Discussion
socially anxious individuals. However, contrary to Clark and Wells’ (1995) predictions, we found that both high and low socially anxious participants rated memories of past speeches as rather neutral and as having a moderately helpful influence on their preparation for the second speech. This latter finding might nevertheless be an artefact of giving the first speech, as when participants recollected memories of past speeches, they may have been only recollecting on the first speech they had just given. Thus, knowing they would have to give a second and similar speech, participants’ ratings might have reflected their belief that their performance on the first speech helped their performance in the subsequent speech.
Alternatively, socially anxious people might experience public speaking events as negative or unhelpful in-situ, but over time they remember these situations in a more positive or helpful manner. This “post-event processing” (PEP) may therefore serve as a potential coping strategy for coming to terms with past-perceived social failures. Indeed, Mellings and Alden (2000) found that PEP can help socially anxious individuals resolve their social fears. Nevertheless, other research shows that PEP plays a key role in maintaining anxiety in social phobia. Rachman, Gr¨uter-Andrew and Shafran (2000) found that high socially anxious individuals engaged in more PEP after anxiety provoking social situations than low socially anxious individuals did. This PEP was recurrent, intrusive, interfered with concentration and resulted in avoidance of similar social situations.
In addition, Clark and Wells (1995) seem to imply that anticipatory processing contributes to the socially phobic individual’s negative experience of the event itself. High socially anxious participants reported more overall self-awareness, more public self-awareness, more anxiety, a greater frequency of negative thoughts, and a higher belief in those thoughts, and poorer predictions of performance, compared to low socially anxious participants. These results suggest that increases in public self-awareness, anxiety, and negative thinking are a normal part of performing a speech. However, high socially anxious individuals start with higher levels of these processes than low socially anxious individuals do, and therefore the rises that occur in response to social interaction may put them above a disabling threshold. High and low social anxiety groups did not differ in overall levels of private self-awareness, awareness of surroundings, or performance during the two speeches.
Anticipatory processing affected the two groups differently in some ways during the second speech, but in other respects, it operated in the same ways during it. On the one hand, high socially anxious participants tended to use the observer perspective during the anticipated speech, but not during the unanticipated speech, where they may have been switching between observer and field perspectives. In contrast, low socially anxious participants tended to use the field perspective during both speeches. On the other hand, both high and low socially anxious participants gave better speech performance ratings after the anticipated, compared to after the unanticipated speech. Anticipatory processing had no effect on participants’ self-awareness, anxiety, frequency of, or belief in negative thoughts. Taken together, these results provide limited support for Clark and Wells’ (1995) proposal that anticipatory processing contributes to socially anxious individuals’ negative experience of the situation itself. However, they do indicate that anticipatory processing, at least before a speech, can have some potential benefits for participants’ speech performance.
as prior practice in giving the first speech, may have been responsible for better predicted and actual performance and fewer negative thoughts in the second speech. Practice effects or exposure might also account for the fact that anticipatory processing had no influence on participants’ public and private self-awareness, negative thoughts (frequency or belief), and anxiety during the second speech. Other harder to quantify factors include familiarity with surroundings and comfort with task demands.
Alternatively, the experimental social situation adopted in this study may have been too highly structured. As Rapee and Heimberg (1997) have proposed, and research has shown (e.g. Thompson and Rapee, 2002), structured situations where there are clear and explicit expectations of how to perform (e.g. a speech) are less likely to show decrements in performance in high socially anxious participants. This may be because structured situations make clear demands and limit the use of safety behaviours, compared to unstructured situations (e.g. a party). Thus, in structured situations, socially anxious individuals might believe that their performance is more likely to match a standard expected by them and/or by an audience, whereas in unstructured situations they believe the opposite. If we had used a more unstructured experimental social task (e.g. a conversation between a participant and a stooge), then we may have been more likely to find a significant effect of anticipatory processing on participants’ self-awareness, and other processes.
Nevertheless, the idea that participants may believe that anticipatory processing has some benefits is consistent both with the finding that both high and low socially anxious participants rated actual performance better during the anticipated, compared to during the unanticipated speech, and with research into PEP, where some individuals report that it is helpful (Field and Morgan, 2004; Mellings and Alden, 2000; Rachman et al., 2000). One critical point is that the nature and content of anticipatory processing is likely to affect whether it is helpful or not. If an individual preparing for a speech remains task focused, prepares some general ideas, and imagines a positive outcome, then this is likely to facilitate performance, whereas, being anxious and creating negative and unhelpful self-images is likely to impede performance. Moreover, high socially anxious individuals might focus on avoiding appearing anxious, whereas low socially anxious individuals might focus on trying to perform a good speech.
to an observer perspective after delivering the first speech. That is, the results may be an artefact of being asked to repeat a performance.
The observer perspective images reported in this study suggest there may be differences in the types and valence of images that spontaneously arise in high and low socially anxious individuals in anticipatory processing and that it would be valuable to follow up this preliminary evidence with a qualitative study that could explore the phenomenology of imagery in more detail. For example, one high socially anxious participant said, “[I] was watching myself fidget. I was cringing at the image of myself giving the speech”, while another said, “People looking at me, thinking I was stupid and unattractive.” In one description, the individual is seeing an image of self, whereas in the other the individual imagines him or herself being seen by others. This raises the question of whether observer perspective self-images usually include being seen by others in anticipatory processing, or whether the self is seen in isolation. That is, the socially anxious individual becomes the observer and therefore the judge of any observed performance. Stopa and Clark (1993) showed that socially phobic individuals had more negative self-referent thoughts (e.g. “I am being boring”) than other-referent negative thoughts (e.g. “He thinks I am boring”). Further research could therefore assess whether there is any association between negative self-referent thoughts and perspective images in social anxiety.
Two further limitations are worth noting. First, this study was based on analogue, not patient groups, and in order to generalize the findings to individuals with social phobia, the study requires replication with clinical groups. Second, a clinical measure of depression (e.g. BDI-II) was not used and therefore it is not possible to establish whether the findings of the current study are unique to social anxiety, or due to elevated levels of depression among high and low socially anxious individuals, or a mixture of both.
In sum, Clark and Wells’ (1995) model of social phobia suggests that anticipatory processing plays a key role in maintaining social anxiety. Our results provide partial support for that hypothesis. Anticipatory processing was associated with more anxiety and more negative and unhelpful self-images. Moreover, during the anticipated speech, high socially anxious participants tended to use the observer perspective, whereas low socially anxious participants did not. In addition, in some cases, participants find anticipatory processing somewhat helpful and further research is needed to confirm that this is true and to explore what type of anticipatory processing is helpful. Indeed, anticipatory processing is likely to be more helpful for a speech situation, than, say, for a conversation with a group of people. Research is needed to clarify whether this is the case.
References
Beck, A. T. and Steer, R. A.(1993).Manual of the Beck Anxiety Inventory. USA: The Psychological Corporation.
Beck, A. T., Epstein, N., Brown, G. and Steer, R. A.(1988). An inventory for measuring clinical anxiety: psychometric properties.Journal of Consulting and Clinical Psychology,56, 893–897.
Clark, D. M. and Wells, A.(1995). A cognitive model of social phobia. In R. G. Heimberg, M. R. Liebowitz, D. A. Hope and F. R. Schneier (Eds.),Social Phobia: diagnosis, assessment, and treatment (pp. 69–93). New York: Guilford Press.
Coles, M. E., Turk, C. L., Heimberg, R. G. and Fresco, D. M.(2001). Effects of varying levels of anxiety within social situations: relationship to memory perspective and attributions in social phobia. Behaviour Research and Therapy,39, 651–665.
Field, A. P. and Morgan, J.(2004). Post-event processing and the retrieval of autobiographical memories in socially anxious individuals.Journal of Anxiety Disorders,18, 647–663.
Govern, J. M. and Marsch, L. A.(2001). Development and validation of the situational self-awareness scale.Consciousness and Cognition,10, 366–378.
Hackmann, A., Surawy, C. and Clark, D. M.(1998). Seeing yourself through others’ eyes: a study of spontaneously occurring images in social phobia.Behavioural and Cognitive Psychotherapy,26, 3–12.
Hinrichsen, H. and Clark, D. M.(2003). Anticipatory processing in social anxiety: two pilot studies. Journal of Behaviour Therapy and Experimental Psychiatry,34, 205–218.
Leary, M. R.(1983). A brief version of the fear of negative evaluation scale.Personality and Social Psychology Bulletin,9, 371–375.
Mattick, R. P. and Clark, J. C.(1989).Development and Validation of Measures of Social Phobia Scrutiny Fear and Social Interaction Anxiety. Unpublished manuscript.
Mellings, T. M. B. and Alden, L. E.(2000). Cognitive processes in social anxiety: the effects of self-focus, rumination, and anticipatory processing.Behaviour Research and Therapy.38, 243–257.
Rachman, S., Gr ¨uter-Andrew, J. and Shafran, R.(2000). Post-event processing in social anxiety. Behaviour Research and Therapy,38, 611–617.
Rapee, R. M. and Heimberg, R. G.(1997). A cognitive-behavioural model of anxiety in social phobia. Behaviour, Research and Therapy,35, 741–756.
Rapee, R. M. and Lim, L.(1992). Discrepancy between self and observer ratings of performance in social phobics.Journal of Abnormal Psychology,101, 728–731.
Spurr, J. M. and Stopa, L.(2003). The observer perspective: effects on social anxiety and performance. Behaviour Research and Therapy, 41, 1009–1028.
Stopa, L. and Clark, D. M.(1993). Cognitive processes in social phobia.Behaviour Research and Therapy,31, 255–267.
Thompson, S. and Rapee, R. M.(2002). The effect of situational structure on the social performance of socially anxious and non-anxious individuals.Journal of Behaviour Therapy and Experimental Psychiatry,33, 91–102.
Vassilopoulos, S. F.(2004). Anticipatory processing in social anxiety. Behavioural and Cognitive Psychotherapy,32, 303–311.
Watson, D. and Friend, R.(1969). Measurement of social-evaluative anxiety.Journal of Consulting and Clinical Psychology,33, 448–457.
Wells, A. and Papageorgiou, C.(1998). Social phobia: effects of external attention on anxiety, negative beliefs, and perspective taking.Behaviour Therapy,29, 357–370.
Wells, A., Clark, D. M. and Ahmad, S.(1998). How do I look with my mind’s eye: perspective taking in social phobic imagery.Behaviour Research and Therapy,36, 631–634.