This is a repository copy of The importance of auditory-visual interaction in the construction of 'tranquil space'.
White Rose Research Online URL for this paper: http://eprints.whiterose.ac.uk/95126/
Version: Accepted Version
Article:
Pheasant, R.J., Fisher, M.N., Watts, G.R. et al. (2 more authors) (2010) The importance of auditory-visual interaction in the construction of 'tranquil space'. Journal of Environmental Psychology, 30 (4). pp. 501-509. ISSN 0272-4944
https://doi.org/10.1016/j.jenvp.2010.03.006
Article available under the terms of the CC-BY-NC-ND licence (https://creativecommons.org/licenses/by-nc-nd/4.0/)
Reuse
This article is distributed under the terms of the Creative Commons Attribution-NonCommercial-NoDerivs (CC BY-NC-ND) licence. This licence only allows you to download this work and share it with others as long as you credit the authors, but you can’t change the article in any way or use it commercially. More
information and the full terms of the licence here: https://creativecommons.org/licenses/
Takedown
If you consider content in White Rose Research Online to be in breach of UK law, please notify us by
The importance of auditory-visual interaction in the construction of ‘tranquil space’ Robert J Pheasant1., Mark N Fisher2., Greg R Watts1., David J Whitaker3 and Kirill V Horoshenkov1
1
School of Engineering, Design and Technology, University of Bradford, West Yorkshire, United Kingdom, BD7 1DP,
2
School of Geography, University of Leeds, West Yorkshire, United Kingdom, LS2 9JT 3
1 2 3 4 5 6 7 8 9 10 11 12 13 14 15 16 17 18 19 20 21 22 23 24 25 26 27 28 29 30 31 32 33 34 35 36 37 38 39 40 41 42 43 44 45 46 47 48 49 50 51 52 53 54 55 56 57 58 59
Abstract
In a world of sensory overload, it is becoming increasingly important to provide
environments that enable us to recover our sense of well-being. Such restorative
(„tranquil‟) environments need to comprise sufficient sensory stimulation to keep us
engaged, whilst at the same time providing opportunity for reflection and relaxation. One
essential aspect in safeguarding existing, or developing new „tranquil space‟, is
understanding the optimum relationship between the soundscape and the visual
composition of a location. This research represents a first step in understanding the
effects of audio-visual interaction on the perception of tranquillity and identifies how the
interpretation of acoustic information is an integral part of this process. By using uni and
bi-modal auditory-visual stimuli in a two stage experimental strategy, it has been
possible to measure the key components of the tranquillity construct. The findings of this
work should be of particular interest to those charged with landscape management, such
as National Park Authorities, Regional Councils, and other agencies concerned with
providing and maintaining public amenity.
Keywords: Tranquillity, Uni-modal stimuli, Bi-modal stimuli, Loudness, Soundscape. *Manuscript (without author names)
1 2 3 4 5 6 7 8 9 10 11 12 13 14 15 16 17 18 19 20 21 22 23 24 25 26 27 28 29 30 31 32 33 34 35 36 37 38 39 40 41 42 43 44 45 46 47 48 49 50 51 52 53 54 55 56 57 58 59
1. Introduction
The ability of individuals to take respite from the periods of sustained „directedattention‟ that
characterize modern living has been shown to reduce stress and contribute to the overall
feeling of well-being (Hartig, 1997). In developing their Attention Restoration Theory
(ART), Kaplan and Kaplan (1989) proposed that recovery from cognitive overload could be
best achieved by engaging with natural restorative environments, that are away from daily
distractions and have the extent and mystery that allows the imagination to wander, thereby
enabling individuals to engage effortlessly with their surroundings. The theory works on the
principle that the amount of reflection possible within such an environment depends upon the
type of cognitive engagement, i.e. fascination; that the environment holds. „Soft fascination‟
is deemed to occur when there is enough interest in the surroundings to hold attention but not
so much that it compromises the ability to reflect. In essence, soft fascination provides a
pleasing level of sensory input that involves no cognitive effort other than removing oneself
from an overcrowded mental space.
For our ancient ancestors, impaired performance, brought about by prolonged periods of
directed attention, would potentially have had fatal consequences. Therefore, in order to
survive they must have developed a series of mechanisms that enabled them to cope with
constantly living in a state of „tense arousal‟ that came from the fear of predation (Thayer,
1989). Essential to their survival would have been the ability to take periods of cognitive
respite that were facilitated by social cooperation and a reliance on the environment to
provide important safety information. Thus wide open views with lush vegetation, where
grazing herbivores could act as bio indicators of impending danger, and glassy water surface
1 2 3 4 5 6 7 8 9 10 11 12 13 14 15 16 17 18 19 20 21 22 23 24 25 26 27 28 29 30 31 32 33 34 35 36 37 38 39 40 41 42 43 44 45 46 47 48 49 50 51 52 53 54 55 56 57 58 59
been the ancient components of soft fascination that Kaplan and Kaplan (1989), identify as
underpinning modern day restorative environments.
Motivated by ART, from which they took „tranquillity‟ as a reasonable term to describe soft
fascination, Herzog and Bosely (1992) and Herzog and Barnes (1999), attempted to
distinguish empirically between the constructs of tranquillity and preference as affective
qualities of natural environments. By defining tranquillity as “how much you think this
setting is a quiet, peaceful place, a good place to get away from everyday life”, and
preference as “how much you like this setting for whatever reason”; they asked subjects to
score a range of contrasting natural environments for each target variable in response to still
images (colour slides).
Both these studies showed that despite tranquillity and preference being positively correlated
they are in fact individual constructs, thus giving an extremely useful insight into the
complex relationship that exists between sensory input (in this case a visual stimulus),
environmental schemata and scene coherence. In addition they effectively built on other
studies into the role of vision within landscape characterization, most notably that of
„prospect-refuge theory‟ (Appleton, 1975). This reductionist theory, which was developed to
explain habitat selection of early hominids, argues that a pleasurable response will be elicited
from an environment that has the appearance of satisfying survival needs. For these savannah
dwellers the perception of three-dimensional landscape features, their form, spatial
arrangements and animation, would have acted as sign stimuli of the environmental
conditions favourable or otherwise to safety and survival. In negotiating this wilderness
landscape the response to the likelihood of predation was the ability to see (prospect), whilst
1 2 3 4 5 6 7 8 9 10 11 12 13 14 15 16 17 18 19 20 21 22 23 24 25 26 27 28 29 30 31 32 33 34 35 36 37 38 39 40 41 42 43 44 45 46 47 48 49 50 51 52 53 54 55 56 57 58 59
Prospect-refuge theory was developed by Appleton as a response to those who looked at
landscape paintings and inferred human preference in terms of aesthetic quality i.e. beauty,
rather than in functional terms, where primitive stimuli were fundamental to survival. In
explanation of why an aesthetic experience of landscape is pleasurable today, Appleton
argues, “it is derived from the observer experiencing an environment favourable to the
satisfaction of their biological needs”. An assessment of landscape attributes is for most
people no longer essential to their physical survival. However, a remnant primitive reaction
must still be part of our landscape preference, even though it is now satisfying instead an
inner, restorative need for well-being that is delivered by a tranquil space.
It can be seen that significant emphasis has been placed on understanding the role of vision in
the perception of natural environments, and this is probably not surprising considering that
upon first viewing a scene its configurational coherence can be established with incredible
speed. Indeed scene information can be captured in a single glance (Oliva & Torralba, 2006)
and the gist of a scene determined in as little as 100ms (Dobel, et al, 2006). The speed of
processing of a complex natural image was tested by Thorpe et al (1996), using colour
photographs of a wide range of animals (mammals, birds, reptiles and fish), in their natural
environments, mixed with distracters that included pictures of forests, mountains, lakes,
buildings and fruit. During this experiment, subjects were shown an image for 20ms and
asked to determine whether it contained an animal or not. The electrophysiological brain
responses obtained in this study showed that a decision could be made within 150ms of the
image being seen, indicating the speed at which cognitive visual processing occurs.
However, audition, and in particular the individual components that collectively comprise the
1 2 3 4 5 6 7 8 9 10 11 12 13 14 15 16 17 18 19 20 21 22 23 24 25 26 27 28 29 30 31 32 33 34 35 36 37 38 39 40 41 42 43 44 45 46 47 48 49 50 51 52 53 54 55 56 57 58 59
that constitute the sonic environment, also significantly inform the various schemata used to
characterize differing landscape types. For our ancient ancestors whilst the need to find fresh
water for example, would frequently have been met by visual stimuli, it would have been the
case that rivers, streams, waterfalls and cascades would all have provided auditory cues that
signalled their presence (Hudson, 2000). Other indicative elements of the soundscape would
have been the characteristic sounds of potential quarry animals, or their movement heard but
unseen in complex vegetated landscapes. When the following are added to the soundscape
mix - birdsong, territorial, courtship and mating calls; along with the forewarning to take
shelter from advancing thunder storms; and the need for security on hearing the cooperative
calling between predators as they search out new prey - it becomes apparent how important
audition is in landscape perception. This interpretation is supported by the auditory reaction
times, which are 50 to 60ms faster than that of the visual modality (Ja kowski, et al, 1990).
It is known that sound can alter visual perception (Shams, et al, 2002) and that under certain
conditions areas of the brain involved in processing auditory information can be activated in
response to visual stimuli (Calvert, et al, 1997). Despite considerable research being
undertaken into audio-visual interaction (McGurk & Macdonald, 1976, Marks, 1987 and
Heron & Whitaker, 2004) and linkages between the perception of noise annoyance and
specific visual settings (Watts, et al 1999, Viollon, et al, 2002, and Zhang & Kang, 2007), the
importance of bi-modal interaction in the construction of tranquil space has not yet been
reported.
The study reported here builds on the contribution made by Herzog et al into tranquillity and
preference (1992 & 1999), and develops further the relationships first proposed in a prior
1 2 3 4 5 6 7 8 9 10 11 12 13 14 15 16 17 18 19 20 21 22 23 24 25 26 27 28 29 30 31 32 33 34 35 36 37 38 39 40 41 42 43 44 45 46 47 48 49 50 51 52 53 54 55 56 57 58 59
Tool‟ for use by engineers, planners and others charged with managing areas of public
amenity. In this report, we seek to reconcile the results of two related studies to determine the
extent to which auditory-visual interaction influences the tranquillity construct. Study 1
utilizes still images to test the hypothesis that the individual landscape components contained
within the visual scene, directly influence the uni-modal perception of tranquillity. Study 2
seeks to expand on this, by testing the hypothesis that landscape quality evaluations (i.e.
tranquillity assessments), made in response to a uni-modal stimulus, can become modified in
the presence of bi-modal information.
2. Study 1
2.1. Participants
The 58 females and 44 males (16 – 80 years, average age 37.6 years ± 17.0 years), that took
part in Study 1 were recruited from students and staff at the University of Bradford, and from
members of the public visiting the Brockhole Visitors‟ Centre in the Lake District National
Park. The recruited volunteers were representative in age, gender and ethnicity of British
society and not subject to any set level of academic achievement. No remuneration or study
credits were awarded to any of the subjects taking part in the project. In addition, because it
was suspected that geographic and cultural variations could influence the perception of
tranquillity, only British nationals were used in the study.
2.2 Materials and Settings
The images chosen for this exercise were drawn from a database of 360 photographs that
were taken from across England during the summer of 2005. The images were captured using
a Canon EOS 50E SLR camera that was loaded with 200 ASA colour film, and were
1 2 3 4 5 6 7 8 9 10 11 12 13 14 15 16 17 18 19 20 21 22 23 24 25 26 27 28 29 30 31 32 33 34 35 36 37 38 39 40 41 42 43 44 45 46 47 48 49 50 51 52 53 54 55 56 57 58 59
landscapes were covered, 20 colour images were selected from each of the following five
generic landscape categories: mountainous and wilderness, coastal, parks and gardens, urban
and rural. It is acknowledged, due to the highly modified nature of English landscapes, that
some of the locations could fall into more than one group, for example mountainous/rural,
urban/coastal or urban/parks and gardens. Because of this, the generic classifications, whilst
typifying groupings along a continuum of easily readable scenes, cannot be taken as
definitive or mutually exclusive. There were however some distinct attributes within the
scenes that could be quantified.
Whilst the quality of the photograph was considered during selection for inclusion in each
category, the perceived level of tranquillity was not. Indeed, it was never intended to present
only the quietest and „greenest‟ areas of England, where the notion of tranquillity is least
contested, but to include a broad spectrum of landscapes that were identifiable, if not familiar
to, all of the subjects taking part in the study. The chosen angle of view was generally
suitable for taking typical landscape pictures, i.e. telephoto shots were avoided, and the
photographs were taken from a position of rest, which was generally seated with the camera
at eye height (i.e. approximately 1.5m above ground level).
2.3 Measures
Each of the 100 photographs was scored according to the ranked position allocated to it by
the subjects, with a value of 100 being attributed to the most tranquil scene and decreasing
values awarded to the remaining 99 images. The least tranquil scene scored 1. These values
were summed and statistically tested for agreement using Kendall‟s coefficient of
1 2 3 4 5 6 7 8 9 10 11 12 13 14 15 16 17 18 19 20 21 22 23 24 25 26 27 28 29 30 31 32 33 34 35 36 37 38 39 40 41 42 43 44 45 46 47 48 49 50 51 52 53 54 55 56 57 58 59
the resultant correlation was statistically significant. Table 1 lists the mean score and standard
deviation of each of the 100 images against their ranked position.
Objective measures of the percentage of natural and anthropocentric features contained
within each scene were also established. Natural features were deemed to include flora,
fauna, geological features (including dry stone walls which, for many, are an intrinsic part of
the English countryside) and water. Although it was recognised that the sky contains
important information about the suitability of an environment for rest and relaxation, the
percentage contained within each image was not included. This decision was taken as it was
considered that very small deviations in the camera angle could bias the overall percentage of
natural features by introducing larger tracts of sky than would not normally be within view.
In addition, weather conditions were for the most part, uniformly sunny, therefore little
differentiation in environmental quality could be gleaned from the sky. Anthropocentric
features included people, the space that they occupied, and all manmade objects. Each of the
individual components that comprised the natural and anthropocentric features categories
were statistically tested against the summed value corresponding to each ranked position
(dependent variable), using multiple linear regression analysis.
The percentage value of each component of the visual scene was calculated by overlaying a
10 x 10 grid onto each image and counting the amount of space occupied. Where more than
one landscape component occupied the same 1% of space a smaller 4 x 4 grid was used, thus
enabling the values to be determined to within <0.1% of overall space.
1 2 3 4 5 6 7 8 9 10 11 12 13 14 15 16 17 18 19 20 21 22 23 24 25 26 27 28 29 30 31 32 33 34 35 36 37 38 39 40 41 42 43 44 45 46 47 48 49 50 51 52 53 54 55 56 57 58 59
2.4. Procedure
For each of the participants the 100 photographs were laid out on a table in random order and
the subjects asked to hand the image that they perceived to be most tranquil to the research
assistant, who recorded its unique number against its ranked position. The subjects were left
to decide upon the value judgments they made, however, in order to give them a benchmark
from which to work they were told that for the purpose of the exercise they should consider a
tranquil space to be “a quiet peaceful place, a good place to get away from the demands of
everyday life‟. The subjects were also told that the images they were assessing represented
„steady state‟, i.e. they would never change and that they were to make their assessments
based solely on the visual information given. On average, it took the subjects 30 minutes to
complete the task.
2.5. Results
The combined use of Kendall‟s Coefficient of Concordance and x2 showed that the degree of
agreement between the subjects ranking the 100 photographs was highly significant (p-
< .01). This enabled the null hypothesis, i.e. that the rankings were unrelated to each other, to
be rejected, thereby allowing a wider analysis of the photographs‟ ranked position and its
visual composition to take place. This was achieved by using multiple linear regression
analysis to test the relationship between the mean numerical value attributed to each image
(i.e. the dependent variable) and the percentage of space occupied by water, flora, geological
features and people, as independent variables. The percentage of space occupied by fauna
was also considered. However, English landscapes are for the most part agricultural and the
photographs utilized in this study were taken soon after a nationwide cull of livestock,
1 2 3 4 5 6 7 8 9 10 11 12 13 14 15 16 17 18 19 20 21 22 23 24 25 26 27 28 29 30 31 32 33 34 35 36 37 38 39 40 41 42 43 44 45 46 47 48 49 50 51 52 53 54 55 56 57 58 59
terms of fauna; therefore, this variable was omitted from the analysis due to the very small
sample size.
Results of the regression analysis are contained in Table 2. The perception of tranquillity as
represented in the photographic scenes was significantly influenced in a positive way by the
percentage of water, flora, and geological features contained therein, whereas it was
negatively influenced by the percentage of space occupied by people. The significance of
these results is supported by the relatively small confidence intervals, which enabled the null
hypothesis to be rejected at the 95% level of significance. An identical pattern of results was
obtained using a non-parametric measure of correlation between the dependent variable and
these independent variables (Spearman rank correlation).
2.6. Discussion
The results of the photographic ranking exercise supported the hypothesis that the individual
landscape components contained within the visual scene directly influence the uni-modal
perception of tranquillity. These components include physical aspects of the landscape that
can be objectively measured, such as the percentage of natural and manmade features
contained within a scene, or the amount of space occupied by people. However, landscape
characterization, and in particular the construction of „tranquil space‟, is a complex process
that draws upon a wide range of sensory inputs that cannot be adequately provided for by still
photography alone. Although both smell and touch supply important environmental cues,
auditory information provides vital contextual detail about an environment‟s quality and
suitability for purpose. Therefore, the extent to which auditory and visual information
1 2 3 4 5 6 7 8 9 10 11 12 13 14 15 16 17 18 19 20 21 22 23 24 25 26 27 28 29 30 31 32 33 34 35 36 37 38 39 40 41 42 43 44 45 46 47 48 49 50 51 52 53 54 55 56 57 58 59
3. Study 2
3.1. Participants
Forty-four subjects (20 male and 24 female, average age 35 ±14.1 years), took part in Study
2. Approximately half of these had taken part in Study 1 ten months earlier and the rest were
drawn from staff and students of the University of Bradford‟s School of Engineering, Design
and Technology. Familiarity with the stimuli being presented to the subjects that had
participated in the photographic ranking exercise was not considered problematic, given that
each of the sweeping video clips to be used in Study 2 contained 800 frames of dynamic
information, in contrast to the 1 frame of still data presented in each of the photographs used
in Study 1. The two sets of stimuli were therefore considered sufficiently different. Each
subject received a £10 gift voucher for his or her contribution to the research, which lasted
approximately two hours. The sample of participants was once again demographically
representative in gender, age and ethnicity and only British nationals took part.
3.2. Materials and Settings
As an unbiased method of identifying locations for use in Study 2, those ranked at ten
percentile intervals during the photographic ranking exercise of Study 1 were chosen. These
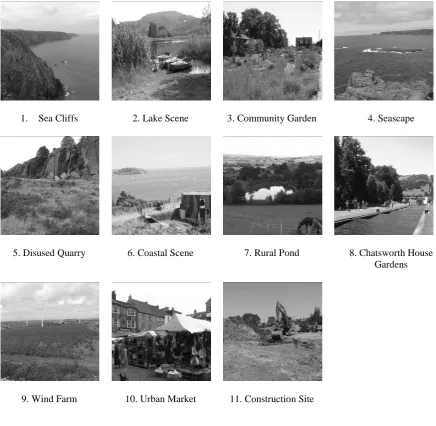
10 locations, along with the location assessed as being „most tranquil‟, gave 11 contrasting
environments that were revisited and audio-visual data (video footage), recorded using the
equipment and calibration procedure described in Pheasant et al (2008). A central view and
generic description of each location is provided in Figure 1.
Where possible the footage was taken from exactly the same place as its corresponding still
image. Each video clip lasted for 32 seconds, and comprised an 8 second sweep from the left
1 2 3 4 5 6 7 8 9 10 11 12 13 14 15 16 17 18 19 20 21 22 23 24 25 26 27 28 29 30 31 32 33 34 35 36 37 38 39 40 41 42 43 44 45 46 47 48 49 50 51 52 53 54 55 56 57 58 59
before completing the recording arc by sweeping right for a further 8 seconds. During video
capture every attempt was made to include as much acoustic context as possible within the
footage, and in order to preserve integrity of the audio data it remained unchanged throughout
the editing process. The 32-second exposure time was determined during a pilot study, in
which 12 subjects made „tranquillity assessments‟ of a location based on repeated exposure to
a video clip over escalating time scales (2, 4, 8, 16, 32 and 64 seconds). The mean point at
which the assessments of perceived tranquillity remained constant was identified as 32
seconds and this was incorporated into the study.
The captured video data was edited using Adobe Premier 6.5 software in order to provide
32-second audio only, video only and combined audio-video data cuts. Each data stream was
placed in a randomised order unique to the pair of subjects it was being presented to, and
stored on a DVD for use in the psycho-acoustic suite.
3.3. Measures
Subjects used a scale of 0 – 10 (0 = not at all tranquil and 10 = very tranquil) to rate the
perceived tranquillity of each of the 11 locations, under three experimental conditions
(audio-only, video only and combined audio-visual). The data were presented to each subject four
times per experimental condition (i.e. 44 exposures per condition) in a balanced design
intended to reduce order effects. To enable the subjects to become accustomed to both the
environments being presented and the assessment process, tranquillity estimations for the first
11 tracks in each experimental condition were ignored, the mean tranquillity ratings being
1 2 3 4 5 6 7 8 9 10 11 12 13 14 15 16 17 18 19 20 21 22 23 24 25 26 27 28 29 30 31 32 33 34 35 36 37 38 39 40 41 42 43 44 45 46 47 48 49 50 51 52 53 54 55 56 57 58 59
For the last set of repeat data in each condition (i.e. tracks 34-44), the subjects were asked to
assess how loud they perceived each of the five generic soundscape components listed in
Table 3 to be. Loudness was assessed using the following scale: 0 = sound source not present,
1 = quiet, 2 = moderately quiet, 3 = moderately loud and 4 = loud. An important aspect of the
loudness estimation was obtaining valid baseline data. This was achieved by playing the
subjects a 1 kHz calibration tone and asking them to assess how loud they perceived it to be.
The tone was played via calibrated headphones at volumes equating to the highest and lowest
sound sources that the subjects would be exposed to throughout the experiment. This
procedure took place prior to commencing the experiment and again at the end, since it is
known that the perceived magnitude of an auditory stimulus may decrease as the subject
adapts to the sound source, and that conversely the absolute threshold measured after
exposure to sounds may increase due to fatigue (Neuhoff, 2004). A comparison of both sets
of results obtained from the loudness assessments of the calibration tone showed no evidence
that the subjects had experienced either adaptation or fatigue. The results were therefore used
to determine the subjective loudness limits of the objective dynamic range covered by the
recorded sounds and scale accurately the bounds of the loudness assessment.
The mean percentage of natural features for each clip was determined by taking the average
of three measurements, using the same measuring technique as Study 1. The first was taken at
the start of the video (frame 1), the second at the central position (frame 400) and the third at
the right hand limit of the view (frame 800). This allowed for the whole composition of the
environment to be taken into account. Values for the noise indices LAeq and LAmax, were
1 2 3 4 5 6 7 8 9 10 11 12 13 14 15 16 17 18 19 20 21 22 23 24 25 26 27 28 29 30 31 32 33 34 35 36 37 38 39 40 41 42 43 44 45 46 47 48 49 50 51 52 53 54 55 56 57 58 59
The raw values allocated by the 44 subjects to each of the 11 locations in each of the 3
experimental conditions, were used to determine the dependent variable „mean tranquillity
rating‟. This was used in the regression analysis (Microsoft Excel 2007 and SPSS 16), along
with the independent variables: weighted mean loudness, percentage of natural features
present at each location (excluding sky), equivalent A-weighted continuous sound pressure
level (LAeq) and maximum sound pressure level (LAmax). However, when conducting
regression analysis of the uni-modal results only those independent variables that could
reasonably have influenced the perception of tranquillity were tested against the dependent
variable (mean tranquillity rating). In the visual only condition relationships between the
visual components of the scene and the mean tranquillity ratings were established, and in the
audio-only condition, the subjective assessments of loudness, along with the noise indices
LAmax or LAeq were used as independent variables. In the bi-modal audio-visual condition, all
visual and acoustic variables were tested against the mean tranquillity rating. This process
was employed to identify the extent to which both the individual and collective auditory and
visual components of each location influenced the tranquillity construct.
In an attempt to establish whether the uni-modal perception of tranquillity became moderated
once bi-modal stimuli were presented, a repeated measures ANOVA was also conducted.
This utilized the mean tranquillity rating awarded by each subject to each location (total 484
responses), for all three experimental conditions, the results of which were further validated
by a post-hoc Scheffe test. In addition, a repeated measures analysis of variance was carried
out using the bi-modal mean tranquillity ratings and the mean of the uni-modal estimates, in
order to determine the extent to which the bi-modal percept of tranquillity was biased towards
1 2 3 4 5 6 7 8 9 10 11 12 13 14 15 16 17 18 19 20 21 22 23 24 25 26 27 28 29 30 31 32 33 34 35 36 37 38 39 40 41 42 43 44 45 46 47 48 49 50 51 52 53 54 55 56 57 58 59
3.4. Procedure
The study was conducted inside a psychoacoustic suite where subjects wearing Technics
RP-295 headphones were seated in pairs 2m from the centre of a Pioneer PDP-506XDE plasma
screen. A briefing was given that explained the experiment and described how the response
sheets for both the tranquillity and loudness assessments should be completed. This
information was also provided in printed form. The subjects were advised that for the purpose
of the research a tranquil environment was one that they considered to be a quiet, peaceful
and attractive place to be, i.e. a place to get away from „everyday life‟ (Herzog and Barnes,
1999). Exposure to each location lasted 32 seconds per experimental condition, followed by a
6-second break in order that the subjective assessments could be recorded.
For the first 22 subjects the data was presented in the order: audio only, video only and
combined audio-visual, and for the remaining 22 subjects the uni-modal sequence was
switched and the data presented in the order video only, audio only and combined
audio-visual. Analysis of the results showed that the order in which the uni-modal data was
presented had no significant effect on the mean tranquillity ratings.
3.5. Results
The mean tranquillity ratings and associated standard deviations in each experimental
condition for the 11 locations used in Study 2 are shown in Table 4. In all but two locations,
subjects rated the environments higher in terms of perceived tranquillity when responding to
visual only stimuli, than they did when responding to audio only data. There is an overall
tendency for audio-visual tranquillity assessments to fall in between the two uni-modal
1 2 3 4 5 6 7 8 9 10 11 12 13 14 15 16 17 18 19 20 21 22 23 24 25 26 27 28 29 30 31 32 33 34 35 36 37 38 39 40 41 42 43 44 45 46 47 48 49 50 51 52 53 54 55 56 57 58 59
3.5.1 Results of the video only experimental condition
When responding to visual only stimuli the subjects once again drew upon the individual
components of the landscape to construct their perception of tranquillity. Interestingly the
independent variables: percentage of water, flora and geological features contained within the
scene, significantly predicted the mean tranquillity ratings (water = .51, t = 2.68, p< .05,
flora = .84, t = 4.40, p<.01, geological features = .60, t = 3.70, p<.05). R2 = .85, F(4, 6) =
9.14, p< .05. However, this was not the case for the percentage of space occupied by people
within the scene, variable ( = .06, t = .40, p> .05). This is in contrast to Study 1 and it may
well be due to the differing sample sizes between the two studies. In Study 1, forty-three
scenes contained people compared to only six in Study 2. While this approximates to half of
the scenes in both cases, the range in number of people contained in the scenes of Study 1 (1
– 200+) compared to Study 2 (2 - 65), were sufficiently varied to establish a relationship. An
alternative explanation could be that the length and dynamic nature of the video data allowed
the subjects to apply a greater degree of configurational coherence to the scene, than they
were able to do when responding to still images. However, testing this hypothesis fell outside
the scope of this study.
3.5.2 Results of the audio only experimental condition
Within the audio-only experimental condition, two models were tested to establish which
components of the soundscape the subjects utilized to make their tranquillity assessments.
The first model included the objectively measured maximum A-weighted sound pressure
level (LAmax), and the subjectively derived loudness values, and the second model the
equivalent continuous A-weighted sound pressure level (LAeq) plus the loudness values, as
independent variables. In both models, the perceived loudness of mechanical sounds (PLM)
1 2 3 4 5 6 7 8 9 10 11 12 13 14 15 16 17 18 19 20 21 22 23 24 25 26 27 28 29 30 31 32 33 34 35 36 37 38 39 40 41 42 43 44 45 46 47 48 49 50 51 52 53 54 55 56 57 58 59
the dependent variable „mean tranquillity rating‟, to a similar extent. Using the multiple
regression analysis results from model one as an example, it can be seen that biological
sounds had a positive influence on tranquillity ( = .56, t = 5.9, p<.01), whereas mechanical
sounds had a negative influence ( = .32, t = -3.8, p<.01), R2 = .97, F(3,7) = 77.37, p<.001.
None of the other five generic soundscape components listed in Table 3 was shown to have a
significant effect in either model.
The mean tranquillity ratings (TR), for each model that includes PLM and PLB are defined
by equations (1) and (2):
TR = 9.99 – 0.93LAmax – 0.45 (PLM) + 1.16(PLB) (1)
TR = 7.74 – 0.67LAeq– 0.53(PLM) + 1.19(PLB) (2)
Both models were statistically significant at the 95% confidence level and were supported by
appropriate confidence intervals.
3.5.3 Results of the combined audio-visual experimental condition
Table 5 shows the results of the multiple linear regression analysis for the loudness
assessments in the combined audio-visual experimental condition. It can be seen from the
confidence intervals and their associated significance values, that the only elements of the
soundscape that significantly influenced the tranquillity construct were biological sounds and
sounds of the weather. For sounds produced by human, mechanical and water sources the
confidence intervals show that the null hypothesis, i.e. that these sounds do not influence the
1 2 3 4 5 6 7 8 9 10 11 12 13 14 15 16 17 18 19 20 21 22 23 24 25 26 27 28 29 30 31 32 33 34 35 36 37 38 39 40 41 42 43 44 45 46 47 48 49 50 51 52 53 54 55 56 57 58 59
the findings of previous studies (Watts et al, 2009) and further debate is given to this aspect
in Section 3.6.
When tested using stepwise linear regression analysis the loudness of the individual
soundscape components were not strong enough on their own to influence significantly the
mean tranquillity rating. Instead, the equivalent continuous sound pressure level (LAeq), which
incorporates all aspects of the soundscape, predominated. A similar result was given for the
visual modality, where the overall mean percentage of natural features (NF), rather than any
of the individual sub-components of the visual scene, correlated significantly with the mean
tranquillity rating. Table 6 summaries the results of the regression analysis and shows the
extent to which bi-modal stimuli contribute to the tranquillity construct. Here it can be seen
that both LAeq and NF are significant predictors of mean tranquillity and that of the two
variables the acoustic measure negatively influences the perception of tranquillity, whilst the
visual measure has a positive influence. In both cases, the significance values are supported
by appropriate confidence intervals. When LAmax for all 11 locations was tested against the
percentage of natural features, the result did not reach the required level of significance.
3.5.4 The extent to which bi-modal stimuli ‘moderate’ the tranquillity construct
In order to determine whether the bi-modal perception of tranquillity across all observers and
locations was significantly different to the uni-modal percept, a repeated measures analysis of
variance (ANOVA) was carried out. This revealed a highly significant effect of observation
type on tranquillity rating F(2,996) = 181.69, p<.001). Post-hoc analysis (Scheffé), revealed
that all three observation types (audio, visual and bi-modal) were significantly different to
one another (p<.001). Given this, we now ask whether the data conform to perhaps the
1 2 3 4 5 6 7 8 9 10 11 12 13 14 15 16 17 18 19 20 21 22 23 24 25 26 27 28 29 30 31 32 33 34 35 36 37 38 39 40 41 42 43 44 45 46 47 48 49 50 51 52 53 54 55 56 57 58 59
estimates. The observation that audio-visual tranquillity estimates tend to lie between the two
uni-modal estimates (Table 4) may be taken as support for this view. However, closer
inspection reveals that the situation is not that straightforward. Whilst linear regression shows
that the mean of the uni-modal estimate explains a significant proportion of the variance in
the combined tranquillity estimate (R2 = .98, p<.01), significant departures from a simple
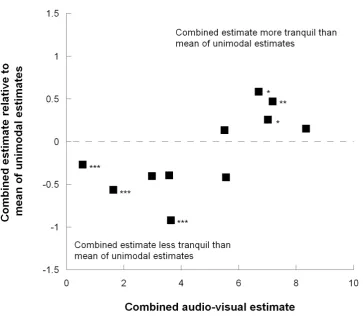
average exist. Figure 2 shows the difference between the combined tranquillity estimate and
the mean of the uni-modal ratings, plotted against the combined estimate. The dashed line
indicates perfect agreement, whilst data points lying above this line indicate that bi-modal
tranquillity was rated higher than the average of the uni-modal estimates would suggest (and
vice versa for data lying below the dashed line). A repeated measures analysis of variance
(ANOVA), a summary of which is contained in Table 7, was carried using data from
individual participants for each of the 11 locations in order to establish which scenes involved
a bi-modal estimate significantly different to the average of uni-modal estimates. These data
points are marked in Figure 2 with asterisks according to the level of significance attained (*,
p<.05; **, p<.01; ***, p<.001). Interestingly, scenes which generated a low rating of
bi-modal tranquillity (<5) tended to be rated as less tranquil than the average of their uni-bi-modal
components, and vice versa for the tranquil scenes. This suggests that the combined percept
resulting from a tranquil scene is enhanced by the more tranquil of the two constituent
sensory inputs. Conversely, for a non-tranquil scene, perception tends to be „captured‟ by the
less tranquil of the two components. In our scenes, this component tended to represent a low
audio tranquillity rating resulting from high levels of mechanical noise, sometimes
incongruous to the tranquil visual scene.
1 2 3 4 5 6 7 8 9 10 11 12 13 14 15 16 17 18 19 20 21 22 23 24 25 26 27 28 29 30 31 32 33 34 35 36 37 38 39 40 41 42 43 44 45 46 47 48 49 50 51 52 53 54 55 56 57 58 59
The past decade has witnessed a growing shift of emphasis away from the study of the senses
in isolation towards an understanding of how the human brain coordinates the array of
information provided by the different sensory modalities. The results obtained during Study 2
have shown how important auditory and visual stimuli are in landscape characterization, and
have supported the hypothesis that landscape quality evaluations (i.e. tranquillity
assessments) made in response to a uni-modal stimulus can become modified in the presence
of bi-modal information. In the same way that one sense has been shown to dominate or
„capture‟ another sense and thereby determine perception in laboratory experiments (McGurk
& Macdonald, 1976; Shams et al., 2002; Heron et al., 2004), so the auditory soundscape or
visual landscape have the potential to influence the perception of tranquillity in a real,
multisensory environment.
When making their tranquillity assessments based on uni-modal sensory inputs, the subjects
drew upon a number of key landscape and soundscape characteristics. For example, in the
visual-only experimental condition the percentage of water, flora and geological features
present within a scene, positively influenced how tranquil it was perceived to be. This
corresponded with the findings of Study 1 and supports further the hypothesis that the
individual landscape components contained within the visual scene, directly influence the
uni-modal perception of tranquillity. In the audio-only experimental condition, the perceived
loudness of biological sounds enhanced the perception of tranquillity and the perceived
loudness of mechanical sounds detracted from it. However, although the results obtained
from Study 2 show how important the presence of water within the visual scene is to the
perception of tranquillity, the same positive influence was not identified when the loudness of
water sounds was analysed. No definitive explanation can be given for this apparent
1 2 3 4 5 6 7 8 9 10 11 12 13 14 15 16 17 18 19 20 21 22 23 24 25 26 27 28 29 30 31 32 33 34 35 36 37 38 39 40 41 42 43 44 45 46 47 48 49 50 51 52 53 54 55 56 57 58 59
continuous sound pressure level (i.e. the ambient noise), for the one location where the
soundscape was dominated by water noise (Chatsworth House), was 79 dB(A). This
exceptionally high value, which is 7dB(A) greater than the level recorded at the construction
site, can be attributed to the fact that the data was recorded 1m away from an ornamental
water feature, rather than 12m away, which is where many of the tourists that visit each year
tend to sit and enjoy the view. Subsequent measurements have shown the LAeq values at this
distance to be 18 dB(A) lower than those used in the experiment.
It is known from the study into the auditory effects of increased stream flow on recreation
reported by Brown and Taylor (1992), that the sounds of water are considered to be pleasant
up to a certain level, beyond which their quality drops rapidly. However, it is not clear within
the literature exactly what this level is. In fact experiments involving water sounds replayed
at values below 60 dB(A), indicated both positive and negative impacts on perceived
tranquillity, with the direction of change appearing to be dependent on whether the sounds
were perceived as “natural” or not, (Wattsa et al, 2009).
Unlike in the uni-modal experimental condition (including Study 1), none of the component
parts of the visual or acoustic scene on their own significantly influenced the tranquillity
construct when bi-modal stimuli were presented and scene coherence, (context) was
established. In the case of the visual data, the grouped variable „percentage of natural
features‟ correlated well with the perception of tranquil space, as did the equivalent
continuous sound pressure level (LAeq) for the auditory inputs. It should be noted that these
findings relate to the results of the stepwise linear regression analysis that looked for
associations across all 11 locations in the bi-modal experimental condition, rather than
1 2 3 4 5 6 7 8 9 10 11 12 13 14 15 16 17 18 19 20 21 22 23 24 25 26 27 28 29 30 31 32 33 34 35 36 37 38 39 40 41 42 43 44 45 46 47 48 49 50 51 52 53 54 55 56 57 58 59
features. An extended study using a significantly larger dataset is currently being undertaken
to test this relationship.
An unforeseen finding of Study 1 was the negative impact that the presence of people within
the visual scene had on the construction of tranquil space. This suggests that solitude is as
important for the tranquillity construct as it is for the restorative potential of the wilderness
experience (Hollenhorst, et al, 1994). That this was not identified as significant in Study 2
may be due to the inadequacy of the dataset to allow that determination. It would therefore be
an important factor in experimental design for follow on studies.
4. Conclusions
The present work addresses the contribution of vision and audition to the perceptive reality of
the tranquillity construct and reveals lessons for identifying the attributes of tranquil space.
The stimuli presented to subjects were taken from real locations rather than synthesized
sounds and light sources.
Our results challenge again the notion of uni-modal perceptual processing, indicating that the
perception of tranquillity represents a complex interplay between the visual and auditory
activity evoked by everyday scenes. Indeed, it is important that those involved in soundscape
research, with their concentration on one modality, i.e. audition, begin to develop as a
minimum, a bi-modal approach to environmental characterization.
We contend that the work presented here on bi-modal stimuli is likely to be a first measure of
the reality of soft fascination that restorative environments afford (Herzog, et al, 2003).
1 2 3 4 5 6 7 8 9 10 11 12 13 14 15 16 17 18 19 20 21 22 23 24 25 26 27 28 29 30 31 32 33 34 35 36 37 38 39 40 41 42 43 44 45 46 47 48 49 50 51 52 53 54 55 56 57 58 59
findings on bi-modal interaction by providing insights into the physiological basis for this
interaction between modalities (Wattsb, et al 2009). It has been demonstrated for the first time
that significant differences exist in effective connectivity between the auditory cortex and the
medial prefrontal cortex under tranquil and non-tranquil conditions. Specifically the medial
prefrontal cortex receives significantly enhanced contribution from the auditory cortex under
tranquil visual conditions compared with non-tranquil visual conditions (Wattsb, et al., 2009).
Such results indicate strongly that bi-modal stimuli are essential for a full characterization of
tranquil space, and that even when a soundscape is being characterized the visual scene is
likely to be an important modifying factor in auditory perception.
5. References
Appleton, J. (1975). The Experience of Landscape. London: Wiley.
Brown, T. C., & Taylor, J. G. (1992). Assessing the direct effects of stream flow on
recreation: A literature review. Journal of the American Water Resources Association .27,
979 – 989.
Calvert, G. A., Bullmore, E. T., Brammer, M. J., Campbell, R., Williams, S. C., McGuire, P.
K., Woodruff, P. W., Iversen, S. D. & David, A. S. (1997). Activation of auditory cortex
during silent lipreading. Science 27, 593-596.
Coss, R.G. (1990) All that glistens: Water connotations in surface finishes, Ecological
Psychology 2, 367-380
Dobel, C. & Gumnoir, H. (2006). Describing scenes hardly seen. Acta Psychologica 125,
129 – 143.
Hartig, T., Kaiser, F. G. & Bowler, P. A. (1997). Further development of a measure of
perceived environmental restorativeness. Working paper 5, Institute for Housing Research,
1 2 3 4 5 6 7 8 9 10 11 12 13 14 15 16 17 18 19 20 21 22 23 24 25 26 27 28 29 30 31 32 33 34 35 36 37 38 39 40 41 42 43 44 45 46 47 48 49 50 51 52 53 54 55 56 57 58 59
Heron, J., Whitaker, D. & McGraw, P. (2004). Sensory uncertainty governs the extent of
audio-visual interaction. Vision Research 44, 3119-3130.
Herzog, T. R. & Bosley, P. J. (1992). Tranquillity and preference as affective qualities of
natural environments. Journal of Environmental Psychology 12, 115-127.
Herzog, T. R. & Barnes, G. J. (1999). Tranquillity and preference revisited. Journal of
Environmental Psychology 19, 171-18.
Herzog, T. R., Maguire, C. P. & Nebel, M. B. (2003). Assessing the restorative components
of environments. Journal of Environmental Psychology 23, 157-170.
Hollenhorst, S., Watson, A & Frank, EIII. (1994). The capacity to be alone: Wilderness
solitude and the growth of the self. In: Hindee, J. and Martin, V. Eds. International
wilderness allocation, management and research. Fort Collins, CO: International wilderness
leadership (WILD) Foundation: 234 – 239.
Hudson, B. J. (2000). The experience of waterfalls. Australian Geographical Studies 38,
71-84.
Ja kowski, P., Jaroszyk, F., & Hojan-Jezierska, D. (1990). Temporal-order judgement and
reaction time for stimuli of different modalities. Psychol Research 52, 35-38.
Kaplan, R. & Kaplan, S. (1989). The Experience of Nature. New York: Cambridge
University Press.
Marks, L. E. (1987). Cross modal similarity: Auditory-visual interactions in speeded
discrimination. Journal of Environmental Psychology 13 (3), 384 – 394.
McGurk, H. & Macdonald, J. (1976). Hearing lips and seeing voices. Nature 264, 746-748.
Neuhoff, J. G. (2004). Ecological Psychoacoustics. Elsevier Academic Press.
Oliva, A. & Torralba, A. (2006). Building the gist of a scene: The role of global image
1 2 3 4 5 6 7 8 9 10 11 12 13 14 15 16 17 18 19 20 21 22 23 24 25 26 27 28 29 30 31 32 33 34 35 36 37 38 39 40 41 42 43 44 45 46 47 48 49 50 51 52 53 54 55 56 57 58 59
Pheasant, R. J., Horoshenkov, K. V., Watts, G. R. & Barrett, B. T. (2008). The acoustic and
visual factors influencing the construction of tranquil space in urban and rural environments:
Tranquil spaces-quiet places. Journal of the Acoustical Society of America 123, 1446-1457.
Schafer, R. M. (1977). The Soundscape: Our sonic environment and the tuning of the world.
Destiny Books Rochester, Vermont.
Shams, L., Kanutani, S. & Shimojo, S. (2002). Visual illusion induced by sound. Journal of
Cognitive Brain Research 14, 147 – 152.
Siegel, S. & Castellan, Jr. N. J. (1988). Non-parametric statistics for the behavioural
sciences, 2nd edition. London: McGraw-Hill.
Thayer, R.E. (1989). The Biopsychology of mood and arousal. New York: Oxford University Press.
Thorpe, S., Fize, D. & Marlot, C. (1996). Speed of processing in the human visual system.
Nature 381, 520 – 522.
Viollon, S., Lavandier, C. & Drake, C. (2002). Influence of visual settings on sound ratings in
an urban environment. Applied Acoustics 63, 493-511.
Wattsa, G. R., Pheasant, R. J., Horoshenkov, K. V. & Ragonesi, L. (2009). Measurement of
subjective assessment of water generated sounds. Acta Acustica united with Acustica 95,
(accepted for publication).
Wattsb, G. R., Hunter, M. D., Douglas, M., Pheasant, R. J., Farrow, T. F. D., Wilkinson, I. D.,
Kang, J., Horoshenkov, K. V. & Woodruff, P. W. (2009). The use of fMRI techniques to
investigate the perception of tranquility. Proceedings of Internoise September 2009, Ottowa,
Canada.
Watts, G. R., Chinn, L. & Godfrey, N. (1999). The effects of vegetation on the perception of
1 2 3 4 5 6 7 8 9 10 11 12 13 14 15 16 17 18 19 20 21 22 23 24 25 26 27 28 29 30 31 32 33 34 35 36 37 38 39 40 41 42 43 44 45 46 47 48 49 50 51 52 53 54 55 56 57 58 59
Zhang, M. & Kang, J. (2007). Towards the evaluation, description and creation of
soundscapes in urban open areas. Environment and Planning B: Planning and Design 34, 68
Table 1.
Study 1 data showing mean score and standard deviation (SD) against ranked position for each
of the 100 images.
Rank Mean SD Rank Mean SD Rank Mean SD Rank Mean SD
1 82.91 18.78 26 65.52 22.52 51 49.74 22.00 76 39.33 26.21
2 82.58 17.22 27 65.24 24.25 52 48.55 24.60 77 37.64 22.86
3 81.68 19.34 28 63.94 27.50 53 48.47 20.33 78 37.12 19.58
4 79.08 19.14 29 63.72 21.50 54 48.02 20.74 79 36.82 21.43
5 78.75 18.94 30 63.36 22.35 55 47.84 20.64 80 35.69 21.67
6 77.90 16.23 31 61.06 21.98 56 47.80 18.43 81 33.55 18.61
7 77.01 20.50 32 60.68 20.41 57 47.37 23.41 82 33.20 18.10
8 76.36 20.17 33 60.28 23.81 58 47.33 24.44 83 32.91 20.42
9 75.23 23.23 34 59.65 24.10 59 47.30 22.63 84 32.35 19.92
10 74.89 20.69 35 59.60 21.30 60 47.21 20.93 85 31.35 21.69
11 74.81 20.94 36 59.12 21.68 61 46.78 20.58 86 27.79 18.80
12 74.19 19.49 37 59.02 22.17 62 46.58 25.65 87 27.75 25.29
13 73.05 22.58 38 55.48 24.15 63 45.70 20.38 88 23.49 19.37
14 73.05 22.89 39 54.50 24.68 64 45.42 24.00 89 19.68 15.15
15 72.63 21.19 40 54.11 23.57 65 45.27 24.11 90 17.06 17.68
16 71.95 19.73 41 53.84 20.39 66 45.21 24.54 91 16.40 14.43
17 71.75 20.98 42 53.79 24.53 67 45.04 21.15 92 15.81 16.87
18 69.99 21.85 43 53.32 19.89 68 44.66 20.72 93 14.28 13.91
19 69.87 20.03 44 53.29 20.69 69 44.61 26.65 94 14.03 19.73
20 69.84 20.32 45 53.25 24.08 70 43.84 26.41 95 12.44 18.40
21 69.82 21.99 46 52.22 22.43 71 43.46 21.74 96 11.03 16.23
22 69.66 19.61 47 52.14 23.62 72 43.38 24.00 97 10.78 17.59
23 66.80 21.60 48 52.08 21.25 73 40.36 18.23 98 9.99 15.11
24 65.94 21.99 49 50.50 23.45 74 40.17 22.69 99 8.51 14.39
Table 2.
Multiple regression summary for dependent variable: ranked mean.
r = 0.79, r2 = 0.63, adjusted r2 = 0.61 F(4, 95)= 40.02, p< 0.001, S.E. 12.31, n = 100
Coefficients
Standard
Error t Stat P-value Lower 95% Upper 95%
Intercept 19.57 3.39 5.77 0.000 12.83 26.30
% Flora 0.49 0.05 9.85 0.000 0.39 0.59
% Water 0.70 0.10 7.08 0.000 0.51 0.90
% Geological Features 0.53 0.09 6.02 0.000 0.35 0.70
% Occupied by people -1.59 0.48 -3.30 0.001 -2.55 -0.63
Table 3.
Definitions of the five generic soundscape components used in the loudness estimations.
Sound Source Definition
Human Sounds made by people including musical instruments and bells
Mechanical Sounds emitting from anything manmade, excluding musical instruments, bells and water features
Biological Sounds made by living organisms excluding human beings
Weather Sounds made by the weather such as the wind in the trees / telegraph wires or thunder and lightening
Water Sounds made by water e.g. rapids, breaking waves, rain, fountains, and ornamental water features
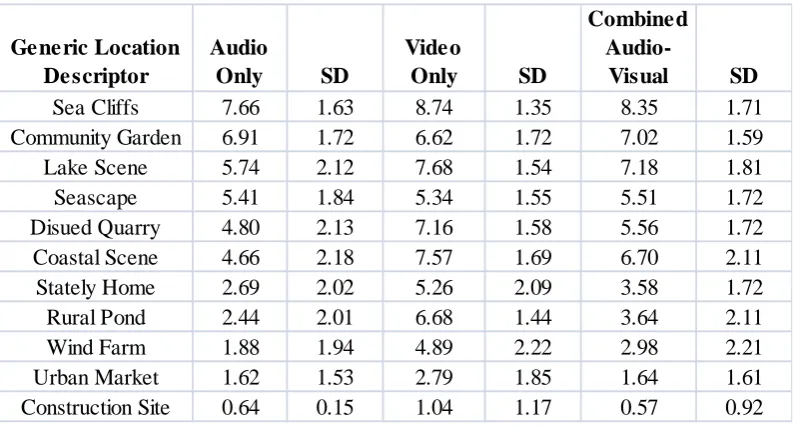
Table 4
Mean tranquillity ratings and associated standard deviations for each experimental
condition.
Generic Location Descriptor
Audio
Only SD
Video
Only SD
Combined
Audio-Visual SD
Sea Cliffs 7.66 1.63 8.74 1.35 8.35 1.71
Community Garden 6.91 1.72 6.62 1.72 7.02 1.59
Lake Scene 5.74 2.12 7.68 1.54 7.18 1.81
Seascape 5.41 1.84 5.34 1.55 5.51 1.72
Disued Quarry 4.80 2.13 7.16 1.58 5.56 1.72
Coastal Scene 4.66 2.18 7.57 1.69 6.70 2.11
Stately Home 2.69 2.02 5.26 2.09 3.58 1.72
Rural Pond 2.44 2.01 6.68 1.44 3.64 2.11
Wind Farm 1.88 1.94 4.89 2.22 2.98 2.21
Urban Market 1.62 1.53 2.79 1.85 1.64 1.61
Construction Site 0.64 0.15 1.04 1.17 0.57 0.92
[image:32.595.75.472.153.367.2]Table 5.
Multiple regression summary of the generic loudness components and the dependent variable
mean tranquillity rating, in the combined audio-visual experimental condition.
r =0.97, r2=0.95, adjusted r2=0.91 F (5, 5)=22.42, p <0.01, S.E. 0.72, n =11
Coefficients
Standard
Error t Stat P-value Lower 95% Upper 95%
Intercept 1.64 0.94 1.75 0.141 -0.77 4.06
Human 0.27 0.20 1.30 0.249 -0.26 0.79
Mechanical -0.16 0.22 -0.74 0.491 -0.72 0.40
Biological 1.78 0.24 7.42 0.001 1.16 2.39
Weather 1.04 0.36 2.86 0.035 0.11 1.97
Water -0.13 0.31 -0.44 0.679 -0.92 0.65
Table 6.
Results of the stepwise multiple linear regression analysis for the combined audio-visual
experimental condition.
r =0.88, r2=0.78, adjusted r2=0.73 F (2, 8)=14.71, p <0.01, S.E.1.28, n =11
Coefficients
Standard
Error t Stat P-value Lower 95% Upper 95%
Intercept 8.57 2.95 2.91 0.020 1.77 15.37
NF 0.04 0.01 2.83 0.022 0.01 0.07
LAeq -0.11 0.04 -2.74 0.025 -0.20 -0.02
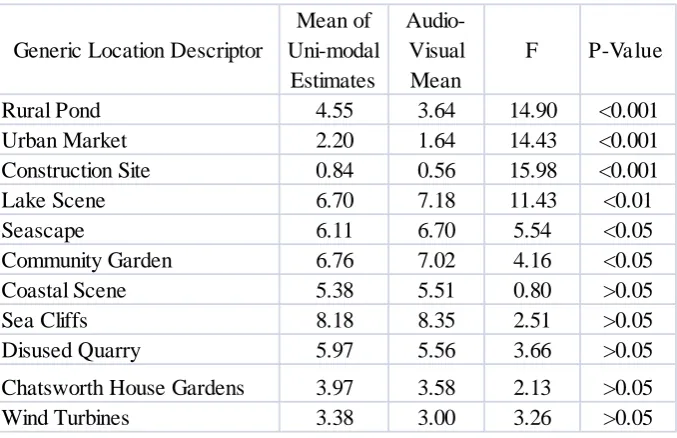
Table 7.
Summary of the repeated measures Analysis of Variance (ANOVA) conducted on each
location.
The following applies to the data contained in this table: df 1, Error 43, Fcrit 4.06 Generic Location Descriptor
Mean of Uni-modal
Estimates
Audio-Visual
Mean
F P-Value
Rural Pond 4.55 3.64 14.90 <0.001
Urban Market 2.20 1.64 14.43 <0.001
Construction Site 0.84 0.56 15.98 <0.001
Lake Scene 6.70 7.18 11.43 <0.01
Seascape 6.11 6.70 5.54 <0.05
Community Garden 6.76 7.02 4.16 <0.05
Coastal Scene 5.38 5.51 0.80 >0.05
Sea Cliffs 8.18 8.35 2.51 >0.05
Disused Quarry 5.97 5.56 3.66 >0.05
Chatsworth House Gardens 3.97 3.58 2.13 >0.05
Wind Turbines 3.38 3.00 3.26 >0.05
[image:35.595.75.414.153.372.2]1. Sea Cliffs 2. Lake Scene 3. Community Garden 4. Seascape
5. Disused Quarry 6. Coastal Scene 7. Rural Pond 8. Chatsworth House
Gardens
[image:36.595.73.510.120.546.2]9. Wind Farm 10. Urban Market 11. Construction Site
Figure 2 - Combined audio-visual estimate of tranquillity plotted against the combined estimate relative to the mean of the uni-modal tranquillity ratings
[image:37.595.92.456.150.466.2]