Development, validation and clinical application of a novel method for
the quantification of efavirenz in dried breast milk spots using LC-MS/MS
Adeniyi Olagunju
1,2, Oluseye O. Bolaji
2, Alieu Amara
3, Catriona Waitt
1, Laura Else
3, Julius Soyinka
2,
Babatunde Adeagbo
2, Ebunoluwa Adejuyigbe
4, Marco Siccardi
1, David Back
1, Andrew Owen
1and Saye Khoo
1*
1
Department of Molecular and Clinical Pharmacology, University of Liverpool, 70 Pembroke Place, Liverpool L69 3GF, UK;
2Faculty of
Pharmacy, Obafemi Awolowo University, Ile-Ife, Nigeria;
3Liverpool Bioanalytical Facility, Department of Molecular and Clinical
Pharmacology, University of Liverpool, Liverpool L69 3GA, UK;
4Department of Paediatric and Child Health, Obafemi Awolowo University,
Ile-Ife, Nigeria
*Corresponding author. Tel:+44-(0)151-794-5560; Fax:+44-(0)151-794-5656; E-mail: [email protected]
Received 18 July 2014; returned 17 September 2014; revised 20 September 2014; accepted 26 September 2014
Objectives:
This manuscript describes the development, validation and clinical application of a novel method for
the quantification of the antiretroviral drug efavirenz in dried breast milk spots using LC-MS.
Methods:
Dried breast milk spots were prepared by spotting 30
m
L of human breast milk on each circle of
Whatman 903 Protein Saver cards. Chromatographic separation was achieved on a reverse-phase C18 column
with 1 mM ammonium acetate in water/acetonitrile using a solvent gradient at a flow rate of 400
m
L/min and
detection was by TSQ Quantum Access triple quadrupole mass spectrometer equipped with a heated
electro-spray ionization source. The method was applied to characterize the breast milk pharmacokinetic profile of
efa-virenz in HIV-positive nursing mothers receiving regimens containing 600 mg of efaefa-virenz once daily.
Results:
The assay was validated over the concentration range 50 – 7500 ng/mL. Accuracy ranged between
95.2% and 102.5% and precision ranged between 1.05% and 9.53%. The average recovery of efavirenz from
dried breast milk spots was 106.4% and the matrix effect was 8.14%. Stability of efavirenz in dried breast milk
spots and processed samples at room temperature,
2
408C and
2
808C was demonstrated. In the
pharmacoki-netic study, the mean (SD) AUC
0 – 24,
C
maxand
C
minof efavirenz in breast milk were 59 620 ng.h/mL (17 440),
4527 ng/mL (1767) and 1261 ng/mL (755.9), respectively. The mean (range) milk-to-plasma concentration
ratio over the dosing interval was 0.78 (0.57–1.26).
Conclusions:
The dried breast milk spot method is simple, robust, accurate and precise, and can be used in
set-tings with limited resources.
Keywords:
liquid chromatography, mass spectrometry, antiretroviral
Introduction
The WHO recommends exclusive, ‘on demand’ breastfeeding
starting within 1 h of birth, up to 6 months of age, and continued
with gradual introduction of appropriate complementary foods up
to 2 years of age or beyond. In addition to its nutritional benefits,
ready availability and affordability, the health benefits of
breast-feeding for both infant and mother have long been recognized.
1–4However, breastfeeding in the presence of maternal drug use is
widespread despite the lack of safety data for either proscriptions
or permissive statements. In fact, over 90% of nursing mothers
take at least one drug during the first week after delivery, 17%
take at least one drug until 4 months after delivery and 5% receive
drugs for chronic conditions, giving rise to concerns over the
presence of drugs in breast milk and their potential effects on
the nursing infant.
5Making an informed decision requires an accurate evaluation of
the potential risks versus benefits based on knowledge of the
extent of the drug’s excretion in human breast milk.
6For instance,
HIV-positive mothers breastfeed their babies while taking
antiretro-viral drugs (ARVs) started during pregnancy for their own health
and for prevention of mother-to-child transmission (PMTCT) of
HIV. Understanding the dynamics of HIV viral load in breast milk
and the safety of maternal drugs for the breastfed infant requires
understanding of the pharmacokinetics of ARVs in breast milk.
7Therapeutic drug concentrations in breast milk can prevent ongoing
localized replication of viral reservoir and the development of
drug-resistant virus,
8which may otherwise be passed to infants,
#The Author 2014. Published by Oxford University Press on behalf of the British Society for Antimicrobial Chemotherapy. All rights reserved.
For Permissions, please e-mail: [email protected]
J Antimicrob Chemother
doi:10.1093/jac/dku420
by guest on October 21, 2014
http://jac.oxfordjournals.org/
who become infected if PMTCT fails.
9On the other hand, high
con-centrations may lead to toxicity in exposed infants.
Very few bioanalytical methods have been described in the
lit-erature for the quantification of ARV drugs in breast milk. The
com-plexity of breast milk makes available methods either difficult to
validate because of inadequate sample clean-up or complicated
due to multiple sample clean-up steps involving a combination of
liquid –liquid and solid-phase extraction in a single method.
10,11In
addition, lack of standardization makes cross-study comparisons
difficult, particularly given differential drug accumulation within
specific fractions of milk. For instance, studies reporting the
excre-tion of abacavir, efavirenz, etravirine, lamivudine, lopinavir,
nevir-apine, zidovudine, tenofovir and emtricitabine in human breast
milk have used methods validated only in plasma.
12–17A fully
validated method was described for the quantification of
lamivu-dine, lopinavir, nelfinavir, nevirapine, ritonavir, stavudine and
zidovudine (7 out of 25 ARVs in use) in breast milk.
18However,
the multiple extraction steps make the method time-consuming
and expensive, which is a barrier to implementation in
resource-limited settings. No fully validated method has been described for
the quantification of other ARV drugs in breast milk, including
efa-virenz, an HIV NNRTI, which is recommended by the WHO as a
regular component of first-line regimens across different
populations.
19The use of dried matrix spots in the bioanalysis of drugs is
increasingly becoming acceptable. This approach is characterized
by several advantages compared with the traditional methods:
low sample volume, ease of collection, biosafety, room-temperature
storage, low-cost shipping, enhanced stability of some analytes
20and the potential for application in intensive pharmacokinetic
studies in special populations. This technique has been described
for whole blood
21and transparent matrices such as plasma,
22CSF,
20urine
23and synovial fluid.
24However, drug quantification
in dried breast milk spots has not been reported. Here we describe
a novel and simple method for the quantification of efavirenz in
total (unfractionated) breast milk extracted from dried filter
paper using LC-MS. Using this method, we describe for the first
time the pharmacokinetics of efavirenz in human breast milk
over a full dosing interval.
Materials and methods
Reference standard of efavirenz was obtained from Toronto Research Chemicals Inc. (North York, Ontario, Canada) and hexobarbital, used as an internal standard, was obtained from Sigma-Aldrich (Gillingham, Dorset, UK). LC-MS-grade acetonitrile was obtained from Fisher Scientific (Loughborough, Leicestershire, UK) and methanol from VWR International (Lutterworth, Leicestershire, UK). Water was produced from an Elga Option 4 water purifier (Elga Labwater, High Wycombe, Buckinghamshire, UK) and was further purified to 18.2 MV with a Purelab Classic UVF (Elga LabWater, High Wycombe, Buckinghamshire, UK). Whatman 903 Protein Saver cards were obtained from Scientific Laboratory Supplies (Hessle, East Yorkshire, UK). Blank breast milk samples were obtained (with ethics approval) from Wirral Mothers’ Milk Bank, Clatterbridge Hospital, Wirral, UK and whole blood was obtained from drug-free healthy volunteers.
LC-MS/MS systems
The LC system consisted of a variable loop Accela autosampler and an Accela LC-Pump (Thermo Electron Corporation, Hemel Hempstead,
Hertfordshire, UK). A reverse-phase FortisTM C18 column: 3mm,
100 mm×2.1 mm (Fortis Technologies Ltd, Neston, Cheshire, UK) was used to resolve analytes, using a 2mm C18 Quest column-saver (Thermo Electron Corporation, Hemel Hempstead, Hertfordshire, UK) as a guard column. The HPLC was connected to a TSQ Quantum Access triple quadrupole mass spectrometer (Thermo Electron Corporation, Hemel Hempstead, Hertfordshire, UK) equipped with a heated electrospray ion-ization source. TSQ tune software (Thermo Electron Corporation, Hemel Hempstead, Hertfordshire, UK) enabled the optimization of tuning para-meters while LC Quan software (Thermo Electron Corporation, Hemel Hempstead, Hertfordshire, UK) was used for data acquisition and processing.
LC-MS/MS conditions
Chromatographic separation was achieved using a solvent gradient pro-gramme at a flow rate of 400mL/min. The two mobile phases consisted of 1 mM ammonium acetate in water (mobile phase A) and 1 mM ammonium acetate in acetonitrile (mobile phase B). The gradient started with 70% mobile phase A, decreasing to 10% over 3 min. This was maintained for 1 min, followed by column equilibration to the initial conditions over 2 min. The total run time was 5 min. Injection volume was 10mL and the needle was washed twice with 3 mL of methanol/water (1: 1, v/v) between injections. The mass spectrometer was operated in negative ionization mode to produce characteristic frag-mentation patterns and precursor ions ([M2H]2
) for efavirenz and internal standard, which were then monitored by selective reaction monitoring.
The electrospray voltage was set at 3.0 kV, the capillary temperature at 2708C and vaporizer temperature at 3508C. The sheath and auxiliary gas pressures were set to 60 and 15 arbitrary units, respectively. Argon was used as the collision gas at a pressure of 1.5 mTorr. Product ion character-ization was done by directly infusing 1mg/mL solutions of efavirenz and hexobarbital separately into the MS using a syringe at a flow rate of 5mL/min. The transitions were m/z 313.979241.991 and 244.025 for efavirenz and 235.07142.449 for hexobarbital with optimal collision energies of 20 and 19 and tube lenses of 76 and 84, respectively. The scan width was set at 0.01 m/z and the scan time at 0.05 s. The peak width settings for Q1 and Q3 were set at 0.7mm.
Stock solutions, calibration standards and quality
controls (QCs)
Stock solutions of efavirenz and the internal standard were prepared from the pure compounds in 100% methanol to obtain a final concentration of 1 mg/mL and refrigerated at 48C until use. A 10mg/mL working stock of efavirenz in breast milk was prepared by adding a predetermined volume of efavirenz stock solution to drug-free breast milk, tumbled for 60 min and used the same day. Nine calibration standards in the range of 50 – 7500 ng/mL, together with low QC (LQC; 100 ng/mL), medium QC (MQC; 1500 ng/mL) and high QC (HQC; 6000 ng/mL), were prepared from separ-ate working stocks by serial dilution with drug-free breast milk. Working solution of efavirenz at concentrations equivalent to the QCs and 100mg/mL of the internal standard were prepared in methanol:water (50:50, v/v).
Dried milk spot calibration standard and QC preparation
Calibration standards and QCs were prepared by carefully spotting 30mL of spiked and well-mixed breast milk on each circle of Whatman 903 Protein Saver cards. Spotted cards were left to dry at room temperature overnight and stored with desiccant sachets in ziplock bags. QC samples for stability testing were stored at room temperature,2408C and2808C.
Olagunju
et al
.
by guest on October 21, 2014
http://jac.oxfordjournals.org/
Sample pretreatment
In each case, the entire spot was removed using a 13 mm hole punch, folded into a 7 mL screw cap tube and extracted with 1 mL of methanol by tumbling for 30 min in the presence of 20mL of the internal standard. The extract was centrifuged at 4000 rpm for 5 min; supernatant was transferred into a 5 mL tube and evaporated to dryness in a centrifugal rotary vacuum evaporator (Thermo Electron Industries, Chateau Gontier, France) operated at 408C. The residue was reconstituted in 500mL of mobile phase A and B (50:50, v/v) and aliquots were transferred into auto-sampler vials. Each calibration standard level was prepared in duplicate (n¼2) while the QCs were prepared in sextuplicate (n¼6).
Standard curve, accuracy and precision
Validation of the method was carried out as per FDA guidelines.25Ten sep-arate assays, each consisting of a zero blank (n¼2), nine calibration stan-dards between 50 and 7500 ng/mL (n¼2) and QCs (n¼6) were run. Calibration curves were constructed using a linear regression equation of analyte/internal standard peak area ratios versus nominal concentrations with a 1/concentration weighting. Accuracy was defined as percentage deviation of measured concentration from the nominal value and precision was defined as the percentage CV. Inter-individual precision was assessed using a validation assay run by a different operator. At least 75% of calibra-tion standards were required to have percentage deviacalibra-tion within+15%, except for the lower limit of quantification (LLOQ), which is allowed to be
+20% of the nominal value. A percentage deviation and a CV within
+20% for LQC and within+15% for MQC and HQC were set as acceptance criteria for≥67% of all QC samples and≥50% of QCs at each level.25,26
Recovery, matrix effect and dilution integrity
Recovery was assessed by comparing peak area obtained from replicates of each of the extracted QCs with the peak area obtained from the corre-sponding solutions of efavirenz in mobile phase, as recommended by Matuszewskiet al.27To evaluate matrix effect, six drug-free breast milk samples from different donors were spotted onto Whatman 903 Protein Saver cards and extracted as previously described. Each of the blank extracts was spiked with the appropriate efavirenz working solution (100, 1500 or 6000 ng/mL) to obtain final concentrations equivalent to extracted dried breast milk spots at LQC, MQC or HQC. Identical concentra-tions of unextracted samples were prepared by directly spiking working solutions into mobile phase. Each concentration was evaluated in sextu-plicate for each of the six breast milk samples. The overall recovery was calculated as the ratio (expressed as a percentage) of the absolute peak-area response of plasma samples spiked with drug prior to extraction to the peak area response of spiked mobile phase samples. The percentage matrix effect was calculated as the ratio (expressed as a percentage) of the peak area response of blank plasma extracts spiked post-extraction to the peak areas of spiked mobile phase samples. A relative standard deviation (RSD) of≤15% was set as the level of acceptance for both recov-ery and matrix effect in line with the FDA and EMA guidelines.25,26In add-ition, we stipulated that mean recovery should be ,115% at any concentration. Dilution integrity was evaluated to investigate the applic-ability of the method to patient samples with efavirenz concentrations above 7500 ng/mL. For this, 10mg/mL efavirenz in breast milk was pre-pared and 30mL was spotted on each circle of Whatman 903 card, dried and extracted as previously described. The extract was diluted 2× and 4×using blank dried breast milk spots similarly extracted.
Stability and re-injection reproducibility
The stability of efavirenz in dried breast milk spots under different storage and processing conditions was investigated. Short-term stability was eval-uated by storing extracted QC samples at room temperature and in the
autosampler (48C) for 24 h and over the weekend (72 h). Short-term sta-bility of processed patient samples (n¼10) from an accepted validation assay run was also evaluated. For long-term stability at room tempera-ture,2408C and2808C, QC samples were stored at these temperatures for 6 months. The concentrations of the stored samples were determined using calibration standards and QCs prepared with a freshly made efavir-enz stock solution. To assess re-injection reproducibility in the event of instrument interruption, an accepted validation assay run was re-injected after 24 h in the autosampler.
Application in a pharmacokinetic study
The method was applied in a preliminary study to evaluate the breast milk pharmacokinetic profile of efavirenz in HIV-positive nursing mothers (n¼5) receiving regimens containing 600 mg efavirenz once daily. Patients were recruited from Bishop Murray Medical Centre, Makurdi, Nigeria and written informed consent was obtained prior to enrolment. Mothers taking antimalarial, antituberculosis or other drugs known to interact with efavirenz were excluded. Breast milk was manually expressed by the mothers mid-feed into 5 mL tubes, 0.5, 1, 2, 4, 8, 12 and 24 h after an observed evening dose of 600 mg efavirenz. To reflect real-life situa-tions, patients took a standard local meal about 30 min before drug administration. A 30mL aliquot was immediately spotted on each circle of Whatman 903 cards, dried and stored as previously described. Within 2 min of breast milk collection, whole blood samples were collected as dried blood spots (DBS) after sterile skin cleaning and finger prick using a 2 mm safety lancet (BD, Oxford, Oxfordshire, UK). The first drop of blood was discarded and subsequent blood drops were collected on Whatman 903 cards, dried and stored as described above. Samples were shipped at room temperature to the Department of Molecular and Clinical Pharmacology, University of Liverpool, Liverpool, UK for analysis. Efavirenz in dried breast milk spots was quantified using the method described above and efavirenz in DBS was quantified using a method described elsewhere.28Plasma efavirenz concentrations were estimated using [DBS[EFV]/(12HCT)]×fbpp, where DBS[EFV]is efavirenz concentration
in DBS, HCT is the patient specific haematocrit andfbpp(0.995) is the
frac-tion of efavirenz bound to plasma protein.29The study protocol and the material transfer agreement were approved by the National Health Research and Ethics Committee, Abuja and Obafemi Awolowo University Teaching Hospitals Ethics and Research Committee, Ile-Ife, Nigeria.
Results
LC-MS/MS conditions
The total run time was 5 min and retention times of efavirenz and
the internal standard were 2.27 and 1.67 min, respectively.
Representative chromatograms are presented in Figure S1
(avail-able as Supplementary data at
JAC
Online).
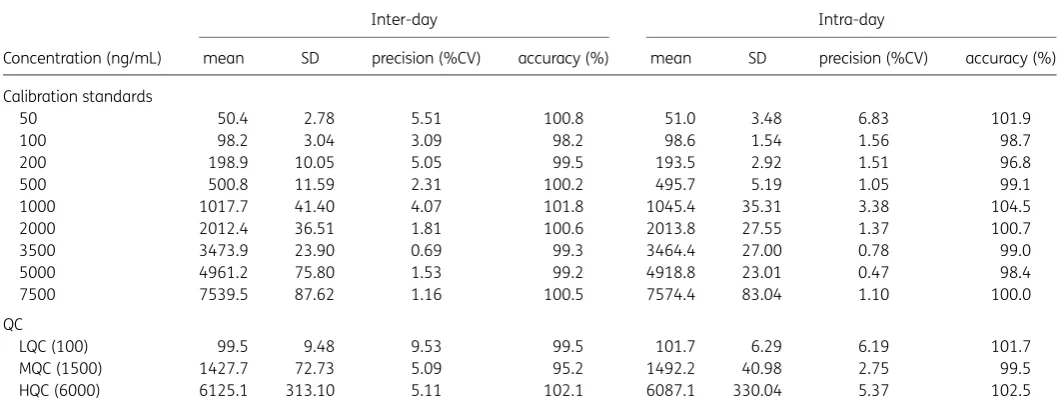
Linearity, accuracy and precision
The method was linear, accurate and precise in the range of 50 –
7500 ng/mL. Mean regression coefficient (
r
2) was 0.9994 and the
average relative standard deviation of the internal standard
response was 3.7%. Accuracy (percentage bias) was between
95.2% and 102.5% and precision (CV) was between 1.05% and
9.53% (Table
1
). These values are within bioanalytical method
val-idation acceptance criteria as per FDA and EMA guidelines.
25,26Recovery, matrix effect and dilution integrity
The average (CV) recoveries of efavirenz from dried breast milk
spots at LQC, MQC and HQC were 101.6% (7.40), 109.4% (2.58)
JAC
by guest on October 21, 2014
http://jac.oxfordjournals.org/
and 108.2% (2.97), respectively. Matrix effect was within
+
15%
for each of the six different matrices, with an average (CV) of
9.05% (4.94), 8.15% (5.35) and 7.27% (4.17) at LQC, MQC and
HQC, respectively. The average efavirenz concentrations in the
10 000 ng/mL dried breast milk spots diluted 2
×
and 4
×
were
10 147 and 10 893 ng/mL, representing 101.5% and 108.9%
dilution integrity, respectively.
Stability and re-injection reproducibility
Processed QC and incurred patient samples were stable at room
temperature and in the autosampler (48C) for 24 h and over the
weekend (72 h) with percentage deviations from nominal
concen-trations (for QC samples) or from the original assay results (for
patient samples) within
+
15%. The stability of efavirenz in dried
breast milk spots after storage for 6 months ranged from 92%
to 101% at room temperature, from 105% to 111% at
2
408C
and from 110% to 113% at
2
808C. Reinjection reproducibility
was demonstrated in a repeat analysis of an accepted validation
batch with all assay validation parameters within acceptable
limits.
Application in a pharmacokinetic study
The method was successfully applied to investigate the
pharma-cokinetics of efavirenz in human breast milk. Median (range) age
of mothers included was 29 years (25 –34) and weight was 55 kg
(45 –71). All five mothers started an efavirenz-containing regimen
before delivery and samples were collected at steady-state,
146 days (108 – 194) after delivery. As shown in Figure
1
(f), the
breast milk profile approximately paralleled the plasma profile.
As with the plasma, breast milk concentrations also exhibited
con-siderable interindividual variability (Figure
1
a –e). The mean (SD)
AUC,
C
maxand
C
minwere 59 620 ng.h/mL (17 440), 4527 ng/mL
(1767) and 1261 ng/mL (755.9), respectively, in breast milk.
Corresponding values in plasma were 74 230 ng.h/mL (25 610),
4711 ng/mL (1083) and 2571 ng/mL (1092), respectively
(Figure
1
). Interestingly, breast milk efavirenz concentration
exceeded plasma concentration at some point during the dosing
interval in all five patients. Also, breast milk concentration was
predominantly higher than plasma concentration in patient
1. The average (range) milk-to-plasma (M/P) ratio over the dosing
interval was 0.78 (0.57 – 1.26). The M/P ratio was 0.83 at 4 h
post-dose.
Discussion
To our knowledge, this is the first description of a drug
quantifica-tion method in dried breast milk spots. Addiquantifica-tionally, the full
phar-macokinetic profile of efavirenz in human breast milk has been
described for the first time. The simplicity, accuracy and precision
of the developed method will facilitate interlaboratory transfer.
The stability of efavirenz in dried breast milk spots at room
tem-perature will facilitate studies in settings with inadequate cold
storage facilities and shipping without the need for dry ice, thus
extending its utility in resource-limited settings. Other advantages
include patient acceptability, and reduction in perceived or actual
risks to the patient resulting from multiple sampling of large
volumes. The low sample volume required per assay may also
extend application of the method to pharmacokinetic studies in
animals in which adequate breast milk volumes may be difficult
to obtain because of low rate of milk production.
10As a result of the complexity of human breast milk, previously
described methods involve complicated extraction procedures
with a combination of liquid – liquid extraction and solid-phase
extraction for sample clean-up.
11Some authors have used
skimmed milk for validation, which has the potential for
under-estimating breast milk concentrations and hence the M/P ratio
of drugs that are highly bound to breast milk proteins and lipids.
The use of a dried matrix spot allows quantification of drug
con-centrations in whole milk because the cellulose material entraps
milk proteins and lipids on drying, allowing selective extraction of
analytes.
[image:4.612.41.572.106.313.2]The ARV efavirenz, which is an essential component of first-line
regimens and frequently used by HIV-positive nursing mothers in
Table 1. Accuracy and precision for the quantification of efavirenz in dried breast milk spots
Concentration (ng/mL)
Inter-day Intra-day
mean SD precision (%CV) accuracy (%) mean SD precision (%CV) accuracy (%)
Calibration standards
50 50.4 2.78 5.51 100.8 51.0 3.48 6.83 101.9
100 98.2 3.04 3.09 98.2 98.6 1.54 1.56 98.7
200 198.9 10.05 5.05 99.5 193.5 2.92 1.51 96.8
500 500.8 11.59 2.31 100.2 495.7 5.19 1.05 99.1
1000 1017.7 41.40 4.07 101.8 1045.4 35.31 3.38 104.5
2000 2012.4 36.51 1.81 100.6 2013.8 27.55 1.37 100.7
3500 3473.9 23.90 0.69 99.3 3464.4 27.00 0.78 99.0
5000 4961.2 75.80 1.53 99.2 4918.8 23.01 0.47 98.4
7500 7539.5 87.62 1.16 100.5 7574.4 83.04 1.10 100.0
QC
LQC (100) 99.5 9.48 9.53 99.5 101.7 6.29 6.19 101.7
MQC (1500) 1427.7 72.73 5.09 95.2 1492.2 40.98 2.75 99.5
HQC (6000) 6125.1 313.10 5.11 102.1 6087.1 330.04 5.37 102.5
Olagunju
et al
.
by guest on October 21, 2014
http://jac.oxfordjournals.org/
developing countries, is not licensed for use in children
,
3 months
old or
,
3.5 kg
30because optimal dosing and safety have not been
fully evaluated in this age group. In the first report of its excretion
in breast milk by Schneider
et al
.,
12single-point breast milk and
plasma samples were collected 3 – 4 h post-dose and the M/P
ratio was 0.54, compared with the M/P ratio of 0.83 at 4 h
post-dose in the present study. This difference may be due to the
use of skimmed milk instead of whole milk in the former study,
resulting in underestimation of the breast milk concentrations of
efavirenz, which in plasma is 99.5% protein bound. In addition,
changes in milk production, composition and infant feeding
pat-terns may cause variations in the M/P ratio during the dosing
inter-val,
31making single-point estimates inaccurate and often
misleading.
6Breast milk is more lipophilic than plasma; efavirenz
may preferentially partition into this compartment and
accumu-late after maternal dose before the next infant feed. In fact, we
8000 (a) 7000 6000 5000 4000 3000 2000 1000 00 5 10 15
Time post-dose (h) Patient 1 Breast milk Plasma Ef a vir enz concentr ation (ng/mL) 20 25 8000 (b) 7000 6000 5000 4000 3000 2000 1000 0
0 5 10 15
Time post-dose (h) Patient 2 Breast milk Plasma Ef a vir enz concentr ation (ng/mL) 20 25 8000 (c) 7000 6000 5000 4000 3000 2000 1000 0
0 5 10 15
Time post-dose (h) Patient 3 Breast milk Plasma Ef a vir enz concentr ation (ng/mL) 20 25 8000 (d) 7000 6000 5000 4000 3000 2000 1000 0
0 5 10 15
Time post-dose (h) Patient 4 Breast milk Plasma Ef a vir enz concentr ation (ng/mL) 20 25 8000 (e) 7000 6000 5000 4000 3000 2000 1000 0
0 5 10 15
Time post-dose (h) Patient 5 Breast milk Plasma Ef a vir enz concentr ation (ng/mL) 20 25 8000 (f) 7000 6000 5000 4000 3000 2000 1000 0
0 5 10 15
Time post-dose (h) Mean (SD) of all 5 patients
[image:5.612.52.559.86.591.2]Breast milk Plasma Ef a vir enz concentr ation (ng/mL) 20 25
Figure 1. Concentration – time profiles of efavirenz in breast milk and plasma of five HIV-positive nursing mothers (a –e) taking regimens containing 600 mg of efavirenz once daily. The mean (SD) of all five patients is shown in (f). The mean (range) M/P ratio over the dosing interval was 0.78 (0.57–1.26).
JAC
by guest on October 21, 2014
http://jac.oxfordjournals.org/
observed intra- and interindividual variations in the M/P ratio
dur-ing the dosdur-ing interval in the present study. In addition to the
fac-tors highlighted above, genetic facfac-tors may also play some role.
32Using our method, M/P ratio ranged from 0.57 to 1.26 with an
average of 0.78 over the 24 h dosing interval.
Uncertainties surrounding the use of many drugs during
lacta-tion may result in suboptimal adherence to essential
pharmaco-therapy or premature recourse to formula feeding by nursing
mothers. In the context of HIV/AIDS, this will not be affordable,
feasible, acceptable, sustainable or safe for the majority of the
world’s HIV-positive women living in resource-limited countries.
The availability of validated bioanalytical methods for the
quanti-fication of drugs in human breast milk is an important step
towards resolving some of these uncertainties and clarifying the
pharmacokinetics of drugs in this compartment. The dried milk
spot method presented here is simple, accurate and precise and
further studies to investigate applications for other drugs that
may be used during lactation are warranted. A useful approach
will be to modify methods already validated for the drug of
inter-est in other matrices. Additional validation steps to inter-establish a
suitable extraction procedure, optimal recovery and drug stability
in dried breast milk spot will be needed as per FDA guidelines.
25In the present study, a potential limitation is that a
cross-validation comparing the dried breast milk spot method with
the traditional liquid breast milk method was not conducted.
Also, unlike DBS, which can be collected directly from patients
after a finger prick, the dried breast milk method relies on accurate
pipetting from expressed breast milk and spotting on sample
col-lection cards. It is also essential that spotting be limited to the
marked sample collection areas on the cards since breast milk is
colourless.
Acknowledgements
We thank staff at the Liverpool Bioanalytical Facility for their input during the method development and validation. We would also like to thank the participating patients, staff and management of Bishop Murray Medical Centre, Makurdi, Nigeria for their support in the preliminary pharmacokinetic study.
Funding
The method development and validation was carried out as part of our routine work at the Liverpool Bioanalytical Facility, Department of Molecular and Clinical Pharmacology, University of Liverpool, Liverpool, UK. A. O. received funding from the HIV Research Trust, UK for the prelim-inary pharmacokinetic study.
Transparency declarations
L. E., D. B., A. O. and S. K. have received research grants and/or travel bur-saries from Merck, Bristol-Myers Squibb, GlaxoSmithKline, Pfizer, Abbott, ViiV, Boehringer Ingelheim and Janssen Pharmaceuticals. All other authors: none to declare.
Supplementary data
Figure S1 is available as Supplementary data atJACOnline (http://jac. oxfordjournals.org/).
References
1 Ebbs JH, Mulligan F. The incidence and mortality of breast- and artificially-fed infants admitted to hospital with infections.Arch Dis Child
1942;17: 217–9.
2 Gyllensward C. Breast-fed children compared to artificially fed children in a series from a children’s home.Acta Soc Med Ups1953;58: 285– 311.
3 Levin B, Mackay HM, Neill CAet al. Weight gains, serum protein levels and health of breast fed and artificially fed infants, full term and premature.
Memo Med Res Counc1959;296: 1 –154.
4 Fallot ME, Boyd JL 3rd, Oski FA. Breast-feeding reduces incidence of hos-pital admissions for infection in infants.Pediatrics1980;65: 1121–4.
5 McNamara PJ, Abbassi M. Neonatal exposure to drugs in breast milk.
Pharm Res2004;21: 555–66.
6 Ito S. Drug therapy for breast-feeding women. New Engl J Med
2000;343: 118–26.
7 Marzolini C, Gray GE. Maternal antiretroviral prophylaxis and breastfeed-ing.Antivir Ther2012;17: 1503–6.
8 Van de Perre P, Rubbo PA, Viljoen Jet al. HIV-1 reservoirs in breast milk and challenges to elimination of breast-feeding transmission of HIV-1.Sci Transl Med2012;4: 143sr3.
9 Kuhn L, Hunt G, Technau KGet al. Drug resistance among newly diag-nosed HIV-infected children in the era of more efficacious antiretroviral prophylaxis.AIDS2014;28: 1673–8.
10 Rossi DT, Wright DS. Analytical considerations for trace determinations of drugs in breast milk.J Pharm Biomed Anal1997;15: 495–504.
11 Rezk NL, Abdel-Megeed MF, Kashuba AD. Development of a highly effi-cient extraction technique and specific multiplex assay for measuring anti-retroviral drug concentrations in breast milk.Ther Drug Monit2007;29: 429–36.
12 Schneider S, Peltier A, Gras Aet al. Efavirenz in human breast milk, mothers’, and newborns’ plasma. J Acquir Immune Defic Syndr
2008;48: 450–4.
13 Shapiro RL, Rossi S, Ogwu Aet al. Therapeutic levels of lopinavir in late pregnancy and abacavir passage into breast milk in the Mma Bana Study, Botswana.Antivir Ther2013;18: 585– 90.
14 Shapiro RL, Holland DT, Capparelli Eet al. Antiretroviral concentrations in breast-feeding infants of women in Botswana receiving antiretroviral treatment.J Infect Dis2005;192: 720–7.
15 Mirochnick M, Thomas T, Capparelli Eet al. Antiretroviral concentrations in breast-feeding infants of mothers receiving highly active antiretroviral therapy.Antimicrob Agents Chemother2009;53: 1170– 6.
16 Spencer LY, Liu S, Wang Cet al. Intensive etravirine PK and HIV-1 viral load in breast milk and plasma in HIV+women receiving HAART.Top Antivir Med2014;22: 466 (Abstract 891).
17 Benaboud S, Pruvost A, Coffie PAet al. Concentrations of tenofovir and emtricitabine in breast milk of HIV-1-infected women in Abidjan, Cote d’Ivoire, in the ANRS 12109 TEmAA Study, Step 2.Antimicrob Agents Chemother2011;55: 1315– 7.
18 Rezk NL, White N, Bridges ASet al. Studies on antiretroviral drug con-centrations in breast milk: validation of a liquid chromatography-tandem mass spectrometric method for the determination of 7 anti-human immunodeficiency virus medications.Ther Drug Monit2008;30: 611–9.
19 WHO.Consolidated Guidelines on the Use of Antiretroviral Drugs for Treating and Preventing HIV Infection, 2013. http://www.who.int/iris/ bitstream/10665/85321/1/9789241505727_eng.pdf.
20 Delaby C, Gabelle A, Meynier Pet al. Development and validation of dried matrix spot sampling for the quantitative determination of amyloidb
peptides in cerebrospinal fluid.Clin Chem Lab Med2014;52: 649–55.
Olagunju
et al
.
by guest on October 21, 2014
http://jac.oxfordjournals.org/
21 Zheng JH, Guida LA, Rower Cet al. Quantitation of tenofovir and emtri-citabine in dried blood spots (DBS) with LC-MS/MS.J Pharm Biomed Anal
2013;88: 144–51.
22 Baietto L, D’Avolio A, Ariaudo Aet al. Development and validation of a new UPLC-PDA method to quantify linezolid in plasma and in dried plasma spots.J Chromatogr B Analyt Technol Biomed Life Sci2013;936: 42 –7.
23 Otero-Fernandez M, Cocho JA, Tabernero MJet al. Direct tandem mass spectrometry for the simultaneous assay of opioids, cocaine and metabo-lites in dried urine spots.Anal Chim Acta2013;784: 25 –32.
24 Christianson CD, Laine DF, Zimmer JSet al. Development and validation of an HPLC-MS/MS method for the analysis of dexamethasone from pig synovial fluid using dried matrix spotting.Bioanalysis2010;2: 1829– 37.
25 FDA.Guidance for Industry: Bioanalytical Method Validation. Rockville, MD: FDA, US Department of Health and Human Services. http://www. fda.gov/downloads/drugs/guidancecomplianceregulatoryinformation/ guidances/ucm070107.pdf.
26 EMA.Guideline on Bioanalytical Method Validation. London: Committee for Medicinal Products for Human Use. http://www.ema.europa.eu/docs/ en_GB/document_library/Scientific_guideline/2011/08/WC500109686.pdf.
27 Matuszewski BK, Constanzer ML, Chavez-Eng CM. Strategies for the assessment of matrix effect in quantitative bioanalytical methods based on HPLC-MS/MS.Anal Chem2003;75: 3019–30.
28 Amara AB, Else LJ, Tjia Jet al. A validated method for quantification of efavirenz in dried blood spots (DBS) using HPLC-MS/MS.Ther Drug Monit
2014; doi:10.1097/FTD.0000000000000127.
29 Kromdijk W, Mulder JW, Rosing Het al. Use of dried blood spots for the determination of plasma concentrations of nevirapine and efavirenz.
J Antimicrob Chemother2012;67: 1211–6.
30 Panel on Antiretroviral Therapy and Medical Management of HIV-Infected Children.Guidelines for the Use of Antiretroviral Agents in Pediatric HIV Infection. http://aidsinfo.nih.gov/contentfiles/lvguidelines/ pediatricguidelines.pdf.
31 Wilson JT, Brown RD, Cherek DRet al. Drug excretion in human breast milk: principles, pharmacokinetics and projected consequences.Clin Pharmacokinet1980;5: 1– 66.
32 Olagunju A, Owen A, Creesey TR. Potential effect of pharmacogenetics on maternal, fetal and infant antiretroviral drug exposure during preg-nancy and breastfeeding.Pharmacogenomics2012;13: 1501–22.
JAC
by guest on October 21, 2014
http://jac.oxfordjournals.org/