promoting access to White Rose research papers
White Rose Research Online [email protected]
Universities of Leeds, Sheffield and York
http://eprints.whiterose.ac.uk/
This is an author produced version of a paper published in Journal of Applied Physics.
White Rose Research Online URL for this paper:
http://eprints.whiterose.ac.uk/8730
Published paper
Matcher, S.J. (2009) A review of some recent developments in polarization-sensitive optical imaging techniques for the study of articular cartilage, Journal of Applied Physics, 105(10), Art. No.102041
A review of some recent developments in
polarization-sensitive optical imaging techniques for the study of
articular cartilage.
Stephen J Matcher
Department of Engineering Materials, University of Sheffield, Mappin Street,
Sheffield S1 3JD, UK.
Telephone +44 114 22 25994
Fax +44 114 22 25943
Keywords: optical coherence tomography; polarization-sensitive optical coherence tomography; second harmonic generation, articular cartilage degeneration, osteoarthritis.
ABSTRACT
This article reviews recent developments in the optical imaging of articular cartilage using
polarized-light methods, with an emphasis on tools that could be of use in tissue engineering
approaches to treatment. Both second harmonic generation microscopy and
polarization-sensitive optical coherence tomography are described and their potential role in the treatment
of cartilage disorders such as osteoarthritis is suggested. Key results are reviewed and future
Introduction
Many painful and debilitating medical conditions manifest themselves most directly through
abnormal properties of the extracellular matrix. This structure, which is composed chiefly of
the body’s most abundant structural protein – collagen - acts as the scaffold within which
cells are maintained. A prime example of such a condition is osteoarthritis, which involves a
gradual loss of the normal structure of hyaline cartilage and its replacement with
fibrocartilage. Cartilage is an avascular tissue in which the cellular compartment, composed
of chondrocytes, is completely reliant on the transport of nutrients via diffusion either from
vascularised bone or from synovial fluid. Consequently therapeutic strategies are more limited
than in most other tissues and currently all involve orthopaedic surgery. One of the most
promising treatments is autologous chondrocyte implantation (ACI), which involves
harvesting healthy cartilage from elsewhere on the joint, extracting the chondrocytes,
amplifying them in culture and then re-implanting them into the site of the osteoarthritic
lesion1.
The need to remove healthy cartilage from the patient is clearly undesirable and has prompted
interest in an entirely tissue-engineered solution to the problem. Tissue engineering is a
rapidly emerging technique with potential to dramatically reduce the need for harvested
autologous tissue in the management of severe burns2 and its use to generate artificial
articular cartilage is also generating intense interest. One particularly attractive approach is to
harvest mesenchymal stem cells (MSC’s) from the patient’s bone marrow and culture these
ex-vivo. It is known that by modifying the culture conditions of MSC’s, they can be made to
differentiate into a variety of phenotypes, including ones closely akin to native chondrocytes3.
man-made materials such as collagen, fibrin hydrogels, PLGA/PLLA copolymers4, chitosan5, silk6
and others.
Optical techniques, especially minimally invasive imaging, have found a steady increase in
application over the last 20 years. In ophthalmology for example, optical coherence
tomography has emerged as the method of choice for non-invasive assessment of the retina
and both OCT and confocal microscopy are under intense evaluation as methods of screening
for epithelial cancers. However, optical techniques have not as yet made a major impact in
orthopaedic care. In part this is explained by the limited depth-penetration into tissue
(generally less than 1 mm) and the consequent difficulty of gaining access to structures such
as bone, cartilage and synovium non-invasively. Although diffuse optical techniques have
better depth penetration, they generally have poor spatial resolution. These methods have
been suggested as a way of detecting abnormal blood oxygenation in the synovial membrane
of rheumatoid articular joints however7 and very recently photoacoustic tomography has been
proposed to achieve a similar aim in small-animal models8. However these techniques are
primarily looking for early-stage inflammatory changes in the joint, via changes in blood
content.
In this article we will discuss optical assessment of cartilage changes using endogenous
contrast mechanisms related to collagen microstructure. A number of clinical roles exist for
such an assessment. Firstly, as we have noted, optical techniques have a potential role in the
on-line monitoring of tissue-engineered constructs. Secondly, non-invasive or minimally
invasive techniques may be of use for both detecting early-stage degenerative changes and for
monitoring the response of cartilage to therapy. The limited tissue penetration of wholly
that require the joint space to be opened. However this could encompass not only situations
where osteoarthritis is already sufficiently advanced as to produce pain but also situations in
which injury is sustained to related joint structures such as the anterior cruciate ligament
without immediate collateral damage to the cartilage being directly evident. This latter
situation could represent a new diagnostic opportunity as the prevention of osteoarthritic
degeneration following such soft tissue injuries is a major goal of current orthopaedic
practice. Techniques that augment the capabilities of conventional arthroscopy (especially by
yielding sub-surface imaging) have a number of potential roles to play. Polarized light
methods have high specificity to collagen microstructure and hence there is interest in their
ability to detect pathological change in the deep cartilage zones before surface disruption
becomes apparent. Clearly this would extend the therapeutic window for interventions; this is
of considerable clinical interest given recent evidence that early intervention can potentially
reverse pathological change9. Also it should be noted that the development and evaluation of
new drugs does still require an animal model in most cases. The ability of optical techniques
to provide longitudinal measurements in the same animal (currently animals must be
sacrificed to yield specific time-points) could improve accuracy as well as reduce the cost of
experiments.
Cartilage structure.
Articular cartilage is a complex structure, designed to withstand both compressive and shear
forces due to articulation of the joint surfaces. It consists of a complex 3-D
collagen/proteoglycan network within which water is trapped. The precise 3-D structure of
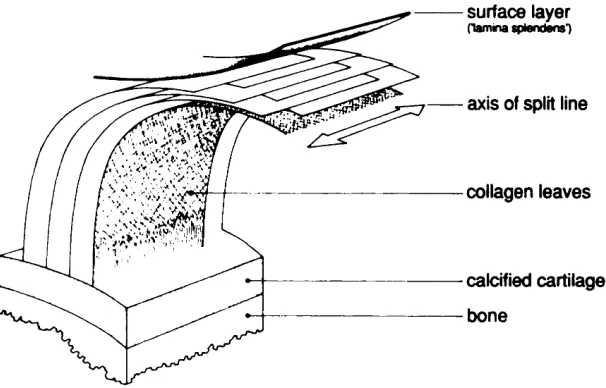
the collagen has been the subject of study over the past century. Figure 1 shows the classic “arcade” model of Benninghoff, in which collagen fibers arise in the subchondral bone, curve
cartilage surface the fibers run parallel to the articular surface, forming the so-called
“tangential” layer, of typical thickness 100 microns. Over the past two decades,
high-resolution SEM imaging and cryofracture techniques have suggested that this model be
revised. The work of Clark11 and Jeffrey et al 12 suggest a model shown schematically in
Figure 2, in which fibers arising from the subchondral bone form well-defined sheets or
lamellae which curve over in the “transitional” layer to then lie parallel to the surface in the
most superficial tangential layer. In this model the fibers do not descend back to the bone but
terminate in the tangential layer. There is evidence from TEM and polarised light microscopy
to further suggest that the fiber direction in alternate lamellae in the tangential layer is not
uniform, but can vary by as much as 45 degrees between lamellae13.
Within the collagen matrix, the interaction between water and proteoglycans generates a
swelling pressure that helps provide the cushioning effect of cartilage. Osteoarthritis is
associated with a gradual loss of proteoglycans and hyaluronic acid - with a subsequent
reduction of the tissue’s ability to generate a swelling pressure - and a replacement of hyaline
cartilage with fibrocartilage. Once a fibrous lesion has begun to form it is essentially
non-healing until a therapeutic intervention is performed. This might be an ACI procedure or the
insertion of a tissue engineered construct. One of the goals of this article is to suggest ways in
which optical techniques might contribute to these treatments.
Polarization-sensitive OCT of articular cartilage.
A number of labs are investigating the use of polarization-sensitive optical coherence
tomography (PS-OCT) to study articular cartilage. PS-OCT has been used extensively to
polarization-sensitive OCT18. Several excellent reviews of the PS-OCT technique exist e.g.
de Boer and Milner19. OCT is an optical analogue of ultrasound imaging and is widely used to
produce depth-resolved images of the retina20. Its primary mode of contrast is via refractive
index differences between tissue layers. The essential difference between conventional and
PS-OCT is that the former is sensitive only to the back-scattered light intensity versus depth,
whereas the latter is sensitive to the polarization-state of the back-scattered light and thus,
indirectly, to the presence of materials with a strong optical anisotropy such as collagen type-I
and type-II. In this section we will briefly reacquaint ourselves with the optical parameters
used to quantify OCT image contrast and optical anisotropy and describe the extent to which
these can be quantitatively determined using various types of PS-OCT system. Where
appropriate, commonly used mathematical symbols are introduced to denote these.
Tissue reflectivity R: This quantity is conventionally understood to indicate the total amount
of optical power that is back-scattered from the sample at a fixed position (x,z). Then R(x,z) is
the most familiar OCT image, sometimes called a “structural” OCT image, which shows
contrast wherever there is a boundary between different tissue types.
Linear birefringence (∆n): This property of an optical medium causes light beams linearly
polarized in orthogonal directions to propagate at slightly different speeds i.e. the medium
refractive index is slightly different for these two polarization states. The polarization
direction with the higher refractive index is termed the “slow-axis” and the axis orthogonal to
this and to the light propagation direction is the “fast-axis”. For a positive uniaxial
birefringent material such as collagen, this direction is co-incident with the axis of cylindrical
symmetry of the collagen fiber provided the fiber lies in a plane orthogonal to the propagation
direction of the light beam. In cases where this is not true a more complicated relationship
slow and fast axes is termed the linear birefringence ∆n. For most biological tissues its value
typically ranges from 0 to 5×10⁻³.
Phase retardation (δ): A consequence of linear birefringence is thus that after propagating a
distance z, a phase difference is introduced between the oscillations in electric field resolved
along these two directions. For a positive uniaxial material, the oscillation resolved along the
fiber long-axis accumulates a phase-lead over that in the orthogonal direction. This is the
most fundamental quantity that can be inferred from a PS-OCT measurement and is termed
the phase-retardation δ. The magnitude of δ, in radians of phase, is given by the formula:
2 n z
π δ
λ
= ∆
Equation 1
Hence the birefringence ∆n is derived by knowing the vacuum wavelength of the light λ and
measuring δ at a known depth z in the tissue. A particularly simple way of doing this is to
produce a so-called phase-retardation image i.e. instead of plotting tissue reflectivity R versus
position i.e. R(x,z), one plots δ(x,z). If the tissue has a spatially uniform ∆n (tendon is a good
example of such a material because it is structurally uniform at the resolution scale of OCT)
then whereas R(x,z) appears featureless, δ(x,z) has a “banded” appearance because whilst δ
increases uniformly with increasing depth, being a phase angle in fact its value is only
determined modulo 2π. Indeed, Equation 1 gives the “single-pass” phase retardation imparted
on the light beam upon reaching the depth z; in OCT this beam is then reflected and
propagates back through the overlying tissue before being detected, which doubles the actual
phase retardation measured. Conventionally PS-OCT phase-retardation images display the
single-pass retardation, which for a medium of uniform ∆n thus display a banded structure
which repeats over a distance zband given by zband = 0.5λ/∆n. Hence a simple way of measuring
Circular birefringence: For completeness we should mention that some optically anisotropic
materials display circular rather than linear birefringence. Also known as “optical activity”,
the phenomenon is associated with the presence of strongly chiral molecules (dextran is a
potent biological source). The optical effect can be thought of as representing a difference in
light propagation speed for right and left circularly polarised polarization states. Since a
linearly polarized state can be decomposed into two circular polarized states of the opposite
handedness, a simple consequence of optical activity is the rotation of the plane of
polarization of a linearly polarized light beam. However because in OCT the beam propagates
first down into the tissue and then after reflection at an interface propagates back up out of the
tissue, circular birefringence cancels in double-pass and thus does not manifest itself in
PS-OCT images.
Intrinsic and form birefringence: ∆n yields information on the degree of optical anisotropy
present in the sample however this anisotropy can arise at different length scales. Intrinsic
linear birefringence arises due to anisotropy at the atomic or molecular scale and
fundamentally is determined by the anisotropic distribution of electrical charge. This type of
birefringence is an intrinsic property of the material and cannot be altered unless gross
changes to the molecular structure are induced. Crystalline materials such as calcite are
examples of intrinsically birefringent substances. However birefringence can be produced by
another mechanism. If a materials consists of a background substance, into which is
embedded a regular array of inclusions, then even if both the background material and the
inclusions are optically isotropic and thus possess no intrinsic birefringence, if the refractive
indices of these materials differ then the composite system can display birefringence, which is
known as form birefringence21. The spatial length scale of the structure producing form
birefringence is generally much larger than the molecular scale at which intrinsic
distinguishing feature of form birefringence is that its value can be changed by changing the
refractive index mismatch between the background material and the inclusions. Relating the
quantitative value of birefringence to underlying physical properties is clearly more
complicated in this case. Studies on Type-I collagen in tendon over the course of several
decades has led to the consensus that this collagen type displays intense intrinsic positive
birefringence due to the quasi-crystalline arrangement of the amino-acid residues that
comprise the polypeptide chains of the collagen molecule alpha-chains22. This intrinsic
birefringence can be further enhanced by binding acidic dyes such as picrosirius red to the
collagen molecule. Weaker form birefringence is also observed but intrinsic birefringence is
thought to dominate. Type-II collagen in articular cartilage has not been investigated to the
same extent, but there is no strong reason to expect a significant difference.
Apparent and true birefringence: This terminology was introduced into the PS-OCT literature
by the author’s group in relation to our PS-OCT studies of articular cartilage23. The
distinction is discussed more fully in the next section, but basically amounts to the
observation that, regardless of its underlying origin – intrinsic or form – the birefringence
value ∆n that is extracted from a phase-retardation map is dependent not only on the
underlying birefringence properties of the sample but also on the geometrical arrangement
between the probing light beam and the 3-D spatial orientation of the fiber long-axis of the
collagen. This effect is well-known in the field of crystal optics and is a classic optical lab
demonstration that can be performed with a calcite crystal. When viewed at most angles, the
anisotropic atomic arrangement of the calcium, carbon and oxygen atoms within the calcite
crystal lattice gives rise to the phenomenon of “double-refraction”, yielding a double-image
of objects viewed through the crystal. However, along a unique axis in the crystal known as
the “optic-axis” the arrangement of the atoms displays a 3-fold rotational symmetry which
birefringence requires a lack of rotational symmetry to be present. For a structure such as
tendon, when viewed orthogonal to its long-axis the collagen fibers are aligned in such a way
as to produce strong rotational asymmetry and so light experiences a very high birefringence.
However, when viewed along the long-axis the fibers appear to form a semi-random array of
packed cylinders seen end-on: this structure displays a high degree of rotational symmetry
and hence the birefringence is weak. Thus the tissue sample displays very different “apparent
birefringence” depending on how it is viewed even though the underlying optical properties
are not changed. This phenomenon is very important in cartilage because the 3-D orientation
of the fibers relative to the incident light beam can be highly variable.
Dichroism/diattenuation/biattenuance: In addition to displaying a different refractive index for
orthogonal linearly polarised light beams, many optically anisotropic media can display
different light absorption properties also. Polaroid® is the classic example, in which
directionally aligned long-chain polymers of polyvinyl alcohol are conjugated to iodine to
produce a medium that strongly absorbs light linearly polarized along the long-chain axis but
absorbs orthogonally polarized light more weakly. Recently Kemp et al introduced the term
“biattenuance” to describe broadly the same phenomenon, but extending the physical
interpretation to include the effects of polarization-dependent back-scattering efficiencies by
anisotropic embedded particles25. In principle it has been demonstrated that PS-OCT has the
ability to measure the dichroism/diattenuation of biological samples in addition to the
birefringence26. In practice the diattenuation effect seems to be significantly weaker than the
birefringence effect and is frequently ignored in PS-OCT applications.
PS-OCT approaches.
Many designs for polarization-sensitive OCT scanners, i.e. systems that combine OCT
which they quantify the optical anisotropy of the medium. This is a potential source of
confusion, because the effect of birefringence on the OCT image depends on the type of
system one is using. No standard terminology for different PS-OCT systems has yet arisen,
but for the purposes of this article we will define two generic classes of device.
Polarized-light OCT imaging systems. An early and simple method is to adapt a conventional
OCT system to illuminate the specimen with linearly polarised light, the plane of polarization
of which can be manually rotated relative to the sample 18,27. This is sometimes called
“single-detector” PS-OCT, although this term can be confusing because a number of designs for full
“polarimetric” OCT systems that completely characterise the Jones matrix of the tissue
sample have been proposed that also only requires a single light detector28. Polarized-light
OCT systems have the benefit of simplicity but can also present difficulties in data
interpretation because the degree of birefringence is generally not quantified, rather a
qualitative judgement is made about the presence of “polarization-sensitivity” depending on
whether the OCT image brightness or banding pattern appears to change when the plane of
polarization of the incident light is altered. It is also important to note that the reflectivity
image appears quite different to that of the true “polarimetric” OCT systems described next
by virtue of the presence of a banding pattern; the position of the peaks and troughs of this
pattern shift as the plane of polarization is altered but their spacing remains constant. This
pattern arises because this simple approach to PS-OCT implicitly mixes the reflectivity and
phase-retardation information
Polarimetric OCT imaging systems. These systems explicitly separate the image contrast
parameters R(x,z) and δ(x,z) and possibly also determine the local fast-axis orientation. For a
structurally uniform tissue such as tendon, no banding is evident on the structural reflectivity
simplest such system uses a circularly polarized input light beam29, which has the
disadvantage however that it cannot easily be combined with fiber-optics because
birefringence in the fiber itself will distort the circularly polarized light beam thus
illuminating the sample with an arbitrary elliptical polarization state and thus invalidating the
data analysis algorithms. However when used in a bulk-optics system the approach is a simple
of way of determining R(x,z) and δ(x,z) and also the local fast axis orientation30. More
sophisticated schemes, in which more than one incident polarization state is used, have also
been implemented31,32,33. Such schemes have the attraction that the effect of fiber optic
birefringence can be compensated, which means that an endoscopic system can be envisaged
that could be used during arthroscopy. There is at least one commercially available
polarimetric OCT microscope on sale at the time of writing34.
PS-OCT applications to in-vivo cartilage imaging.
Han et al have investigated the mechanisms of implanted chondrocyte integration into healthy
tissue in a rabbit model using structural OCT35 and Pan et al also noted the birefringent
properties of normal porcine hyaline cartilage tissue using a polarized-light OCT system27.
Chu et al have performed cadaveric and in-vivo human studies using a similar system and
demonstrated that the absence of birefringence correlates with a reduced capacity for
proteoglycan synthesis in response to IGF-1 stimulation36. Interestingly, this early
degenerative change was demonstrated by PS-OCT at a potentially reversible stage.
3-D collagen structure determination using PS-OCT.
Much of the discussion concerning the use of PS-OCT to image cartilage centers on the
microscopic ordering of collagen fibers within the tissue based on the presence or absence of
measurable intrinsic birefringence. Our work on equine cartilage however has emphasised
that PS-OCT measures what we term the “apparent birefringence” which is determined not
only by the biochemical constitution of the tissue but also by the 3-D structural arrangement
of the fibres23, an observation that has subsequently been confirmed by Xie et al37, who went
on to compare the 3-D structure of cartilage and meniscus using an approach similar to ours.
Crudely modelling the birefringence properties of hyaline cartilage as being those of a
uniaxial birefringent crystal then one sees intuitively that the apparent birefringence vanishes
in cases where the dominant fibre orientation lies parallel to the beam propagation direction
and reaches a maximum when these directions are mutually orthogonal. This can be formally
described by the equation:
2 o c 2 2 e c 2 2 cos sin 1 n n n θ θ + = Equation 2
where the apparent birefringence (i.e. that directly measured by PS-OCT) is given by
∆n = n−no, whereas the more fundamental underlying property is the “true birefringence”
ne−no. θc denotes the angle between the light propagation direction and the fibre long-axis.
We have further demonstrated how it is possible to reconstruct both the 3-D orientation of
fibres and the true birefringence by combining measurements of apparent birefringence made
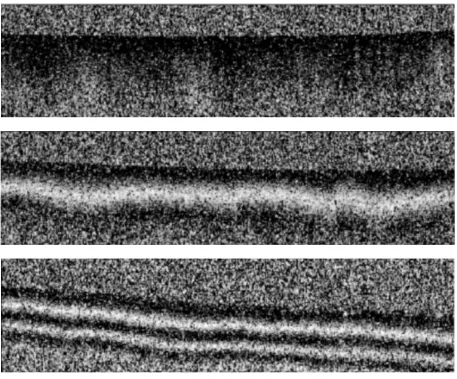
at a number of different illumination directions. Figure 3 (reproduced from38 with
permission) shows how the characteristic “banded” PS-OCT retardation image changes as one
alters the incident beam illumination direction. With the beam perpendicular to the surface, no
bands are evident, indicating a low value for ∆n. In the absence of further information, this
could indicate that ne−nois low but, by Equation 2, it could be that ne−nois large but θc≈ 0.
and bottom rows) now show a banded appearance indicative of a higher value for ∆n. This is
now only consistent with near-vertically oriented fibres and further, the asymmetry of the
images taken with equal but opposite beam inclination angles suggests that the fibres are not
perfectly vertical but are tilted somewhat. These observations motivated us to develop what
we have termed “variable-incidence-angle PS-OCT”, in which multiple estimates of ∆n taken
with multiple illumination directions are least-squares fitted using Equation 2 to estimate the
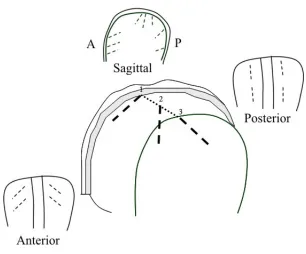
orientation angles of the fibres (polar angles θ and φ) and ne−no. Figure 4 (reproduced from38
with permission) shows the results of this analysis applied to a quasi 2-D problem (i.e. using
illumination directions confined to one plane and assuming that the fibres lie in this same
plane) whereas Figure 5 (reproduced from39, with permission) shows a true 3-D determination obtained by using illumination directions in two orthogonal planes. Note
especially how the 3-D orientation of the fibres changes from anterior to posterior orientation
as one moves along the “sagittal ridge” in a medial to lateral direction and also how the fibres
apparently change in azimuthal orientation from being parallel to the ridge in the posterior to
inclined in the anterior.
On-line monitoring of tissue-engineered cartilage constructs.
Cartilage constructs are currently being developed using a variety of approaches, but in
general all involve constructing some form of acellular scaffold into which cells are seeded. It
is hoped that the cells are then able to actively generate new matrix proteins such as collagen
and that ultimately this regenerated collagen can assume the role of the native ECM that has
been lost due to degeneration. An interesting question then arises relating to the scaffold
architecture of the construct. Many scaffold production techniques produce randomly-aligned
fibres (e.g. electrospinning), others are capable of generating directionally aligned fibres,
example, Moutos et al demonstrated cartilage scaffolds created using a 3-D microscale
weaving technique that is capable of producing scaffolds with anisotropic mechanical
properties41. In addition, there is evidence that external stimuli such as mechanical loading can
promote aligned collagen fibres in tissues such as tendon and mathematical models have been
developed to predict the causal relationship between applied stress and collagen alignment in
cartilage42. So the possibility exists to try to create a synthetic cartilage construct whose
collagen alignment matches that of the native tissue at the site of implantation. To achieve this
end we clearly need a technique that can quantify the 3-D collagen structure of both native
and tissue engineered cartilage. It would be beneficial to know roughly how the collagen
fibres are oriented at various sites in normal cartilage so that an ‘atlas’ can be created. This
3-D orientation distribution is likely to reflect the 3-D stress distribution that the cartilage
experiences in normal circumstances. Then a technique that could monitor the production of
collagen in a bioreactor would allow the continuous monitoring of how well the tissue
construct ECM matches that of the host tissue, during the development of the construct. Many
techniques exist that can determine collagen fibre organisation in tissues, including SAXS43,
diffusion-tensor MRI44 and FT-IR polarimetry45 but none are well adapted to the needs of
on-line monitoring. In this application, an ideal method should possess the following
characteristics:
A. Provide full 3-D information on the orientation of the collagen fibres to a depth of up
to 1 mm in biological tissue, non-destructively and with a depth-resolution of around 5-10
microns.
B. Rapid imaging speeds (fractions of a second per 2-D scan).
C. Use non-ionising radiation, making it potentially applicable in vivo.
D. Have the potential to be applied endoscopically e.g. during arthroscopic examination
From the previous discussions we suggest that PS-OCT, especially if extended to true 3-D
fiber orientation determination using the variable-incidence-angle approach, may be ideally
suited to fulfilling this need.
Real-time cartilage histology using non-linear microscopy.
During a procedure such as ACI, the orthopaedic surgeon must remove diseased cartilage
from the site of the lesion. In order to gauge the extent of tissue to remove, the surgeon relies
on visual assessment of the cartilage surface, however this assessment is of necessity
subjective. It would be potentially of benefit if the surgeon could have a real-time quantitative
assessment of the integrity of the cartilage extracellular matrix (ECM) of the tissue removed,
so that the degree of resection is minimized.
Conventionally, tissue viability is assessed by histology however this process is laborious and
operator-dependent as it generally requires chemical staining of the samples before observing
them under a light-microscope. To make real-time histology viable requires a microscopy
technique that uses endogenous rather than exogenous contrast. Preferably it would also be
sensitive to cell morphology and extracellular matrix structure and yield information deep into
the tissue without requiring complicated and time-consuming mechanical sectioning.
A tool well suited to meet these requirements is non-linear microscopy, especially and
second-harmonic generation microscopy. Second-harmonic generation is a non-linear optical
phenomenon that has been observed in collagen-rich tissues for several decades46. The basis
of the technique is the observation that, at sufficiently high light intensities, the dielectric
susceptibility becomes a non-linear function of the applied field, so that the bulk polarizability
(
+ + +K)
= ij j ijk j k ijkl j k l
i E E E E E E
P ε0 χ(1) χ(2) χ(3)
Equation 3
When the second order susceptibility tensor χ(2) becomes significant, an applied field
oscillating sinusoidally at angular frequency ω gives rise to an emitted field with angular
frequency 2ω.
Interestingly the phenomenon is sensitive not just to the abundance (i.e. volume fraction) of
collagen fibrils within the optical focus but also on their degree of sub-microscopic spatial
ordering. This is because SHG is a coherent optical phenomenon that requires an absence of
mirror-inversion symmetry in order to occur and hence is maximally efficient when the focal
volume contains asymmetric molecular oscillators that are aligned in the same direction in
space. In addition, the polarization state of the emitted SHG radiation gives direct information
on the dominant alignment of collagen fibres on sub-micron scales. Freund et al have shown
that for biological tissues showing a strong uniaxial structure (i.e. C∞ symmetry) excited by
radiation with energy well below that of resonant electronic transitions (so that Kleinmann
symmetry can be assumed) then the expression for the polarization state of emitted SHG
radiation simplifies considerably. For fibres lying in the x-z plane and uniaxially oriented in
the z-direction, illuminated by a laser beam propagating in the y-direction whose field is E(1), the induced second-order polarizability P(2) simplifies to:-
( ) ( ) ( )
( ) ( ) ( )
2 2
2 1 1
2 1 1
2
z z x
x x z
P E E
P E E
ρ
= +
= ⋅
,
Equation 4
where ρ
(
=χzzz( )2 χzxx( )2)
, by virtue of the symmetries assumed, completely defines the fullsecond-order susceptibility tensor and typically takes on the value of 1.8 for rat-tail tendon46.
that if the sample is illuminated with linearly polarized light, with an angle α between the
z-axis the plane-of-polarization, then the x and z components of the emitted SHG field are
( )2
( )
2 2 2 ( )2( )
[
]
2cos sin sin 2
z x
I α ∝ρ α+ α I α ∝ α ,
Equation 5
and hence if the total emitted intensity Itot( )2
( )
α =I( )z2( )
α +Ix( )2( )
α is recorded versus α, thenfor ρ≈ 2 the signal will display a well-defined global minimum when α = 90° or 270°, which
permits a determination of the orientation of the collagen fibres. Also, a crude determination
of the value of ρ is possible, for example if ρ≈ 0 then the signal will display four minima of
roughly equal amplitude per 360° instead of two.
Two-photon fluorescence is an inelastic optical scattering process which is fundamentally
incoherent. It does not give direct information on collagen fibre orientation but adds a rich
gamut of biochemical information. Two-photon autofluorescence has been shown to reveal
elastin content47 as well as locating cell nuclei and mitochondria and potentially yielding
information on the redox potential of the cells48. Conveniently, both SHG and TPEF can be
performed on the same microscope platform, requiring only a simple filter change to switch
between the two modalities.
It should be stressed that neither SHG or TPEF microscopy are good candidates for in-situ
monitoring of articular cartilage, because the mean optical powers needed are high and
because the optical platform is intrinsically bulky and hard to combine with minimally
invasive fiber optic technology. Also the requirement to maintain a high peak power in the
focal spot means that practically it is hard to image deeper then a 100-200 microns even using
technique may find a niche in providing on-line histological assessment of the cellular
morphology and collagen microstructure in the superficial layer of cartilage sections excised
by a surgeon during procedures such as ACI. As a technique it is thus worthy of assessment
and to this end it is important to understand the nature of the signals produced by both normal
and diseased cartilage.
The first systematic study of articular cartilage using non-linear microscopy was performed
by Yeh et al 49. Using second-harmonic generation microscopy they showed that the
extracellular matrix of normal bovine articular hyaline cartilage gives rise to significant
amounts of second harmonic light but little two-photon fluorescence when excited with light
of wavelength above 800 nm. However the signal from normal tissue did not appear to be
strongly polarization-sensitive, suggesting that this tissue apparently lacks a unique fibre
alignment direction. In contrast, the fibrocartilage deposited at sites of osteoarthritic change
did produce a signal with a pronounced polarization-sensitivity.
Polarization-sensitivity of SHG signals from articular cartilage.
Both the morphology and the polarization-sensitivity of cartilage SHG has recently been
studied in more detail in our own laboratory by Mansfield et al, using equine rather than
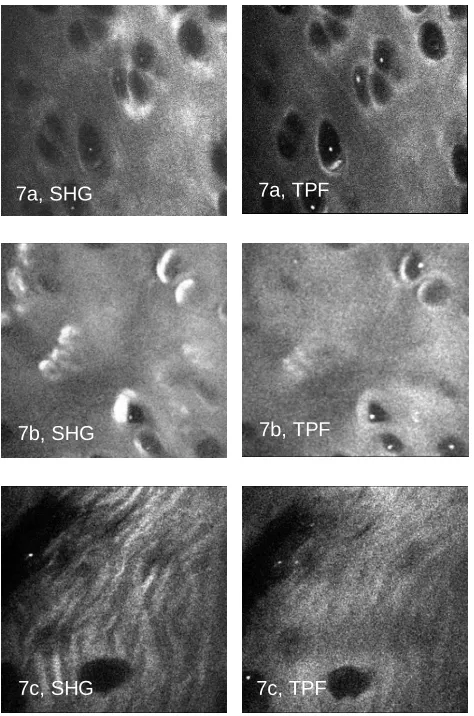
bovine samples50. Figure 6 shows images of SHG and fluorescence taken from various sites corresponding to normal (site a), osteoarthritic (site c) and “transitional” i.e. close to a visible
lesion but not itself displaying disruption of the surface (site b). Note how the morphological
appearance of both the matrix and the chondrocytes changes markedly in osteoarthritis. The
matrix of fibrocartilage is noticeably more “rippled” than that of normal or transitional
bright halo vanishes in the highly degenerated fibrocartilage. Using a half-wave plate to rotate
the incident polarization direction and an unpolarized light detector, curves of Itot( )2
( )
α can beproduced at various sites on the equine third metacarpophalangeal joint, as functions of depth.
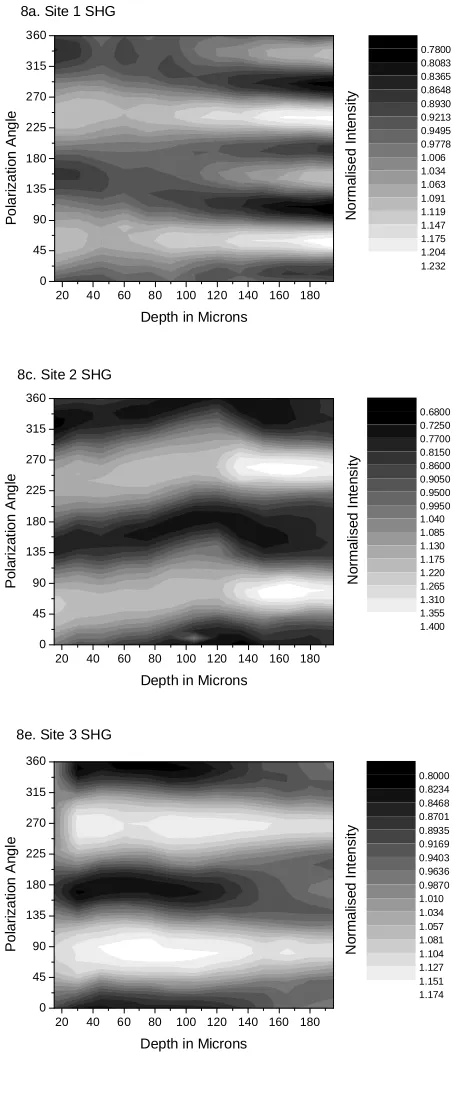
Figure 7 shows the results. (Note that for the purposes of clarity the profiles at different depths have been normalized to the same mean intensity and the ‘Polarization angle’ is
actually ≈α+90°, with some uncertainty due to the difficulty in establishing the absolute fibre
orientation in superficial cartilage by independent means such as a ‘split-line’ experiment). A
key observation is that even in visibly normal equine metacarpophalangeal cartilage (upper
graph), there is a marked polarization sensitivity in the SHG signal, qualitatively similar to
that obtained from rat-tail tendon. This is in contrast to Yeh et al’s findings for bovine
femoral/tibial/patellar cartilage. Furthermore, there is also a change in the angular pattern with
depth, such that the usual double-peaked graph tends to a more complicated quadruple-peaked
graph at greater depths, with the surface maxima being preserved whilst the surface minima
become new maxima. Given that the number of global minima predicted by Equation 5
increases to four when ρ falls towards unity, one might be tempted to interpret this change as
a depth-dependent structural variation in the effective value of ρ, possibly due to one moving
from the superficial zone of well-ordered fibres into the deeper transitional region, where the
fibre order is more random. However this explanation is undermined by the fact that Equation
5 predicts that the minima would remain in the same location whilst the maxima would
become new minima, the opposite of what is observed. Another possible interpretation of this
result is that accumulated tissue birefringence causes a change in the polarization-state of the
light with increasing depth and thus distorts the pattern of SHG signal versus polarization
angle. This effect has been modelled previously51, although the precise effect on the
polarization curve was not explicitly noted. A simple model for the effect of birefringence on
focussed beam. Although clearly not realistic in the case of SHG microscopy, it is
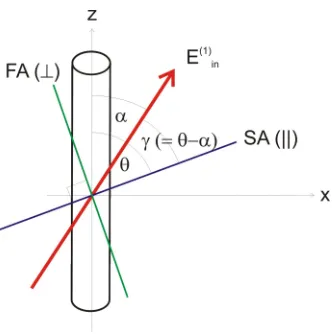
nevertheless helpful to gain a simple insight. Consider the geometry shown in Figure 8. Following the conventions used by Freund et al46, we place the long-axis of the
SHG-generating fibrillar structure along the z-axis and orient the incident electric field vector at an
angle to the z-axis and in the x-z plane. To include birefringence we further assume that this
incident field propagates through a birefringent plate whose slow axis (SA) makes an angle θ
to the z-axis before irradiating the fibril. Note that a-priori one might expect θ to equal zero
as the long-axis of collagen fibres corresponds to the optical slow axis22. However to keep the
discussion general we will include the possibility that θ is not zero, which could potentially
occur if SHG generation arises from structures of a smaller spatial scale than those producing
linear birefringence. To calculate the SHG signal we will follow the procedure of Freund et
al. In the absence of birefringence the steps are:
1. Resolve E(1) along z and x-axes, yielding components E(1)z = |E(1)| cos α and
E(1)x = |E(1)| sin α respectively.
2. Calculate the 2nd-order polarisations along z and x via the equations
P(2)z = ρ[E(1)z]2+[E(1)x]2
P(2)x = 2E(1)x•E(1)z
Equation 6
3. Calculate the unpolarised SHG intensity using ISHG∝ |P(2)x|2 + |P(2)z|2
To account for birefringence, which introduces a relative phase retardation δ (radians) to the
field component polarized along SA, we simply adapt step 1 of the above procedure by
resolving the incident E-field parallel (||) and orthogonal (⊥) to SA, applying a phase factor
exp(iδ) to the E|| component, resolving the new E-field along z and x and then applying the
( ) ( )
( )
( ) ( )
( ) ( ) ( ) ( )
(
( )
)
( ) ( ) θ ( ) θ ( )
(
θ γ( )
δ θ γ)
γ θ δ γ θ θ θ γ δ γ sin cos exp cos sin cos sin sin sin exp cos cos sin cos sin exp cos 1 1 1 || 1 1 1 1 || 1 1 1 1 1 || ⋅ − ⋅ ⋅ = − = ⋅ + ⋅ ⋅ = + = = ⋅ = ⊥ ⊥ ⊥ i E E E E i E E E E E E i E E x zFor simplicity, taking E(1) to be 1.0…
( )
(
)
( )
(
)
( )
(
)
(
(
)
)
1
cos cos exp sin sin
exp 1
cos cos cos 2
2
z
E i
i
θ θ α δ θ θ α
δ
α α θ α
= ⋅ − ⋅ + ⋅ −
−
= + + −
Likewise
( ) = α +
(
( )
δ −)
(
sinα+sin(
2θ −α)
)
2 1 exp sin 1 i Ex Equation 7
The calculation of ISHG then follows using steps 2 and 3 above. Note that δ can be complex, in
which case the imaginary part represents the “diattenuance” of the tissue i.e. the differential
absorption of light polarized along the direction SA relative to that of light polarized
orthogonal to this direction25. We have used fluorescence polarimetry to quantify Im(δ) for
both equine tendon and equine hyaline cartilage, finding apparent values of 2.65×10⁻⁴ for
tendon but significantly less for cartilage50. We have previously estimated Re(δ) for equine
tendon38, obtaining a value of 4×10⁻³ and thus suggesting that realistic values for Im(δ)/Re(δ)
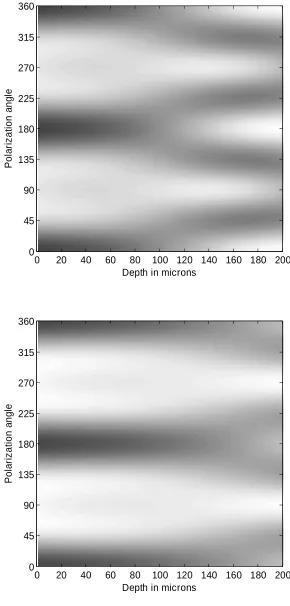
for collagen-rich connective tissues might lie in the range 0 to 0.06. Figure 9 shows simulated
versions of Figure 7, calculated using Equation 6 and Equation 7, with the profiles at different depths normalized to the same mean intensity.
Both images are calculated using ρ = 1.8, θ = 0° and Im(δ)/Re(δ) = 0.2. The upper image is
calculated with Re(δ) = 1.2×10⁻³ so that a quarter waveplate is accumulated by a depth of 170
Figure 7 (sites 1 and 3), with the desired change from 2 to 4 minima and the transformation of the surface minima to maxima with increasing depth for the upper image and the
maintenance of two minima over most of the depth in the lower image.
The implication of these data seems to be that both morphological and polarimetric
information can be obtained using SHG microscopy on normal and diseased cartilage and that
distinct differences exist between the normal and abnormal tissues. Polarimetric data suggests
a fall in birefringence at sites of both advanced osteoarthritic change (i.e. a visibly disrupted
surface) and earlier stages of degeneration, when no surface disruption is evident. Hence we
suggest that non-linear microscopy is worthy of more detailed study as a potential tool for
performing real-time histology of excised articular cartilage.
Discussion and conclusions.
Polarized light microscopy was one of the earliest physical techniques to be used to study the
morphology of collagen-rich biological tissues. However its use in recent years has
diminished as x-ray diffraction has become the workhorse of structural biology whereas
clinical imaging demands tools that can be applied in-vivo to intact, unstained tissues. The use
of optical polarimetry to study connective tissues is however undergoing a revival due to the
introduction over the last 10 years of new imaging technologies.
The physical anisotropy of connective tissues such as articular cartilage give rise to strongly
anisotropic optical properties such as linear birefringence and second-harmonic generation.
With the advent of non-destructive “optical biopsy” tools such as PS-OCT and SHG
osteoarthritis. In this article we have reviewed these two imaging platforms and have
speculated on potential roles that they may play in the treatment of pathologies of the
extracellular matrix such as osteoarthritis. We have focussed on treatments for osteoarthritis
that involve the in-situ replacement of damaged cartilage, such as ACI or tissue engineering,
and have highlighted ways that these optical tools might potentially benefit such treatments.
PS-OCT is a tool ideally suited to monitoring the development and integration of 3-D tissue
engineered cartilage constructs both in the bioreactor and in-situ. We have noted here how the
complicated 3-D structure of cartilage collagen requires the use of multiple illumination
directions, otherwise the resulting apparent birefringence can grossly underestimate the true
birefringence. By fully developing this method, one can envisage a rapid, non-destructive
optical technique yielding depth-resolved information on the 3-D zonal structure of such
constructs and allowing a real-time comparison of this with that of the native cartilage at the
site of implantation. This could bring tissue engineering of cartilage to a new level of
refinement.
SHG microscopy, and its close relative TPEF microscopy, has been shown to provide images
that display clear morphological differences when comparing normal cartilage with visually
damaged cartilage and also cartilage located in close proximity to the damaged area. Both the
gross structure of the extracellular matrix and the appearance of the pericellular matrix
surrounding the chondrocytes display differences, with a strongly fibrillated appearance of the
extracellular matrix characterising the osteoarthritic lesion and enhanced pericellular image
brightness apparently characterising earlier stage degeneration. As SHG microscopes become
lasers), SHG microscopy may find a role in the real-time histological assessment of excised
articular cartilage.
The whole field has potential for further development, as improved technology improves
imaging speeds and reduces costs. Of equal importance, improved data analysis and more
rigorous comparisons with gold-standard techniques will deepen our understanding of the
origin and correct interpretation of the polarimetric signals.
ACKNOWLEDGMENTS.
This article summarises the work of many collaborators. I am indebted to the following
people for helpful discussions and for contributing to the work described herein: Marco
Bonesi, Aileen Crawford, Sergey Gangnus, Paul Hatton, James Jacobs, Karen Knapp, Jessica
Mansfield, Igor Meglinski, Julian Moger, Roy Sambles, Nadya Ugryumova and Peter
Winlove. Generous financial support from the Coote Fund, the Arthritis Research Campaign,
the Engineering and Physical Sciences Research Council, the Medical Research Council and
Figure Captions
Figure 1The orientation of collagen fibrils in normal articular cartilage, as expounded in the
classic “arcade” model of Benninghoff. Collagen fibres arise from the subchondral bone
where they are radially oriented, curve over to lie parallel to the cartilage surface in the
superficial “tangential” layer then descend back to the underlying bone. The tangential layer
is generally less than 100 microns thick, whilst the majority of the full thickness of the
cartilage (1 mm or so) is occupied by the transitional and radial zones.
Figure 2. A contemporary view of collagen organisation in cartilage, based on cryofracture SEM imaging of cartilage in 3 mutually orthogonal planes, one of which is determined by the
local “split-line” direction (reproduced from Jeffrey et al). The collagen fibres arise from the
bone and curve over to form a lamellar network in the tangential zone, but do not descend
back to the bone.
Figure 3. PS-OCT retardance images of equine cartilage as a function of the incident beam
polar angle. The lack of banding in the upper image (corresponding to a vertical incident
beam) suggests that the collagen fibres are oriented close to the vertical also, as confirmed by
the appearance of stronger banding (i.e. birefringence) for angles of incidence away from the
vertical (middle and lower curves). Reproduced from38 with permission.
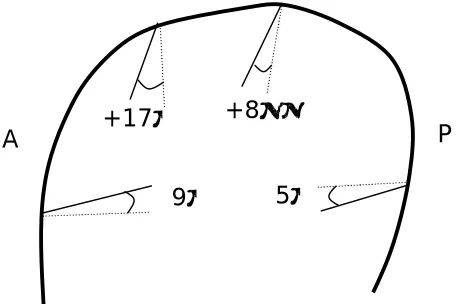
Figure 4.Fibre polar angles at various point around the sagittal ridge of the equine third
Figure 5.Schematic representation of 3-D structure of cartilage fibres in the equine third
metacarpophalangeal joint as derived from multi-angled PS-OCT measurements. Reproduced
from38 with permission.
Figure 6.Illustrating the morphological appearance of normal (upper row), diseased (low
row) and intermediate (middle row) of SHG (left column) and TPF (right column) images of
equine cartilage. (Reproduced from50 with permission).
Figure 7.Total SHG intensity versus polarization angle, for normal (upper row), diseased
(lower row) and intermediate (middle row) samples of equine cartilage (Reproduced from50).
Figure 8.Schematic showing the relationship between a collagen fibril (oriented along the
z-axis), the applied electric field E(1)in and the fast-axis (FA) of the birefringent material lying
between the fibril and theincident laser beam.The incident electric field vector subtends an
angle α to the fibrillar long axis. The birefringence slow-axis subtends an angle θ (for
completeness, not necessarily equal to zero) to the z-axis.
Figure 9. Simulated versions of Figure 7 using Equation 6 and Equation 7 with parameters
ρ = 1.8, θ = 0, Im(δ)/Re(δ) = 0.2 and Re(δ) equivalent to a quarter-wave plate at depth 170
References.
1 Cole BJ, and M D'Amato “Autologous chondrocyte implantation”, Operative Techniques in
Orthopaedics, 11(2): pp 115-131 (2001).
2 MacNeil S, “Progress and opportunities for tissue-engineered skin”, Nature 445(7130):
874-880 (2007).
3 Atkinson BL, Fantle KS, Benedict JJ, Huffer WE, GutierrezHartmann A, “Combination of
osteoinductive bone proteins differentiates mesenchymal C3H/10T1/2 cells specifically to the
cartilage lineage”, JOURNAL OF CELLULAR BIOCHEMISTRY 65(3), 325-339 (1997).
4 Canceddaa R, Dozina B, Giannonia P, Quarto R, “Tissue engineering and cell therapy of
cartilage and bone”, Matrix Biology 22 81–91 (2003).
5 Lahiji A, Sohrabi A, Hungerford DS, Frondoza CG, “Chitosan supports the expression of
extracellular matrix proteins in human osteoblasts and chondrocytes”, JOURNAL OF
BIOMEDICAL MATERIALS RESEARCH 51(4), 586-595 (2000).
6 Wang YZ, Blasioli DJ, Kim HJ, Kim HS, Kaplan DL , “Cartilage tissue engineering with
silk scaffolds and human articular chondrocytes”, BIOMATERIALS 27(25), 4434-4442
(2006).
7 Hielscher AH, Klose AD, Scheel AK, Moa-Anderson B, Backhaus M, Netz U, Beuthan J,
“Sagittal laser optical tomography for imaging of rheumatoid finger joints”, Phys. Med. Biol.
49(7): 1147-1163 (2004).
8 Wang XD, Chamberland DL, Carson PL, Fowlkes JB, Bude RO, Jamadar DA, Roessler BJ
“Imaging of joints with laser-based photoacoustic tomography: An animal study”, MEDICAL
9 Studer RK and Chu CR, “p38 MAPK and COX2 inhibition modulate human chondrocyte
response to TGF-beta,” J. Orthop. Res. 23(2), 454–461 (2005).
10 Benninghoff A, “Form und Bau der Gelenkknorpel in ihren Beziehungen zur Function. II.
Der Aufbau des Gelenkknorpels in seinen Beziehungen zur Function. Zeitschrfit fur
Zellforschung and mikroskopische”, Anatomie 2, 783-862 (1925).
11 Clark JM, “The organisation of collagen fibrils in the superficial zones of articular
cartilage”, J. Anat. 171, pp. 117-130, (1990).
12 Jeffery AK, Blunn GW, Archer CW and Bentley G, “3-Dimensional Collagen Architecture
In Bovine Articular-Cartilage”, JOURNAL OF BONE AND JOINT SURGERY-BRITISH
VOLUME 73(5): 795-801 (1991).
13 Ortmann R, “Use of polarized light for quantitative determination of the adjustment of the
tangential fibres in articular cartilage”. Anatomy and Embryology 148, 109-120 (1975).
14 de Boer JF, Milner TE, van Gemert, MJC and Nelson JS, “Two-dimensional birefringence
imaging in biological tissue by polarization-sensitive optical coherence tomography”, Optics
Letters 22(12): 934-936 (1997).
15 de Boer JF, Milner TE and Nelson JS, “Determination of the depth-resolved Stokes
parameters of light backscattered from turbid media by use of polarization-sensitive optical
coherence tomography”, Optics Letters24(5): 300-302 (1999).
16 Matcher SJ, Winlove CP and Gangnus SV. “The collagen structure of bovine
intervertebral disc studied using polarization sensitive optical coherence tomography”, Phys.
Med. Biol.49: 1295 – 306 (2004).
17 Herrmann JM, Pitris C, Bouma BE, Boppart SA, Jesser CA, Stamper DL, Fujimoto JG and
Brezinski ME, “High resolution imaging of normal and osteoarthritic cartilage with optical
18 Drexler W, Stamper D, Jesser C, Li XD, Pitris C, Saunders K, Martin S, Lodge MB,
Fujimoto JG, Brezinski ME, “Correlation of collagen organization with polarization sensitive
imaging of in vitro cartilage: Implications for osteoarthritis”, JOURNAL OF
RHEUMATOLOGY 28(6):1311-1318 (2001).
19 de Boer JF, Milner TE, “Review of polarization sensitive optical coherence tomography
and Stokes vector determination”, JOURNAL OF BIOMEDICAL OPTICS 7(3): 359-371
(2002).
20 Zysk AM, Nguyen FT, Oldenburg AL, Marks DL, Boppart SA “Optical coherence
tomography: a review of clinical development from bench to bedside”, J. Biomed. Opt. 12(5),
051403 (2007).
21 Born and Wolf, “Principles of Optics” Chapter 14. Pergamon Press.
22 Wolman M and Kasten FH. “Polarized light microscopy in the study of the molecular
structure of collagen and reticulin”. Histochemistry, 85:41–9 (1986).
23 Ugryumova N, Attenburrow DP, Winlove CP and Matcher SJ. “The collagen structure of
equine articular cartilage, characterized using polarization-sensitive optical coherence
tomography”, Journal Physics D: Appl. Physics 38: 2612–9 (2005).
24 Hecht E, “Optics” Chapter 8. Addison-Wesley.
25 Kemp NJ, Zaatari HN, Park J, Rylander HG, and Milner TE, “Form-biattenuance in
fibrous tissues measured with polarization-sensitive optical coherence tomography
(PS-OCT)”, Opt. Express13, 4611-4628 (2005).
26 Jiao SL and Wang LHV, “Jones-matrix imaging of biological tissues with
quadruple-channel optical coherence tomography”, JOURNAL OF BIOMEDICAL OPTICS 7(3):
27 Pan Y, Li Z, Xie T and Chu CR, “Hand-held arthroscopic optical coherence tomography
for in vivo high-resolution imaging of articular cartilage”, Journal of Biomedical Optics 8(4):
648–654 (2003).
28 Jiao S, Todorovic´ M, Stoica G, and Wang LV, “Fiber-based polarization-sensitive
Mueller matrix optical coherence tomography with continuous source polarization
modulation”, Applied Optics, 44(26): 5463- 5467 (2005).
29 Hee MR, Huang D, Swanson EA and Fujimoto JG “Polarization-sensitive low-coherence
reflectometer for birefringence characterization and ranging”, JOSA 9(6): 903-908 (1992).
30 Hitzenberger CK, Gotzinger E, Sticker M, Pircher M, Fercher AF, “Measurement and
imaging of birefringence and optic axis orientation by phase resolved polarization sensitive
optical coherence tomography”, OPTICS EXPRESS 9(13): 780-790 (2001).
31 Saxer CE, de Boer JF, Hyle Park B, Zhao Y, Chen Z and Nelson JS, “High-speed
fiber-based polarization-sensitive optical coherence tomography of in vivo human skin.” Opt. Lett.
25(18): 1355-1357 (2000).
32 Zhang J, Guo S, Jung W, Nelson JS, Chen Z, “Determination of birefringence and absolute
optic axis orientation using polarization-sensitive optical coherence tomography with PM
fibers”, 11(24) Opt Express 3262-3270 (2003).
33 Davé DP, Akkin T, and Milner TE, “Polarization-maintaining fiber-based optical
low-coherence “reflectometer for characterization and ranging of birefringence”, Opt. Lett. 28(19),
1775-1777 (2003).
35 CW Han, CR Chu, N Adachi, A Usas, FH Fu, J Huard and Y Pan, “Analysis of rabbit
articular cartilage repair after chondrocyte implantation using optical coherence tomography”,
Osteoarthritis and Cartilage 11: 111–121, (2003).
36 Chu CR, Izzo NJ, Irrgang JJ, Ferretti M, Studer RK, “Clinical diagnosis of potentially
treatable early articular cartilage degeneration using optical coherence tomography”, Journal
of Biomedical Optics 12(5), 051703 (2007).
37 Xie TQ, Guo SG, Zhang J, Chen ZP, Peavy GM “Use of polarization-sensitive optical
coherence tomography to determine the directional polarization sensitivity of articular
cartilage and meniscus”, J. Biomed. Opt. 11:6, 05385RR (2006).
38 Ugryumova N, Gangnus SV and Matcher SJ. “Three-dimensional optic axis determination
using variable-incidence-angle polarization optical coherence tomography”. Optics Letters;
31: 2305-7 (2006).
39 Ugryumova N, Bonesi M and Matcher SJ, “Determination of 3D optic axis orientation in
cartilage by Polarization-Sensitive Optical Coherence Tomography”, Proc. SPIE 6858,
68580I (2008)
40 Zehbe R, Gross U, Schubert H , “Oriented collagen-based/hydroxyapatite matrices for
articular cartilage replacement”, Bioceramics 16: Key Engineering Materials, 254-2:
1083-1086 (2004).
41 Moutos FT, Freed LE and Guilak F, “A biomimetic three-dimensional woven composite
scaffold for functional tissue engineering of cartilage”, Nature Materials 6: 162-167 (2007).
42 Wilson W, Driessen NJB, van Donkelaar CC, Ito K, “Prediction of collagen orientation in
articular cartilage by a collagen remodeling algorithm”, Osteoarthritis Cartilage 14 (11):
43 Moger CJ , Barrett R , Bleuet P , Bradley DA , Ellis RE , Green EM et al. Regional
variations of collagen orientation in normal and diseased articular cartilage and subchondral
bone determined using small angle X-ray scattering (SAXS). Osteoarthritis Cartilage; 15:
682-7 (2007).
44 Denga X, Farley M, Nieminena MT, Gray M, Burstein D, “Diffusion tensor imaging of
native and degenerated human articular cartilage”, Magnetic Resonance Imaging 25: 168–
171, (2007).
45 Bi X, Li G, Doty SB and Camacho NP, “A novel method for determination of collagen
orientation in cartilage by Fourier transform infrared imaging spectroscopy (FT-IRIS)”,
Osteoarthritis Cartilage13,1050-8 (2005).
46 Freund I, Deutsch M, and Sprecher A, “Connective-Tissue Polarity - Optical
2nd-Harmonic Microscopy, Crossed-Beam Summation, and Small-Angle Scattering in Rat-Tail
Tendon”, Biophys. J. 50, 693-712 (1986).
47 So PTC, Kim H and Kochevar IE , “Two-photon deep tissue ex vivo imaging of mouse
dermal and subcutaneous structures” Opt. Express 3(9), 339-350 (1998).
48 Huang S, Heikal AA, and Webb WW, “Two-Photon Fluorescence Spectroscopy and
Microscopy of NAD(P)H and Flavoprotein”, Biophys. J. 82, 2811–2825 (2002).
49 Yeh AT, Hammer-Wilson MJ, Van Sickle DC, Benton HP, Zoumi A, Tromberg BJ, and
Peavy GM, "Nonlinear optical microscopy of articular cartilage," Osteoarthritis Cartilage 13,
345-352 (2005),
50 Mansfield JC, Winlove CP, Moger JM, Matcher SJ, “Collagen Fibre Arrangement in
Normal and Diseased Cartilage studied by Polarization Sensitive Non-Linear Microscopy”, J.
51 Stoller P, Reiser KM, Celliers PM and Rubenchik AM, “Polarization-Modulated Second
Figures
Figure 1
Tidemark
Calcified
Cartilage Superficial
zone Transitional
zone
Radial
zone
Subchondral bone
Figure 4
−5°
+17° +8°
−9°
Figure 6
Healthy region of cartilage: SHG and TPF images are Region nearing the lesion histology shows normal arcade structure of matrix is being lost: SHG and TPF Lesion area: very strong birefringence due
to high collagen content: images in the Region with healthy looking
matrix and cells in the TPF and SHG images similar to those
7d. Histological slice of the lesion viewed between crossed polarizers
7b, TPF 7b, TPF/SHG
7a, SHG
7b, SHG
7a, TPF 7a, TPF/SHG
7c, SHG
7c, TPF 7c, TPF/SHG
Figure 7
20 40 60 80 100 120 140 160 180 0 45 90 135 180 225 270 315 360
Depth in Microns
P o la ri z a ti o n A n g le 0.8000 0.8234 0.8468 0.8701 0.8935 0.9169 0.9403 0.9636 0.9870 1.010 1.034 1.057 1.081 1.104 1.127 1.151 1.174 8e. Site 3 SHG
N o rm a lis e d I n te n s it y
20 40 60 80 100 120 140 160 180 0 45 90 135 180 225 270 315 360
Depth in Microns
P o la ri z a ti o n A n g le 0.6800 0.7250 0.7700 0.8150 0.8600 0.9050 0.9500 0.9950 1.040 1.085 1.130 1.175 1.220 1.265 1.310 1.355 1.400 N o rm a li s e d I n te n s it y
8c. Site 2 SHG
20 40 60 80 100 120 140 160 180 0 45 90 135 180 225 270 315 360
Depth in Microns
P o la ri z a ti o n A n g le 0.7800 0.8083 0.8365 0.8648 0.8930 0.9213 0.9495 0.9778 1.006 1.034 1.063 1.091 1.119 1.147 1.175 1.204 1.232 8a. Site 1 SHG
Depth in microns P o la ri z a ti o n a n g le
0 20 40 60 80 100 120 140 160 180 200 0 45 90 135 180 225 270 315 360
Depth in microns
P o la ri z a ti o n a n g le
[image:44.595.105.395.73.679.2]