Copyright © 2004, American Society for Microbiology. All Rights Reserved.
Specific Histone Tail Modification and Not DNA Methylation Is a
Determinant of Herpes Simplex Virus Type 1 Latent
Gene Expression
Nicole J. Kubat,† Robert K. Tran,† Peterjon McAnany, and David C. Bloom*
Department of Molecular Genetics and Microbiology, University of Florida College of Medicine, Gainesville, Florida 32610-0266
Received 5 August 2003/Accepted 6 October 2003
During herpes simplex virus type 1 (HSV-1) latency, gene expression is tightly repressed except for the latency-associated transcript (LAT). The mechanistic basis for this repression is unknown, but its global nature suggests regulation by an epigenetic mechanism such as DNA methylation. Previous work demonstrated that latent HSV-1 genomes are not extensively methylated, but these studies lacked the resolution to examine methylation of individual CpGs that could repress transcription from individual promoters during latency. To address this point, we employed established models to predict genomic regions with the highest probability of being methylated and, using bisulfite sequencing, analyzed the methylation profiles of these regions. We found no significant methylation of latent DNA isolated from mouse dorsal root ganglia in any of the regions examined, including the ICP4 and LAT promoters. This analysis indicates that methylation is unlikely to play a major role in regulating HSV-1 latent gene expression. Subsequently we focused on differential histone modification as another epigenetic mechanism that could regulate latent transcription. Chromatin immuno-precipitation analysis of the latent HSV-1 DNA repeat regions demonstrated that a portion of the LAT region is associated with histone H3 acetylated at lysines 9 and 14, consistent with a euchromatic and nonrepressed structure. In contrast, the chromatin associated with the HSV-1 DNA polymerase gene located in the unique long segment was not enriched in H3 acetylated at lysines 9 and 14, suggesting a transcriptionally inactive structure. These data suggest that histone composition may be a major regulatory determinant of HSV latency.
Herpes simplex virus type 1 (HSV-1) is a double-stranded DNA virus that establishes a lifelong latent infection within sensory neurons (for a review, see reference 32). During la-tency the 152-kb genome is maintained as a circular episome associated with nucleosomes (12). HSV-1 latent gene expres-sion is tightly repressed except for the latency-associated tran-script (LAT) (31). While there is some evidence for low-level transcription from lytic promoters during latency (8, 21), it has been suggested that these transcripts may largely be due to an occasional spontaneously reactivating neuron (16). The most striking illustration of the tight repression of latent HSV-1 transcription is that heterologous promoters (such as the cy-tomegalovirus immediate-early or cellular phosphoglycerate kinase promoter) inserted into the HSV-1 genome are quickly repressed as the virus enters latency (6, 24). The mechanistic basis for this repression, however, is unknown.
In eukaryotes, transcriptional regulation of genes often in-volves epigenetic factors such as DNA methylation or modifi-cations to histone tails. During many viral infections, particu-larly ones causing persistent infections, expression of viral genes also involves an epigenetic component. Therefore, in an effort to further understand transcriptional regulation of the latent HSV-1 genome, we investigated the epigenetic modifi-cations associated with the viral genome during latency. We
first examined the latent viral genome for evidence of DNA
methylation. An earlier study, which involvedHpaII andMspI
digestion of DNA isolated from latently infected mouse brain stems, revealed that the latent HSV-1 DNA was not exten-sively methylated (13). Some differences in restriction
frag-ment migration patterns between theMspI andHpaII digests
were noted; however, due to the resolution of the assay, it was not possible to determine whether these differences were due to incomplete digestion or site-specific methylation. The pos-sibility remained that discrete regions of the HSV-1 genome could exhibit CpG methylation.
To test this possibility, we analyzed the HSV-1 genome by using two independent prediction models to identify regions with a high probability of being methylated. The first approach employed an algorithm used to identify regions of CpG sup-pression (20). Regions of CpG supsup-pression within a genome are thought to result during evolution of a species or virus in which noncritical meCpGs are gradually converted to TpGs via cytosine deamination. Therefore, while most of a genome may be underenriched in CpGs, the existence of CpGs in regions that contain general CpG suppression is often an indication of functional methylation. This method of analysis has been suc-cessfully employed in identifying regions of the Kaposi’s sar-coma-associated herpesvirus (KSHV) genome that are meth-ylated (7). The second prediction method used identifies regions with high CpG-to-GpC ratios. CpG islands, which are large blocks of sequence (often several kilobases in length) exhibiting a high CpG-to-GpC ratio, can be found in the pro-moter regions of certain genes. Occasionally, these regions are targets for CpG methylation, resulting in transcriptional
re-* Corresponding author. Mailing address: Department of Molecular Genetics & Microbiology, Box 100266, University of Florida College of Medicine, Gainesville, FL 32610-0266. Phone: (352) 392-8520. Fax (352) 392-3133. E-mail: [email protected].
† N.J.K. and R.K.T. contributed equally to this paper.
1139
on November 8, 2019 by guest
http://jvi.asm.org/
pression of the gene (2, 11). These two different methods identified several regions within the long and short repeat regions of the viral genome that were predicted to be potential targets of CpG methylation. Using bisulfite sequence analysis, a technique that chemically converts unmethylated cytosines to uracils (17), we analyzed the methylation profiles of four of these regions by using DNA isolated from latently infected mouse dorsal root ganglia (DRG). This analysis failed to iden-tify any evidence of methylation except for an occasional spo-radic unmodified base, suggesting that methylation does not play a significant role in regulating HSV-1 genes during la-tency.
A second epigenetic modification associated with transcrip-tional regulation in eukaryotes is that of posttranslatranscrip-tional ification of histones. Histones are subjected to numerous mod-ifications that are associated with different degrees of transcriptional permissivity (reviewed in reference 19). Acetyl histone H3(K9, K14), for example, is a posttranslationally modified histone associated with transcriptionally permissive chromatin. We therefore sought to determine whether his-tones associated with the HSV-1 genome are marked by this specific modification during viral latency and whether its rela-tive abundance correlates with regions known to be transcrip-tionally repressed or active during latency. Using chromatin immunoprecipitation (ChIP) analysis of latently infected mouse DRG, we have determined that the LAT promoter region is heavily enriched in acetyl histone H3(K9, K14) com-pared with the early (HSV DNA polymerase) and immediate-early (ICP27 and ICP4) genes. This suggests that specific his-tone modifications may be an important determinant of HSV gene expression during latency.
MATERIALS AND METHODS
Viruses and cells.All DNA methylation experiments were performed with a low-passage stock of HSV-1 strain 17syn⫹prepared from a master stock obtained
from J. Stevens. All ChIP experiments were performed with a low-passage stock of HSV-1 strain KOS/M prepared from a master stock obtained from J. Stevens. The virus was amplified and titrated on rabbit skin cells (RSC) by using Eagle’s minimal essential medium (Life Technologies) supplemented with 5% calf serum (Life Technologies) and antibiotics (250 U of penicillin/ml, 250g of strepto-mycin/ml, and 292g ofL-glutamine/ml).
Mouse infections.Four- to 6-week-old female Swiss Webster mice were anes-thetized by Halothane inhalation and pretreated with 0.05 ml of a 10% (wt/vol in water) sterile saline solution injected under each rear footpad. At 4 to 5 h after pretreatment, the mice were anesthetized by intramuscular injection of 0.010 to 0.020 ml of a cocktail of acepromazine (2.5 to 3.75 mg/kg), xylazine (7.5 to 11.5 mg/kg), and ketamine (30 to 45 mg/kg) and infected bilaterally on the rear footpads with 500 to 700 PFU/mouse. The keratinized epithelium was lightly abraded with an emery board, and the inoculum was applied to the feet in a volume of 50l/mouse. The inoculum was spread over the surface of the footpad with the side of the pipette tip, and the virus was allowed to adsorb for 30 to 45 min while the mice remained under anesthesia on their backs. Mice were sacri-ficed at 4 days postinfection (p.i.) for acute time points or at⬎28 days p.i. for latent time points. In the case of the latent time points, care was taken to ensure that the ganglia were removed and processed as quickly as possible postmortem (between 3 and 5 min per mouse).
Determination of CpG suppression values and CpG/GpC ratios.Regions of CpG suppression in the HSV-1 genome were identified by using the formulaP
⫽4fCG/(fC⫹fG)2, wherefis the frequency of the indicated nucleotide(s) andP
represents the CpG suppression value (20). The CpG/GpC ratios were calculated by the formulaR⫽fCG/fGC, wherefis the frequency of the indicated
dinucle-otide pair andRis the resulting ratio. In both cases the entire HSV-1 genome was analyzed as 50-bp segments by using a Visual Basic program, and the results were output to Microsoft Excel and graphed.
Isolation and purification of viral DNA for bisulfite sequence analysis.HSV-1 virion DNA was obtained by infecting RSC with HSV-1 strain 17syn⫹at a
multiplicity of infection of 0.001. At 3 days p.i. the infected RSC were pelleted at 15,000⫻gat 4°C for 40 min. The supernatant was removed, and the cells were resuspended in 1 ml of hypotonic lysis buffer (10 mM Tris [pH 8.0], 10 mM EDTA, 0.5% NP-40, 0.25% sodium deoxycholate) per 4⫻107cells. The
resus-pended cells were then incubated on ice for 5 min, and the supernatant, con-taining the cytoplasmic fraction, was collected by centrifugation at 660⫻gfor 10 min at 4°C. Sodium dodecyl sulfate (SDS) and proteinase K were added to final concentrations of 1% and 1 mg/ml, respectively, and incubated at 37°C overnight. The DNA was then extracted twice with phenol (Roche), once with a mixture of phenol and chloroform-isoamyl alcohol (24:1) (SEVAG) (Fisher), and once with SEVAG alone. The supernatant was ethanol precipitated, and the viral DNA was resuspended in 10 mM Tris-HCl (pH 8.0)–1 mM EDTA (pH 8.0).
Total DNA from acutely and latently infected mouse DRG was prepared as follows. At either 4 days p.i. (acute) or⬎28 days p.i. (latent), mice were sacrificed and lumbosacral ganglia L4 to L6 were removed and homogenized in 0.2 ml of ice-cold 10 mM Tris (pH 7.4)–0.1 M NaCl–1 mM EDTA (pH 8.0) in a 1-ml grinder (Kontes). The homogenate was then transferred to a clean tube, and SDS (Sigma) and proteinase K (Roche) were added to final concentrations of 1% and 1 mg/ml, respectively. The sample was then incubated at 50°C overnight. The following day, the sample was extracted with a 1:1 mixture of phenol-SEVAG, followed by an extraction with SEVAG alone. The DNA was then ethanol precipitated, and the DNA pellet was resuspended in 50l of 50 mM Tris (pH 8.0)–1 mM EDTA (pH 8.0).
Bisulfite treatment of DNA.Bisulfite modification of the genomic viral DNA was performed by a procedure modified from that of Frommer et al. (17). One to 3 micrograms of each DNA sample in 50 l of distilled water was first denatured by adding 5.5l in 0.3 M NaOH and incubating for 30 min at 42°C. The sample was then reacted with bisulfite by treatment with 520l of 3.6 M sodium bisulfite (Sigma) and 30l of 10 mM hydroquinone (Sigma) (pH 5.0) for 16 h at 54°C. The sample was then purified with the Wizard DNA Clean-Up kit (Promega) and then desulfonated by adding NaOH to a final concentration of 0.3 M and incubating for 10 min at room temperature. The solution was neutralized by adding 66l of 5 M ammonium acetate and precipitated with 100% ethanol and 1.2g of glycogen for 1 h at⫺80°C. The DNA was pelleted at 20,800⫻g
(Eppendorf centrifuge) for 30 min at 4°C, washed with chilled (⫺70°C) 70% ethanol, and pelleted again by centrifugation at 20,800⫻gfor 5 min at 4°C. The DNA pellet was then dried and resuspended in 50l of prewarmed 100 mM Tris-HCl (pH 8.0)–10 mM EDTA (pH 8.0) and incubated at 65°C for at least 15 min to ensure that the DNA was completely in solution.
PCR amplification and cloning of bisulfite-treated DNA.HotStarTaqDNA polymerase (Qiagen) was used to amplify the bisulfite-treated DNA in reaction mixtures consisting of bisulfite DNA (1l of the 50-l sample from the bisulfite modification), 12.5 mM deoxynucleoside triphosphates (Pharmacia), 600 ng of each primer (Table 1), 10⫻PCR buffer (with 1.5 mM Mg2⫹), HotStarTaqDNA
polymerase, and water to a final volume of 50l. The conditions used for the PCRs were as follows: ULAT, 95°C for 15 min (1 cycle) and 95°C for 45 s, 48°C for 30 s, and 72°C for 1.5 min (35 cycles); ICP4w, 95°C for 15 min (1 cycle) and 95°C for 45 s, 59°C for 30 s, and 72°C for 1.5 min (35 cycles); LAT, 95°C for 15 min (1 cycle) and 95°C for 45 s, 50°C for 30 s, and 72°C for 1.5 min (35 cycles); and Aseq, 95°C for 15 min (1 cycle) and 95°C for 45 s, 50°C for 30 s, and 72°C for 1.5 min (35 cycles). The ends of the DNA products from several pooled PCRs were repaired by using T4 DNA polymerase, blunted-end cloned into theSmaI site of the vector plasmid pBS, and transformed into competent DH5␣cells. The clones were sequenced by using 1g of a minipreparation of plasmid DNA, 1l of T3 primer (20 ng/ml) (Invitrogen), 2l of 5⫻buffer, 4l of Termination Ready Mix (PE Biosystems), and 12l of water for a total of 20l. The reaction was amplified at 96°C for 10 s, 50°C for 5 s, and 60°C for 4 min (25 cycles). The reaction products were resolved on a sequencing gel (Sequencing Core, Univer-sity of Florida Center for Mammalian Genetics), and the gel was analyzed by using ABI Prism software.
ChIP.ChIPs were performed as previously described by Leach et al. (23) with modifications made for analysis of chromatin from mouse DRG. All solutions used prior to and during incubation with antibody contained protease inhibitors at the following concentrations: aprotinin (U.S. Biochemicals), 15g/ml; leu-peptin (U.S. Biochemicals), 1g/ml; and phenylmethylsulfonyl fluoride (Sigma), 10g/ml. All steps were performed at 4°C unless noted otherwise.
DRG were removed from mice at a minimum of 28 days p.i. and homogenized in a 1.5-ml Duall glass tissue grinder (Kontes) in ice-cold phosphate-buffered saline. Formaldehyde (final concentration, 0.37% [vol/vol]) was added to the homogenate to cross-link the chromatin, and samples were incubated at room temperature with shaking for 10 min. Cross-linking was arrested by adding
on November 8, 2019 by guest
http://jvi.asm.org/
glycine (0.125 M final concentration), and the homogenate was incubated for an additional 5 min at room temperature with shaking. The homogenate was then pelleted, and the pellet was washed three times with phosphate-buffered saline, resuspended in SDS lysis buffer (Upstate Biotechnology), and incubated for a minimum of 10 min on ice. The homogenate of the DRG tissue extracted from each mouse was resuspended in 100l of SDS lysis buffer.
The cell lysate was sonicated to shear the chromatin into a population of fragments with a median size range of 500 to 1,000 bp as determined by agarose gel electrophoresis. The sheared chromatin was diluted by the addition of 10 volumes of ice-cold ChIP dilution buffer (Upstate Biotechnology) supplemented with protease inhibitors and then was incubated with salmon sperm DNA– protein A-agarose (50%) slurry (Upstate Biotechnology) with shaking for 2 h to reduce nonspecific binding. Beads were removed by centrifugation, and the sheared chromatin was incubated with anti-acetyl histone H3(K9, K14) (Upstate Biotechnology) at a concentration of 5l/ml overnight at 4°C with shaking.
Chromatin-antibody complexes were collected by incubation with salmon sperm DNA–protein A-agarose (50%) slurry and subsequent collection of beads by centrifugation. The bead pellets were washed one time each in low-salt, high-salt, and LiCl buffers (Upstate Biotechnology), followed by two washes with 1⫻ 10 mM Tris-Hcl (pH 8.0)–1 mM EDTA (pH 8.0). Antibody-chromatin complexes were eluted from beads by incubation with freshly made, preheated (65°C) elution buffer (0.1% SDS, 0.1 M NaHCO3). NaCl was added to the
eluates (final concentration of 0.2 M), and they were incubated at 65°C for 4 h. The eluates were then treated with RNase A and proteinase K, and the DNA was purified by using a Qiaquick PCR purification kit (Qiagen).
PCR analysis of ChIPs.Prior to the addition of antibody to the sheared chromatin samples described above, an aliquot of sheared chromatin (subse-quently referred to as input) was removed and purified in a manner similar to that for the bound ChIP fraction described above. Serial dilutions of the input were used as a reference in order to determine the relative enrichments of different DNA targets in the bound ChIP fraction. PCRs on input dilutions and the bound ChIP fraction were performed simultaneously with HotStarTaqDNA polymerase (Qiagen) at cycles that produced product within the linear range, which was typically attained after approximately 30 to 38 cycles. The initial-stage PCR cycle conditions used were 15 min at 95°C, 3 min at 94°C, 3 min at 55°C, and 3 min at 72 min. Subsequent, repeated cycles were 1 min at 94°C, 1 min at 55°C, and 1 min at 72°C (repeated 30 to 38 times). The primers used for ChIP PCRs and the nucleotide designations of the regions they spanned were as follows: mouse adenine phosphoribosyl transferase (APRT), corresponding to nucleo-tides (nt) 2170 to 2543 of the APRT gene (GenBank accession no. M11310), 5⬘
ACT CCA GGG GCT TCC TGT TTG 3⬘and 5⬘ATC CAC AAT GAC CAC TCT CTG 3⬘; mouse-globin, corresponding to nt 2760 to 3102 of the mouse
-globin major gene (accession no. J00413), 5⬘CTG TGG GGA AAG GTG AAC 3⬘and 5⬘CTG AGG CTG GCA AAG GTG 3⬘. The primer pairs for amplifying HSV-1-specific sequences were as follows (nucleotide positions cor-respond to HSV-1 strain 17 [GenBank accession no. X14112.1]): LAT promoter (nt 118248 to 118353), 5⬘GCA CGA TCC CGA CAA TAA CAA 3⬘and 5⬘ACT TCC ACT TCC CGT CCT TCC ATC 3⬘; HSV DNA polymerase (nt 65866 to 65957), 5⬘CAT CAC CGA CCC GGA GAG GGA C 3⬘and 5⬘GGG CCA GGC GCT TGT TGG TGT A 3⬘; UL54 (ICP27) (nt 113736 to 113852), 5⬘GGC GAC TGA CAT TGA 3⬘and 5⬘CTG CTG TCC GAT TCC AGG TC 3⬘; and ICP4 (nt 131394 to 131747), 5⬘GTC GTG GAT CCG TGT CGG CA 3⬘and 5⬘TGC CCG TTC CTC GTT AGC AT 3⬘.
All PCR products were resolved on 8% polyacrylamide gels, stained with SYBR Green (Molecular Probes), and detected with a Storm 860 Fluorimager (Molecular Dynamics). Band intensities for each PCR product were determined by using ImageQuant software, version 1.2. For the data shown in Fig. 3 and Table 3, band intensities for input samples were graphed, a linear regression was
applied, and an equation for the line was determined, all with Kaleidegraph software. The equation for the line was used to determine the total relative enrichment of the PCR products generated with the same primer set on DNA from the precipitated (bound) ChIP fraction. The enrichment of one DNA region over another in a given bound ChIP fraction was determined by compar-ing the relative enrichment quantity obtained for the two DNA regions of interest. The fold difference of enrichment of one DNA target compared to another was calculated by dividing the larger relative enrichment value by the smaller relative enrichment value to obtain the fold difference in enrichment between the two DNA regions. For fold enrichment data presented in all other figures, relative enrichment was determined by using the formula [(XInput/XChIP)/
(YInput/YChIP)], whereXandYrepresent the PCR product band intensities for
the two genomic regions being compared.XChIPandYChIPare the band
inten-sities generated by using 1/25 of the total anti-acetyl histone H3(K9, K14)-precipitated fraction as the PCR target, andXInput andYInputare the band
intensities generated by using the same dilution of input material as the PCR target. In all cases, the precipitated samples were compared with serial dilutions of the input, and mean values and standard deviations were calculated.
Determination of ChIP efficiency.ChIPs to determine precipitation efficiencies were performed as described above, with the exception of how the input fraction was obtained (see Fig. 4A). Here the input fraction was taken at a later stage in the ChIP protocol (mock precipitated) in order to have a reference input that more consistently reflected the amount of chromatin present following incuba-tion with antibody. Just prior to incubaincuba-tion with antibody, sheared chromatin was divided into two equal aliquots, which were incubated with either anti-acetyl histone H3(K9,K14) or anti-immunoglobulin G (IgG) (Sigma) as described above. Following incubation with the salmon sperm DNA–protein A-agarose slurry, the anti-acetyl histone H3 ChIP was continued exactly as described above. The beads in the anti-IgG ChIP were pelleted, and the supernatant (unbound fraction) was collected. This fraction was then purified as described above and used as the reference input sample.
RESULTS
Analysis of the HSV-1 genome for regions predicted to have a high probability of containing CpG methylation.Two differ-ent methods were used to predict regions of the HSV-1 ge-nome that could be potential targets of CpG methylation dur-ing latency. The first method examined the genome for regions where the frequency of CpGs was suppressed, since in verte-brates the CpGs in these regions tend to have a high
proba-bility of being methylated (20). Using the algorithmP⫽4⫻
fCpG/(fC ⫹ fG)2 (as described in Materials and Methods) a
calculated suppression, orPvalue, of less than 0.8 suggests that
[image:3.603.42.539.78.156.2]CpGs are suppressed and that a given region was a potential target of methylation. This method has been used successfully to identify sites of methylation in the genomes of retroviruses and for members of the gammaherpesvirus family such as Epstein-Barr virus and KSHV. Significantly, the fact that this method successfully identified a promoter of KSHV that was a target of methylation suggested that it was applicable to viruses such as HSV, whose genome, like that of KSHV, does not show an overall suppression in CpGs (7). Analysis of the HSV-1
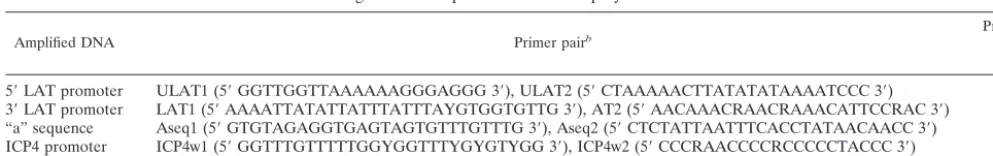
TABLE 1. Oligonucleotide primers used to amplify bisulfite-treated DNAa
Amplified DNA Primer pairb Productsize
(bp)
5⬘LAT promoter ULAT1 (5⬘GGTTGGTTAAAAAAGGGAGGG 3⬘), ULAT2 (5⬘CTAAAAACTTATATATAAAATCCC 3⬘) 320 3⬘LAT promoter LAT1 (5⬘AAAATTATATTATTTATTTAYGTGGTGTTG 3⬘), AT2 (5⬘AACAAACRAACRAAACATTCCRAC 3⬘) 271 “a” sequence Aseq1 (5⬘GTGTAGAGGTGAGTAGTGTTTGTTTG 3⬘), Aseq2 (5⬘CTCTATTAATTTCACCTATAACAACC 3⬘) 125 ICP4 promoter ICP4w1 (5⬘GGTTTGTTTTTGGYGGTTTYGYGTYGG 3⬘), ICP4w2 (5⬘CCCRAACCCCRCCCCCTACCC 3⬘) 360
aPrimers were designed to be complementary to DNA in which all Cs have been converted to U by the bisulfite reaction. In order to prevent bias against DNA that
might contain methylated Cs (and therefore be protected from the bisulfite reaction), primer-landing sites containing CpGs were avoided in the design of the primers.
bY can be any C or T nucleotide, and R can be any A or G nucleotide.
on November 8, 2019 by guest
http://jvi.asm.org/
genome by using this algorithm (Fig. 1) revealed that the bulk
of the genome possessed a Pvalue ofⱖ1, indicating that in
general CpGs are not suppressed. There were several regions
within the long and short repeats with calculatedPvalues of
⬍0.8, so these regions were graphed at a higher resolution
(Fig. 2B). Only one region with a P value of less than 0.8
occurred within the promoter of a gene, and this was with the
LAT promoter. Another region with a sustained lowPvalue
was within the “a” sequences. While this region did not occur within a promoter, its presence within a region of reiterated elements made it a likely target for methylation. Therefore, these two regions were selected for methylation analysis.
A second method that was used to select potential regions of CpG methylation was to look for CpG islands. CpG islands are regions found in vertebrate genomes that are CG rich (typi-cally 60 to 70%), have CpG-to-GpC ratios of at least 0.6, and typically range in size from 0.5 to 1 kb (2, 11). In contrast to bulk chromatin, CpG islands usually show no CpG suppres-sion, and the CpGs are usually nonmethylated. There are in-stances, however, when the methylation of CpG islands plays a key regulatory role. CpG islands found in gene promoters are usually unmethylated for active genes (1, 29) but are
methyl-ated in the case of inactive genes (4, 15). Since the HSV-1 genome had been previously shown to contain CpG-rich re-gions (10), we sought to determine if any of these CpG islands were located in gene promoters and therefore might be targets of methylation that could play a regulatory role. Analysis of the repeat regions (Fig. 2C) revealed that several HSV-1 promot-ers contain CpG islands with CpG/GpC ratios of greater than 1.5 and extending over segments of 400 bp or greater. These included the LAT promoter (LAP1), a region downstream of the LAT promoter in exon 1 of LAT which has also been shown to contain a TATA-less promoter (LAP2) (18), and the ICP4 promoter.
Bisulfite sequencing analysis of regions determined to be likely sites of DNA methylation.CpGs within the viral repeats predicted to be targets of methylation (Fig. 2A) were analyzed by using bisulfite sequence analysis. Bisulfite sequence analysis involves treatment of DNA with sodium bisulfite followed by NaOH, a reaction that selectively deaminates unmethylated cytosines, converting them to uracils. Following bisulfite treat-ment, DNA is PCR amplified, and the products are cloned and sequenced. The presence of any nonconverted cytosines in the sequence is then determined, indicating the presence of a
FIG. 1. Analysis of the HSV-1 genome for specific regions that are predicted to have a high probability of being targets of CpG methylation. The algorithm of Karlin et al. (20) was used (see Materials and Methods) to analyze the HSV-1 genome in 50-bp segments, and the resultingP values are indicated. Random DNA has aPvalue of 1, whereasPvalues ofⱕ0.8 represent a distribution of CpGs with a high probability of being methylated.
on November 8, 2019 by guest
http://jvi.asm.org/
FIG. 2. Regions of the HSV-1 genome selected for bisulfite sequence analysis for DNA methylation based on two models of predicting the potential for CpG methylation. Analyses of the HSV-1 genome indicated that discrete regions within the repeat regions are potential targets of CpG methylation. (A) Diagram of the HSV-1 genome with an expanded view of the internal RLand RSregions. The locations of the LAT, ICP0, ␥34.5, and ICP4 genes are indicated. (B)Pvalue analysis of the repeat region analyzed in 50-bp segments (see Materials and Methods). Regions containingPvalue ratios ofⱕ0.8 sustained over contiguous segments of⬎400 bp were considered to contain CpG frequencies making these regions probable targets of CpG methylation. Regions with significantPvalues that were selected for bisulfite analysis are indicated by the pink highlighting. (C) CpG/GpC ratios of the repeat region analyzed in 50-bp segments (see Materials and Methods). Regions containing CpG/GpC ratios ofⱖ1.5 sustained over contiguous segments of⬎400 bp were considered to comprise a CpG island and to be potential targets of CpG methylation. These regions encompassing promoters of genes were selected for bisulfite analysis and are indicated by the yellow highlighting. Note that the methods of analysis employed for panels B and C use divergent criteria and that only one region in common was predicted by both models (shown by the orange highlighting in panel A).
on November 8, 2019 by guest
http://jvi.asm.org/
methylated cytosine at that position in the original DNA. Un-like analyses performed with restriction enzyme isochizomers
such as HpaII and MspI, bisulfite sequencing allows one to
examine the methylation status of all CpGs in a region, since it is not limited to a recognition sequence. In addition, the use of restriction enzymes can result in partial digestion of the DNA, causing equivocal results.
For these analyses, three sources of HSV-1 DNA were used: (i) HSV-1 virion DNA, isolated following a productive infec-tion in cell culture; (ii) HSV-1 acute DNA, isolated from acutely infected mouse DRG; and (iii) HSV-1 latent DNA, isolated from latently infected mouse DRG. For the first and second sources, total cellular DNA was isolated and bisulfite treated as described in Materials and Methods. While deter-mining the methylation status of the HSV-1 DNA from latently infected mouse DRG was the primary goal of this study, the virion DNA and acute DNA were included partially to act as controls but also were used initially to work out the conditions for the bisulfite treatment and PCR amplification steps for bisulfite-treated DNA. Following bisulfite treatment, DNA was amplified by using PCR primers (Table 1) specific to sites in the HSV-1 genome identified by the sequence analyses (Fig. 2A). It should be noted that because all nonmethylated cy-tosines, even those outside of CpG residues, are converted to uracils by the bisulfite reaction, the primers used to amplify the bisulfite-treated DNA are designed to be complementary to the reacted template. Because the methylation status of the CpGs is not known, primers are designed to avoid regions containing CpGs so as not to bias the PCR. When suitable regions not containing CpGs cannot be found, primers are designed with a redundant base (G or A) at the guanosine position corresponding to the opposite strand of the of the CpG cytosine so that templates with both methylated and unmethylated CpGs are amplified. Following PCR amplifica-tion, products were cloned and 18 to 24 independent transfor-mants were sequenced so as to obtain a representative
popu-lation of sequenced fragments. We sequenced more clones than is typical for analyses of cellular genes (17) because of our concern that HSV latent genomes could represent a more heterogeneous population. The results of the methylation analyses indicated that the large majority of clones analyzed
(⬎87% of all clones from latent DNA) showed no evidence of
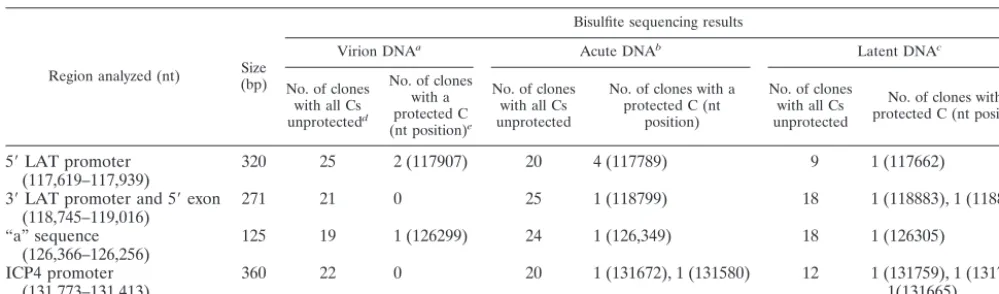
methylation, with all cytosines converted to uracils by the bisul-fite reaction (Table 2). Out of the total of 233 clones se-quenced, only 18 clones showed any evidence of methylation. The majority of clones showing evidence of methylation had a single protected cytosine, and only in one instance was the same site methylated in more than one clone. This single site (nt 117789) in the LAT promoter was protected in four clones isolated from acutely infected mouse DRG. This site was not protected in either the virion DNA or in DNA from latently infected DRG. It is not clear whether these four clones re-sulted from a single template with this protected site or whether this site was protected in four distinct HSV-1 ge-nomes. Regardless of the origin, the majority (83%) of the clones analyzed from the acute DRG showed no evidence of methylation, so it does not seem likely that this site represents a biologically significant or consistent target of methylation during the acute infection. In summary, methylation analysis of four regions within the repeat region of the HSV-1 genome that were predicted to represent likely targets of DNA meth-ylation revealed only sporadic methmeth-ylation in fewer than 13% of the clones analyzed. This pattern is consistent with random methylation and suggests that methylation does not play a regulatory role in suppressing HSV-1 transcription during la-tency.
[image:6.603.42.542.80.227.2]ChIP analysis of latent HSV DNA.Since DNA methylation does not seem to be the mechanism responsible for global repression of lytic genes during latency, we sought to deter-mine whether this repression could be regulated at the level of chromatin structure. Specifically, we wanted to find out if there was a correlation between the transcriptional status of the
TABLE 2. Summary of bisulfite sequence analysis of the targeted RLand RSregions of the HSV-1 genome
Region analyzed (nt) (bp)Size
Bisulfite sequencing results
Virion DNAa Acute DNAb Latent DNAc
No. of clones with all Cs unprotectedd
No. of clones with a protected C (nt position)e
No. of clones with all Cs unprotected
No. of clones with a protected C (nt
position)
No. of clones with all Cs unprotected
No. of clones with a protected C (nt position)
5⬘LAT promoter
(117,619–117,939) 320 25 2 (117907) 20 4 (117789) 9 1 (117662)
3⬘LAT promoter and 5⬘exon
(118,745–119,016) 271 21 0 25 1 (118799) 18 1 (118883), 1 (118839)
“a” sequence
(126,366–126,256) 125 19 1 (126299) 24 1 (126,349) 18 1 (126305)
ICP4 promoter
(131,773–131,413) 360 22 0 20 1 (131672), 1 (131580) 12 1 (131759), 1 (131725),1(131665) aHSV DNA was isolated from the cytoplasmic fraction of infected RSC and treated with sodium bisulfite as described in Materials and Methods.
bTotal ganglionic DNA was isolated from mouse DRG at 4 days p.i., with 105PFU of HSV-1 strain 17,syn⫹on both rear footpads as described in Materials and
Methods. Following isolation, the DNA was treated with sodium bisulfite.
cTotal ganglionic DNA was isolated from mouse DRG at 28 days p.i., with 5⫻102PFU of HSV-1 strain 17syn⫹on both rear footpads as described in Materials
and Methods. Following isolation, the DNA was treated with sodium bisulfite.
dFollowing bisulfite treatment, the DNA was subjected to PCR and the resulting PCR products were cloned and sequenced. Clones that showed complete conversion
of all CpG Cs to Ts are the result of the CpG cytosine being unmethylated and therefore unprotected from the bisulfite modification reaction.
eFollowing bisulfite treatment, the DNA was subjected to PCR and the resulting PCR products were cloned and sequenced. Clones that showed complete incomplete
conversion of all CpG Cs to Ts are the likely result of one or more CpG cytosine being methylated and therefore protected from the bisulfite modification reaction.
on November 8, 2019 by guest
http://jvi.asm.org/
latent genome and the localization of histones possessing spe-cific tail modifications. To this end, we employed the ChIP assay to determine the distribution of acetyl histone H3(K9, K14) present within chromatin of the latent HSV-1 genome. Because of the number of latently infected mice required to provide sufficient material for the ChIP assays, HSV-1 strain
KOS was used in lieu of the high-mortality strain 17syn⫹.
Female 6- to 8-week-old ND4 Swiss mice (Harlan Sprague
Dawley) were infected with 106 PFU of HSV-1 strain KOS
bilaterally on the rear footpads, and at 28 days p.i. DNA from the DRG was immunoprecipitated with anti-acetyl histone H3(K9, K14) as described in Materials and Methods. Dilutions of input DNA (an aliquot of the cross-linked chromatin prior to IP) was subjected to PCR with each set of primers to serve as a control for the relative PCR efficiency of the PCR primers and to serve as a reference for determining the relative enrich-ment of a particular DNA fragenrich-ment in the IP samples. In order to validate the ChIP assay, primers specific for two cellular genes were used. This indicated that the housekeeping APRT
gene was enriched 4.55 (⫾1.2)-fold over the-globin gene by
the precipitation with the anti-acetyl histone H3(K9, K14) an-tibody (Fig. 3A), consistent with their relative transcriptional profiles in neuronal tissues. PCR analysis of this same ChIP with a primer pair spanning a region centrally located within the LAT promoter (nt 118248 to 118353) revealed that this
region is associated with acetyl histone H3(K9, K14), a marker of transcriptionally permissive chromatin (Fig. 3B). In con-trast, the ChIP precipitated far less of the region of DNA corresponding to the HSV-1 DNA polymerase gene (nt 65866 to 65957). The fold enrichment of the LAT region over the DNA polymerase region was calculated following the analysis of three independent PCR experiments, as illustrated in Table 3. These experiments were performed with 34, 35, and 36 cycles (a range of cycles that had been shown to result in linear ranges for the input standards). This analysis revealed that the LAT promoter was enriched by 4.47-fold over the DNA
[image:7.603.73.250.68.274.2]poly-merase gene, with a standard deviation of⫾1.42. These results
FIG. 3. ChIP analysis of the LAT and DNA polymerase regions of latent HSV-1 DNA, using antiserum specific for anti-acetyl histone H3(K9, K14). DRG from mice latently infected with HSV-1 strain KOS were processed and subjected to ChIP analysis as described in Materials and Methods. The relative enrichment of acetyl histone H3(K9, K14) on a specific region of DNA was determined by PCR analysis of the ChIP fraction relative to dilutions of the input (preim-munoprecipitation) material. (A) ChIPs were validated by performing PCRs with primers to cellular target APRT (actively transcribed in peripheral nerve ganglia) and-globin (not transcribed in adult DRG) genes. (B) PCRs performed on the same ChIP with primers to the LAT promoter and the HSV-1 DNA polymerase gene. Fold enrich-ments (which adjust for differences in PCR efficiencies between primer sets) are determined by comparing the band intensities of PCR prod-ucts generated with ChIP-precipitated DNA and twofold serial dilu-tions of input (see Results). Lane 6 in panel A and lane 5 in panel B are no-input controls.
TABLE 3. PCR determination of the relative enrichment of the HSV-1 LAT promoter and DNA polymerase gene regions following
ChIP with anti-acetyl histone H3(K9, K14)a
PCR
primers Sample, no.of cycles Dilutionb Fluorescencec valueIPd
LAT Input, 34 0.2 1.29⫻106
0.1 8.21⫻105 0.05 7.10⫻105 0.02 1.19⫻105
IP, 34 1.10⫻106 0.16
Input, 35 0.2 1.55⫻106 0.1 1.18⫻106 0.05 4.37⫻105 0.02 5.97⫻105
IP, 35 1.47⫻106 0.18
Input, 36 0.2 2.04⫻106 0.1 1.75⫻106 0.05 1.27⫻106 0.02 8.58⫻105
IP, 36 1.95⫻106 0.17
Pol Input, 34 0.2 7.27⫻105
0.1 3.79⫻105 0.05 3.68⫻105 0.02 1.02⫻105
IP, 34 2.43⫻105 0.044
Input, 35 0.2 1.15⫻106 0.1 9.23⫻105 0.05 4.65⫻105 0.02 3.36⫻105
IP, 35 4.80⫻105 0.041
Input, 36 0.2 1.34⫻106 0.1 1.02⫻106 0.05 8.12⫻105 0.02 9.40⫻104
IP, 36 4.46⫻105 0.030
aSamples included either dilutions of the input (mock-immunoprecipitated
sample as described in Materials and Methods) or the actual IP sample [immu-noprecipitated with acetyl histone H3 (K9, K14)]. These samples were analyzed by PCR with primers either for the LAT promoter or the HSV-1 DNA poly-merase (Pol) promoter. Separate PCR runs were performed for either 34, 35, or 36 cycles.
bInput samples were diluted serially as indicated; IP samples were analyzed
undiluted.
cPCR products were resolved by polyacrylamide gel electrophoresis and
stained with SYBR green, and the band intensities were measured on a Storm 860 instrument with ImageQuant software.
dThe input dilution data were fit by linear regression (Kaleidagraph). The IP
fluorescence value was calculated from the linear fit of the input dilution data. The mean values⫾standard deviations were 0.17⫾0.01 for the LAT primers and 0.038⫾0.007 for the Pol primers.
on November 8, 2019 by guest
http://jvi.asm.org/
[image:7.603.302.542.97.454.2]suggest that the LAT promoter region is maintained in a tran-scriptionally permissive configuration during latency, while the DNA polymerase gene is in a less transcriptionally permissive state.
In order to further optimize and assess the efficiency of the precipitation assay, apparent precipitation efficiencies and the effects of using different amounts of antibody were determined as described in Materials and Methods and as outlined in Fig. 4A. The sheared chromatin was divided into equal fractions, and each fraction was precipitated with either the acetyl his-tone H3(K9, K14) antiserum or a heterologous antiserum, IgG, as a control. Diluted samples of the unbound fraction of the IgG-precipitated sample (expressed as a fraction of the original amount of sample) were analyzed by PCR and used as the reference (input). An aliquot (1/25th) of the total anti-acetyl histone H3(K9, K14)-precipitated fraction was analyzed by PCR with the LAT promoter primers and compared to the input PCR products (Fig. 4B). The band intensity of the PCR product generated was more than that generated with 1/4,000 of input chromatin but less than that generated with 1/2,000 of input chromatin. Therefore, the LAT promoter region was precipitated with the anti-acetyl histone H3(K9, K14) with an efficiency of 0.625 to 1.25% relative to the total chromatin input. With the HSV polymerase primers, a band intensity of
⬍1/16,000 of total chromatin input was generated, accounting
for less than 0.16% of the total HSV polymerase target DNA being precipitated. Finally, the analysis of this ChIP indicated that the LAT promoter displayed a 4.7-fold enrichment in acetyl histone H3(K9, K14) over the DNA polymerase gene.
In order to determine whether increased amounts of anti-body resulted in increased precipitation efficiency, a separate parallel precipitation was performed with 2.5 times less anti-acetyl histone H3(K9, K14) antibody. This resulted in a 1.4-fold decrease in the precipitation of the LAT promoter but only a modest decrease in the HSV-1 DNA polymerase signal (Fig. 4B). This analysis further validated the specificity of the anti-acetyl histone H3(K9, K14) for the LAT promoter region. The fold enrichment of LAT over DNA polymerase of this ChIP was 3.4. In summary, as the analyses of three indepen-dent ChIPs with anti-acetyl histone H3(K9, K14) show that the
LAT promoter is enriched by 4.24 (⫾0.55)-fold over the HSV
DNA polymerase gene.
Using this scheme of analysis, we sought to determine the relative enrichments of the regions of two other lytic genes relative to the LAT promoter. These analyses revealed that the LAT promoter is enriched 3.5-fold relative to the UL54 (ICP27) promoter (Fig. 5A) and 2.2-fold relative to the ICP4 promoter (Fig. 5B). This indicates that the promoter regions of these two immediate-early genes, like that of the HSV-1 DNA polymerase (early) gene, are significantly underenriched in the acetyl histone H3(K9, K14), indicating that the local composi-tion of modified histones in the latent HSV-1 genome corre-lates with transcriptional activity and that histone composition may play an important regulatory role in promoting LAT tran-scription and repressing lytic gene trantran-scription during latency.
DISCUSSION
[image:8.603.305.529.76.625.2]DNA methylation does not seem to play a regulatory role during HSV-1 latency. Several early studies suggested that
FIG. 4. Precipitation efficiency of the LAT promoter and the HSV-1 polymerase gene acetyl histone H3(K9, K14) ChIPs. (A) Sche-matic of ChIP efficiency determination, showing fractions of isolated tissue used in the ChIPs with the specific and control antisera and the dilutions of the unbound control fraction used to calculate the IP efficiency. H3Ac, acetyl histone H3(K9, K14). (B) Experimental deter-mination of the relative enrichment of the LAT promoter over the HSV polymerase gene in the acetyl histone H3(K9, K14) ChIP. ChIP 1⫻, precipitation with 2.25g of antiserum; ChIP 2.5⫻, precipitation with 5g of antiserum.
on November 8, 2019 by guest
http://jvi.asm.org/
DNA methylation played a potential role in regulating HSV-1 gene expression during latency. Youssoufian et al. demon-strated that a latent infection of chicken lymphocytes with HSV-1 was associated with DNA methylation and that virus could be induced to reactivate in this in vitro system following treatment of the lymphocytes with 5-azacytidine, an inhibitor of DNA methyltransferase (36). Two other studies demon-strated that use of methyltransferase inhibitors enhanced the reactivation of HSV-2 from latently infected guinea pig ganglia (5, 30). While Dressler and Fraser showed that the HSV-1 genome was not extensively methylated during latency (13), the possibility remained that DNA methylation at discrete sites in the promoters of key regulatory genes could play a role in the regulation of latent transcription. Our analysis of several regulatory regions at sites predicted to be potential targets of methylation by sequence analysis found the presence of only sporadic methylated cytosines by bisulfite analysis, suggesting that DNA methylation does not play a role in regulating HSV-1 transcription during latency. It should be noted that we cannot rule out the possibilities that critical CpG(s) some-where in the HSV-1 genome might be methylated and that this methylation could play an important regulatory role. We do suggest that it seems unlikely that methylation plays a global role in suppressing lytic genes during latency, and global re-pression of transcription from the latent HSV-1 genome is more likely regulated by a different epigenetic mechanism.
Even though some members of the beta- and gammaherpes-viruses have been shown to employ DNA methylation to reg-ulate transcription of key genes during latency, it may make some biological sense that HSV does not share this regulatory strategy. DNA methylation is a relatively tight epigenetic mod-ification due to the apparent lack of DNA-demethylating en-zymes in the cell, and it generally requires DNA replication in order to generate DNA copies lacking this modification. Given this fact, it would be far easier for viruses such as Epstein-Barr virus, which establishes latency in dividing cells and possesses a mechanism to replicate its episome, to overcome methyla-tion-mediated repression than for a virus such as HSV, which
is latent in terminally differentiated neurons, to do so. The indication that HSV-1 instead employs a relatively dynamic epigenetic mechanism to mediate repression of lytic gene ex-pression may provide it with a means of lytic gene supex-pression that is more easily regulated in the environment of quiescent terminally differentiated neurons.
Implications of acetyl histone H3(K9, K14) distribution in latent viral chromatin for the regulation of HSV-1 genes dur-ing latency. The finding that during latency acetyl histone H3(K9, K14) is underrepresented in the four HSV-1 lytic genes examined suggests that a global repression of HSV-1 lytic functions may be mediated by the association of specifi-cally modified histones with specific regions of the HSV-1 genome during latency. The lack of acetyl histone H3(K9,K14) suggests that other modified histones, particularly ones asso-ciated with transcriptionally repressed chromatin, may be as-sociated with these lytic gene regions. In the context of cellular chromatin, the deposition of trimethyl histone H3(K9) appears to be one of the first steps in recruiting repressive chromatin proteins, such as HP-1, to regions targeted for heterochromatic silencing (22, 26, 28). Repression of lytic genes through this mechanism would provide a means by which HSV-1 could globally repress lytic functions at the epigenetic level in order to maintain viral latency. When “ChIP-grade” antibodies to these reagents become more readily available, it will be possi-ble to investigate the degree of repression in which lytic gene regions are maintained during viral latency. Questions to be answered include whether the HSV-1 lytic regions resemble the pericentromeric heterochromatin of cells (the most tightly repressed) or whether the chromatin in these regions resem-bles, instead, a less permissive form of euchromatin-like DNA. Defining the type of proteins associated with these repressed regions will have important implications in determining what cellular proteins (and viral gene activities) are necessary in directing the formation of the chromatin structure during es-tablishment of latency and then in remodeling the chromatin to facilitate the transcription that is required for reactivation. The enrichment of the LAT promoter with acetyl histone H3(K9, K14) indicates that this region of the viral genome is maintained in a transcriptionally permissive chromatin struc-ture during latency, and it is consistent with the fact that LAT RNA accumulates abundantly in a large number of latently infected neurons. The association of acetyl histone H3(K9, K14) does not dictate that the LAT promoter is actively tran-scribed in all cells during latency but only that this region seems to be readily accessible to transcriptional activation. An implication of this is that while only one-third of latently in-fected neurons abundantly accumulate LAT during latency (and are presumably actively transcribing LAT), one interpre-tation of the data is that the LAT promoter does not appear to be maintained in a repressed state in the remaining two-thirds of the cells. Since these ChIP analyses essentially average the acetylation profile over of all the latently infected cells in the entire ganglia, it is not possible to know whether all of the LAT promoters are enriched in acetyl histone H3(K9, K14) uni-formly, whether some may be more enriched (and thus more transcriptionally competent) than others, or whether some may not be enriched at all.
[image:9.603.79.246.68.217.2]Another point raised by this analysis relates to the degree to which relative transcriptional activities of various regions of
FIG. 5. Comparison of the histone H3 acetylation status of the LAT promoter with those of two immediate-early genes. PCRs were performed on ChIP products of latently infected mouse DRG with primers specific to the LAT promoter and the␣27 (UL54) (A) and␣4 (ICP4) (B) promoters. The input lanes represent 3- and 1.5-fold serial dilutions (respectively) of the unbound control fraction. Lanes ⫺, no-input control.
on November 8, 2019 by guest
http://jvi.asm.org/
the latent genome can be directly extrapolated from the rela-tive enrichment of acetyl histone H3(K9, K14). It has been demonstrated that relatively small changes in the fold enrich-ment of acetyl histone H3 can result in relatively dramatic changes in mRNA accumulation. One example of this is a study that quantitated hormone-induced hyperacetylation of H3 on transcription from the steroidogenic acute regulatory protein promoter, in which it was found that a 5-fold increase in acetylation of H3 resulted in a 45-fold increase in mRNA accumulation and that a 6-fold increase in acetylation resulted in a 125-fold increase in mRNA accumulation (9). Thus, changes in the acetylation status and the resulting change in transcriptional activity are not necessarily linear. It is impor-tant to note also that the resulting transcriptional status is dependent on whether the promoter is induced, the strength of the core promoter, and other factors. Thus, while small differ-ences in the acetylation profiles of two promoters (e.g., ICP4 versus ICP27) might translate to real differences in promoter permissiveness, actual differences in transcriptional activity de-pend on other factors as well and would need to be determined experimentally.
These data suggest that the HSV-1 genome may be orga-nized into chromatin domains during latency that could func-tion in regulating the transcripfunc-tional repression or permissivity of genes within a given region. Such boundaries would be necessary if, as described above, the repression of lytic genes and the transcription of LAT are controlled by their mainte-nance as heterochromatin and euchromatin, respectively. Such domains are generally separated by boundaries or insulator elements that prevent the spread of heterochromatin into neighboring euchromatic regions of transcriptionally permis-sive domains (27, 33). One obvious observational note regard-ing the HSV-1 genome is the fact that the viral genes are arranged in a nonrandom fashion within the genome. One could postulate that this arrangement has been established by the virus in order to cluster its genes into domains for regula-tory purposes.
Finally, if transcription during viral latency is maintained as the evidence here indicates, then reactivation likely will require opening of transcriptionally repressive chromatin from the lytic regions of the viral genome to allow for transcription of re-pressed genes. Such remodeling would likely involve a number of different proteins in order to recruit and assemble remod-eling complexes, particularly those containing histone acety-lases. The involvement of histone deacetylases in potentially maintaining transcriptional repression of lytic genes was sug-gested recently by Arthur et al., who observed that trichostatin A, a histone deacetylase inhibitor, facilitated activation of viral transcription when added to a quiescent cultures of primary neuronal cultures harboring HSV-1 genomes (3). With respect to chromatin remodeling, there are two key viral gene products that could act as players in initiating the remodeling of HSV-1 chromatin during reactivation. Recently it has been reported that VP-16/Oct-1/HCF-1 interacts with Set1/Ash2 histone H3-K4 methyltransferase, a modification associated with tran-scriptionally permissive as well as actively transcribed chroma-tin (34, 35). Additionally, it is of interest that the immediate-early protein ICP0 can lead to targeted degradation of the centromeric chromatin proteins CENP-A and CENP-C, al-though the significance of this activity is not understood (14,
25). In light of this fact, it will be interesting to see whether ICP0 is activated during the earliest events of reactivation, since it possesses properties that could facilitate the derepres-sion of other lytic genes and therefore play a key functional role in viral reactivation.
ACKNOWLEDGMENTS
This work was supported by grant AI48633 from the National Insti-tutes of Health, and N.J.K. has received support from NIH training grant AI07110.
We thank Peter Bragino for help with the graphics and Tony Amelio and Nicole Giordani for useful discussions and help in preparation of the manuscript.
REFERENCES
1. Antequera, F., and A. Bird.1993. CpG islands. EXS64:169–185. 2. Antequera, F., and A. Bird.1993. Number of CpG islands and genes in
human and mouse. Proc. Natl. Acad. Sci. USA90:11995–11999.
3. Arthur, J. L., C. G. Scarpini, V. Connor, R. H. Lachmann, A. M. Tolkovsky, and S. Efstathiou.2001. Herpes simplex virus type 1 promoter activity during latency establishment, maintenance, and reactivation in primary dorsal root neurons in vitro. J. Virol.75:3885–3895.
4. Baylin, S. B., J. G. Herman, J. R. Graff, P. M. Vertino, and J. P. Issa.1998. Alterations in DNA methylation: a fundamental aspect of neoplasia. Adv. Cancer Res.72:141–196.
5. Bernstein, D. I., and J. C. Kappes.1988. Enhanced in vitro reactivation of latent herpes simplex virus from neural and peripheral tissues with hexam-ethylenebisacetamide. Arch. Virol.99:57–65.
6. Bloom, D. C., J. R. Lokensgard, N. T. Maidment, L. T. Feldman, and J. G. Stevens.1994. Long-term expression of genes in vivo using non-replicating HSV vectors. Gene Ther.1(Suppl.):36–38.
7. Chen, J., K. Ueda, S. Sakakibara, T. Okuno, C. Parravicini, M. Corbellino, and K. Yamanishi.2001. Activation of latent Kaposi’s sarcoma-associated herpesvirus by demethylation of the promoter of the lytic transactivator. Proc. Natl. Acad. Sci. USA98:4119–4124.
8. Chen, S. H., M. F. Kramer, P. A. Schaffer, and D. M. Coen.1997. A viral function represses accumulation of transcripts from productive-cycle genes in mouse ganglia latently infected with herpes simplex virus. J. Virol.71:
5878–5884.
9. Christenson, L. K., R. L. Stouffer, and J. F. Strauss.2001. Quantitative analysis of the hormone-induced hyperacetylation of histone H3 associated with the steroidogenic acute regulatory protein gene promoter. J. Biol. Chem.276:27392–27399.
10. Coffin, R. S., M. K. Howard, and D. S. Latchman.1995. Altered dinucleotide content within the latently transcribed regions of the DNA of alpha herpes viruses—implications for latent RNA expression and DNA structure. Virol-ogy209:358–365.
11. Cross, S. H., and A. P. Bird.1995. CpG islands and genes. Curr. Opin. Genet. Dev.5:309–314.
12. Deshmane, S. L., and N. W. Fraser.1989. During latency, herpes simplex virus type 1 DNA is associated with nucleosomes in a chromatin structure. J. Virol.63:943–947.
13. Dressler, G. R., and N. W. Fraser.1987. DNA sequences downstream of the adenovirus type 2 fiber polyadenylation site contain transcription termina-tion signals. J. Virol.61:2770–2776.
14. Everett, R. D., W. C. Earnshaw, J. Findlay, and P. Lomonte.1999. Specific destruction of kinetochore protein CENP-C and disruption of cell division by herpes simplex virus immediate-early protein Vmw110. EMBO J.18:1526– 1538.
15. Falk, K. I., L. Szekely, A. Aleman, and I. Ernberg.1998. Specific methylation patterns in two control regions of Epstein-Barr virus latency: the LMP-1-coding upstream regulatory region and an origin of DNA replication (oriP). J. Virol.72:2969–2974.
16. Feldman, L., A. R. Ellison, C. C. Voytek, L. Yang, P. Krause, and T. P. Margolis.2002. Spontaneous molecular reactivation of herpes simplex virus type 1 latency in mice. Proc. Natl. Acad. Sci. USA99:978–983.
17. Frommer, M., L. E. McDonald, D. S. Millar, C. M. Collis, F. Watt, G. W. Grigg, P. L. Molloy, and C. L. Paul.1992. A genomic sequencing protocol that yields a positive display of 5⬘methylcytosine residues in individual DNA strands. Proc. Natl. Acad. Sci. USA89:1827–1831.
18. Goins, W. F., L. R. Sternberg, K. D. Croen, P. R. Krause, R. L. Hendricks, D. J. Fink, S. E. Straus, M. Levine, and J. C. Glorioso.1994. A novel latency-active promoter is contained within the herpes simplex virus type 1 UL flanking repeats. J. Virol.68:2239–2252.
19. Jenuwein, T., and C. D. Allis.2001. Translating the histone code. Science
293:1074–1080.
20. Karlin, S., W. Doerfler, and L. R. Cardon.1994. Why is CpG suppressed in the genomes of virtually all small eukaryotic viruses but not in those of large eukaryotic viruses? J. Virol.68:2889–2897.
on November 8, 2019 by guest
http://jvi.asm.org/
21. Kramer, M. F., and D. M. Coen.1995. Quantification of transcripts from the ICP4 and thymidine kinase genes in mouse ganglia latently infected with herpes simplex virus. J. Virol.69:1389–1399.
22. Lachner, M., D. O’Carroll, S. Rea, K. Mechtler, and T. Jenuwein.2001. Methylation of histone H3 lysine 9 creates a binding site for HP1 proteins. Nature410:116–120.
23. Leach, K. M., K. F. Vieira, S. H. Kang, A. Aslanian, M. Teichmann, R. G. Roeder, and J. Bungert.2003. Characterization of the human beta-globin downstream promoter region. Nucleic Acids Res.31:1292–1301. 24. Lokensgard, J. R., D. C. Bloom, A. T. Dobson, and L. T. Feldman.1994.
Long-term promoter activity during herpes simplex virus latency. J. Virol.
68:7148–7158.
25. Lomonte, P., K. F. Sullivan, and R. D. Everett.2001. Degradation of nu-cleosome-associated centromeric histone H3-like protein CENP-A induced by herpes simplex virus type protein ICP0. J. Biol. Chem.276:5829–5835. 26. Nakayama, J., J. C. Rice, B. D. Strahl, C. D. Allis, and S. I. Grewal.2001.
Role of histone H3 lysine 9 methylation in epigenetic control of heterochro-matin assembly. Science292:110–113.
27. Noma, K., C. D. Allis, and S. Grenwal.2001. Transitions in distinct histone H3 lysine 9 methylation in epigenetic control of heterochromatin assembly. Science293:1150–1155.
28. Rea, S., F. Eisenhaber, D. O’Carroll, B. D. Strahl, Z. W. Sun, M. Schmid, S. Opravil, K. Mechtler, C. P. Ponting, C. D. Allis, and T. Jenuwein.2000.
Regulation of chromatin structure by site-specific histone H3 methyltrans-ferases. Nature406:593–599.
29. Singal, R., and G. D. Ginder.1999. DNA methylation. Blood93:4059–4070. 30. Stephanopoulos, D. E., J. C. Kappes, and D. I. Bernstein.1988. Enhanced in vitro reactivation of herpes simplex virus type 2 from latently infected guin-ea-pig neural tissues by 5-azacytidine. J. Gen. Virol.69:1079–1083. 31. Stevens, J. G., E. K. Wagner, R. G. B. Devi, M. L. Cook, and L. T. Feldman.
1987. RNA complementary to a herpesvirus alpha gene mRNA is prominent in latently infected neurons. Science235:1056–1059.
32. Wagner, E. K., and D. C. Bloom.1997. Experimental investigation of herpes simplex virus latency. Clin. Microbiol. Rev.10:419–443.
33. West, A. G., M. Gaszner, and G. Felsenfeld.2002. Insulators: many functions, many mechanisms. Genes Dev.16:271–288.
34. Wysocka, J., and W. Herr.2003. The herpes simplex virus VP16-induced complex: the makings of a regulatory switch. Trends Biochem. Sci.28:294– 304.
35. Wysocka, J., M. P. Myers, C. D. Laherty, R. N. Eisenman, and W. Herr.2003. Human Sin3 deacetylase and trithorax-related Set1/Ash2 histone H3–K4 methyltransferase are tethered together selectively by the cell-proliferation factor HCF-1. Genes Dev.17:896–911.
36. Youssoufian, H., S. M. Hammer, M. S. Hirsch, and C. Mulder.1982. Meth-ylation of the viral genome in an in vitro model of herpes simplex virus latency. Proc. Natl. Acad. Sci. USA79:2207–2210.