University of Southern Queensland
Faculty of Engineering and Surveying
Evaluation of VRS-RTK GPS Latency in a Dynamic
Environment
A dissertation submitted by
Mr. Rientz Inglis
In fulfilment of the requirements of
ENG4111/2, Research Project
towards the degree of
ABSTRACT
This research project investigates the effects of latency in dynamic GPS (Global Positioning System) measurements made within a Virtual Reference Station (VRS) – Real Time Kinematic (RTK) network.
The test method, which has been devised as an integral part of this research, allows for determination of the effects of latency in low speed dynamic VRS measurements. The method utilises a utility vehicle as a dynamic platform for testing, with a barcode reader attached to the vehicle to read barcodes which have been fixed to posts adjacent to the test path. Mounted in vertical alignment with the reader is the GPS antenna, providing the GPS signals to allow the GPS receiver(s) on board to determine the position of the vehicle as it passes the fixed barcodes and thereby providing a fixed frame of reference for the measurement of latency. Measuring lines in each direction and comparing the apparent position of the barcodes allows for the determination of latency. Conducting the testing procedure over a range of speeds will also facilitate the investigation of the relationship between platform speed and latency error.
The results of this research have implications for any machine guidance and precision agriculture applications intending to use the VRS network where data accuracy is a major consideration. If the latency present in the positioning system has been quantified, it becomes possible to correct for this position error in real time.
---
University of Southern Queensland Faculty of Engineering and Surveying
ENG4111/2 Research Project
Limitations of Use
The Council of the University of Southern Queensland, its Faculty of Engineering and Surveying, and the staff of the University of Southern Queensland, do not accept any responsibility for the truth, accuracy or completeness of material contained within or associated with this dissertation.
Persons using all or any part of this material do so at their own risk, and not at the risk of the Council of the University of Southern Queensland, its Faculty of Engineering and Surveying or the staff of the University of Southern Queensland.
This dissertation reports an educational exercise and has no purpose or validity beyond this exercise. The sole purpose of the course pair entitled “Research Project” is to contribute to the overall education within the student’s chosen degree program. This document, the associated hardware, software, drawings, and other material set out in the associated appendices should not be used for any other purpose: if they are so used, it is entirely at the risk of the user.
Prof G Baker Dean
---
CERTIFICATION
I certify that the ideas, designs and experimental work, results, analysis and conclusions set out in this dissertation are entirely my own efforts, except where otherwise indicated and acknowledged.
I further certify that the work is original and has not been previously submitted for assessment in any other course or institution, except where specifically stated.
Rientz R. Inglis
Student Number: 0011221347
……… (Signature)
---
ACKNOWLEDGEMENTS
The author wishes to acknowledge the support and guidance received from Mr. Peter Gibbings of the University of Southern Queensland, throughout the course of the research project.
Appreciation is also due to the following organisations and people, for the provision of equipment, facilities and guidance:
• Queensland Department of Natural Resources and Mines (DNRM), in particular Garry Cizlowski for his support and assistance.
• Herga / Ultimate Positioning Brisbane, in particular John Thompson for his assistance.
• Queensland Rail (QR), in particular Derek Stanmore for his assistance.
• Barry Rowan, USQ printing services.
---
TABLE OF CONTENTS
Contents
Page
ABSTRACT iii
LIMITATIONS OF USE iv
CANDIDATES CERTIFICATION v
ACKNOWLEDGEMENTS vi
LIST OF FIGURES x
LIST OF TABLES xi
LIST OF APPENDICES xii
ABBREVIATIONS xiii
CHAPTER 1 - INTRODUCTION
1.1 The Problem 1
1.2 Research Aim and Objectives 3
1.3 Justification 3
1.4 Methodology Outline 4
1.5 Scope of Research 5
1.6 Summary: Chapter 1 6
CHAPTER 2 - LITERATURE REVIEW
2.1 Introduction 7
2.2 What is VRS? 8
2.3 The Latency Problem
2.3.1 What is Latency? 11
2.3.2 Latency in VRS-RTK GPS Measurements 14
2.4 GPS in Dynamic Environments 16
CHAPTER 3 - RESEARCH DESIGN AND METHODOLOGY
3.1 Introduction 20
3.2 A Method for Measuring Latency
3.2.1 Reference Frame 21
3.2.2 A Dynamic Platform 21
3.2.3 Setup Configuration 23
3.2.4 Measurement Sequence 24
3.2.5 Validating the Method 28
3.3 Problems and Contingencies 29
3.4 Summary: Chapter 3 35
CHAPTER 4 - DATA ANALYSIS
4.1 Introduction 36
4.2 Data Analysis
4.2.1 Raw Data Collection 36
4.2.2 Data Transfer to Personal Computer 37
4.2.3 Outputting Data for Analysis 37
4.2.4 Analysing the Database Information 38
4.2.5 Results 40
4.3 Summary: Chapter 4 44
CHAPTER 5 – DISSCUSSION AND SUMMARY
5.1 Introduction 45
CHAPTER 5 – Continued
5.2.3 Testing at Higher Speeds 46
5.2.4 Testing Involving Different Manufacturers 47
5.2.5 Accuracy Testing 47
5.3 Summary 48
BIBLIOGRAPHY (alphabetical) 49
APPENDICES
Appendix A. Project Specification 53
Appendix B. Virtual Reference Station Specifications (Trimble) 54 Appendix C. Barcode reader specifications (Expansys) 55 Appendix D. GPS receiver specifications (Trimble) 56
---
LIST OF FIGURES
Number Title
Page
2.1 VRS Network Operation 9
2.2 The Queensland VRS Network 10
2.3 VRS Network IT Setup 11
2.4 The Effect of Latency 12
2.5 Total Latency 13
2.6 Latency Test Results Showing Lateral Shift 17
2.7 Dozer Utilising Machine Guidance – an Application 18 3.1 Dynamic Platform – Utility with Frame Attached 22 3.2 Using a Plumb-bob to check the Antenna / Barcode Reader Alignment 22 3.3 Microvision™ Flic™ Barcode Scanner used for Testing 23 3.4 Barcode Reader Moving Past the Fixed Reference Points 25 3.5 Using the Measurement Sequence to Determine Latency 26 3.6 GPS Measurement Timeline (fictitious example) 27 3.7 GPS Measurement Timeline (fictitious example)
Showing External Sensor Synchronisation 27
3.8 TSCe I/O Port Configuration 33
4.1 Barcode 4 Latency 41
4.2 Barcode 1 Latency 42
---
LIST OF Tables
Number Title
Page
3.1 Sample raw data file generated during testing 28
4.1 Sample Combined Output File 38
4.2 Sample Table Showing Raw Barcode Position (Sensor) Data 40 4.3 Relationship Between Platform Speed
---
LIST OF APPENDICES
Number Title
Page
A Project Specification 53
B VRS data sheet (Trimble) 54
C Bar Code Reader Specifications (Expansys) 55
D GPS receiver specifications (Trimble) 56
---
ABBREVIATIONS
The following abbreviations have been used throughout the text and bibliography:-
CORS Continually Operating Reference Stations
DLI Department of Land Information (West Australian Government) DNRM Department of Natural Resources and Mines (Qld Government) GPS Global Positioning System
GNSS Global Navigation Satellite System
GSM Global System for Mobile communications
NZ New Zealand
OSG Office of the Surveyor General (New Zealand Government)
PC Personal computer
Qld Queensland
QR Queensland Rail
RTK Real Time Kinematic USB Universal Serial Bus
USQ University of Southern Queensland (Toowoomba, Qld) VHF Very High Frequency
VRS Virtual Reference Station
WA Western Australia
Chapter 1 – Introduction
---
CHAPTER 1
INTRODUCTION
Future testing will need to more fully investigate the use of VRS in dynamic platforms such as rail and road surveys and in earth moving applications.
(Higgins, 2001)
1.1 The Problem
Conventional Real Time Kinematic (RTK) Global Positioning System (GPS) surveying is gradually being replaced in many applications, by wide area networks such as the Virtual Reference Station (VRS) for the supply of differential GPS corrections. The VRS network can deliver differential corrections via the mobile phone network; enabling users to be positioned anywhere inside the network in real time and with accuracy better than a few centimetres (Higgins, 2001).
Chapter 1 – Introduction
VRS-RTK usage is increasing around the world; at the end of 2002 at least 28 VRS networks were in operation in several continents (Landau et al, 2002). An understanding of latency effects is critical in the application of VRS to dynamic applications, since it (latency) can be a source of positional error, if not allowed for (Raymond, 2005).
With the possibility of wider application of VRS technology, potential users such as Queensland Rail (primarily for track maintenance equipment) need to know how responsive the measurement system is for dynamic applications. Furthermore, the application of VRS technology to other endeavors such as the application of agricultural pesticides, automated field harvesting and civil machine guidance also requires an understanding of how responsive the guidance system is.
Some studies have been conducted to investigate latency in dynamic GPS systems in the past (see Smith et al, 2003). However, a lack of research specifically targeting VRS systems like the one maintained by the Queensland Department of Natural Resources and Mines (DNRM) with regard to latency in dynamic GPS observations has been identified. It would also appear that several state and federal governments around the world are at a ‘cross-roads’ with respect to GPS infrastructure (for example, see OSG, 2003, N.Z.). When considering a large capital outlay, such as the purchase of a state-wide GPS network, all factors and potential users must be considered.
Chapter 1 – Introduction
Questions can be raised about the dynamic measurement quality of VRS, because the effect of latency (and therefore the restriction of VRS in dynamic applications) is a relatively unknown quantity, when compared to a more established system such as conventional RTK GPS. This research seeks to address this apparent gap through the development of a testing regime to quantify latency in dynamic VRS-RTK observations.
1.2 Research Aim and Objectives
Given the underlying requirement for research to determine the latency of the VRS system, the aim of this project is to develop and implement a method to quantify the latency in conventional RTK and VRS-RTK GPS measurements taken in a dynamic environment.
The data obtained from the testing will be processed and analysed, allowing conclusions to be made with respect to latency effects in dynamic VRS GPS observations, compared with conventional RTK methods.
1.3 Justification
Given that the operating distance restrictions such as those associated with conventional RTK GPS (radio range, on site obstructions such as hills etc) are less of a problem using GSM cellular network coverage, the VRS system may be particularly suited to large area dynamic platform applications such as machine guidance and precision agriculture.
Chapter 1 – Introduction
This requirement has been brought about by increasing interest in multi-station GPS networks, and their integration into existing GPS infrastructure. Anyone planning to use such a system must have a clear understanding of any possible error sources, in order to apply quality controls to the spatial data obtained. This is a ‘best practice’ quality assurance requirement to ensure the end user receives reliable, quality data.
1.4 Methodology Outline
To determine the latency associated with VRS measurements being made in a dynamic sense, a major component of this research project was to develop a method to evaluate these effects. A detailed description of this method is given in chapter 3, although a brief introduction to the testing method is provided below.
The testing regime for this project requires a straight section of roadway using a utility vehicle on which the GPS antenna / receivers is mounted. The signal from the GPS antenna is corrected by whichever means is being used (either VRS or conventional RTK). Also mounted on the car is a barcode reader, directly under the GPS antenna. A plumb bob is used to verify this alignment. The barcode reader inserts an extra record into the data stream (originating from the GPS receiver and flowing to the data recording device (TSCe)), when the trolley travels past any of the known reference points (fixed standard barcodes) which are established on stakes adjacent to the road prior to testing.
Chapter 1 – Introduction
1.5 Scope of Research
Although the VRS system is not the only means of correcting GPS observations, this project has specifically focused on the VRS network of differential GPS corrections. Further research is required to determine if similar results will be obtained with these other forms of wide area differential GPS corrections. Thus, the project aims to give a comparison with the conventional RTK method only. The research is intended to provide information for users considering the integration of VRS techniques into their dynamic surveying operations and also for both private sector and government agencies considering the further expansion of VRS networks.
Chapter 1 – Introduction
1.6 Summary: Chapter 1
This research provides a method for quantifying any latency present in low speed dynamic VRS-RTK systems, where correction data is provided by way of the GSM cellular phone network. It also provides for a direct comparison with the conventional RTK method. The findings will be useful to anyone using VRS networks (in conjunction with the GSM network) in dynamic environments.
Chapter 2 – Literature Review
---
CHAPTER 2
LITERATURE REVIEW
2.1 Introduction.
Latency in GPS is not a new concept. To avoid duplication, there is a need to identify the extent and nature of existing research with respect to latency in dynamic VRS measurements. Also, a thorough background comprehension of the concepts involved in this project is also required, to assist in the design of an appropriate testing regime.
This chapter presents a review of literature relevant to the study of latency in VRS measurements in a dynamic environment. It introduces all relevant research to date, as well as highlighting the need for further research in the specific field of latency in VRS-RTK surveying in dynamic environments.
Chapter 2 – Literature Review
2.2 What is VRS?
The Virtual Reference Station concept was developed by Trimble Terrasat as a means of increasing the benefits gained by utilising networks of permanently running, fixed reference stations for centimeter-level accurate GNSS positioning (Vollath et al, 2000a).
In a paper presented to the 2001 International Federation of Surveyors conference titled ‘An Australian Pilot Network for a Real Time Kinematic GPS Network Using the Virtual Reference Station Concept’, (Higgins, 2001) comments that the virtual reference station concept is used as a means of utilising GPS correction data from a network of permanently operating base stations, allowing modeling of atmospheric and other effects for any point in and around the network. Although the concept is similar to conventional RTK, the move away from a single base station and towards a network based approach gives the user some increased redundancy in the correction data obtained.
Chapter 2 – Literature Review
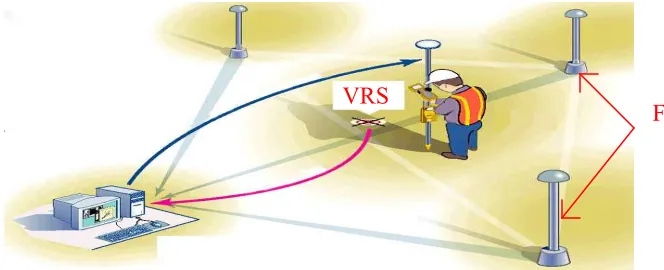
Figure 2.1 – VRS Network Operation (Source: Trimble 2005)
It is also worth realising that the central computer and associated software cannot maintain any number of virtual stations simultaneously (i.e. the maximum number of simultaneous users is limited by the capacity of the central server (Rizos and Han, 2002)). The infrastructure is also scalable, that is, the network may be expanded in the future to service a wider area.
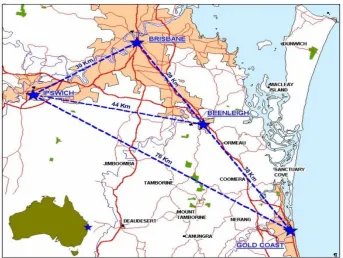
The VRS network used for this research has been established over the South-East corner of the Australian State of Queensland by the Queensland Department of Natural Resources and Mines (DNRM). The network consists of 4 reference stations, with the spacing between fixed base stations varying from 29km to 76km. Figure 2.2 shows the location of the VRS network in South-East Queensland, which is utilised for this research project.
VRS
Chapter 2 – Literature Review
Figure 2.2 – South-Eastern Queensland Trial VRS Network Configuration. (Source: Higgins 2001)
VRS can improve the efficiency of data collection and increase confidence in that data. VRS is designed to provide real time differential GPS corrections to a large number of users operating within a wide area network. This eliminates the requirement for individual base stations for each job as is required with conventional-RTK. The corrections are delivered to the user by way of the GSM (or similar) cellular network, overcoming the shortfalls of the Very High Frequency (VHF) radio link between base stations and rovers (traditionally the weakest link in the conventional-RTK system). Finally, given that VRS in effect uses multiple base stations to compute corrections, there is an inherent increase in observation redundancy giving the user greater confidence in the position solution. (Higgins, 2001)
Chapter 2 – Literature Review
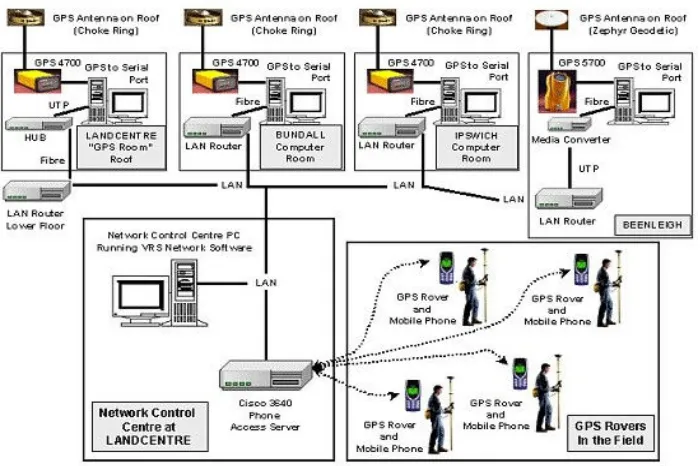
[image:24.612.142.492.149.382.2]The information technology and network design for the trial network utilised in this research is reproduced in Figure 2.3, showing the high speed local area network used to connect the various fixed components.
Figure 2.3 – Queensland Trial VRS Network, IT Infrastructure (Source: Higgins 2001)
2.3 The Latency Problem
2.3.1 What is Latency?
Although it may be better known for its effects on computer processor operations, latency is by no means a new concept with respect to dynamic GPS measurements. Latency, in general, may be defined simply as a measure of temporal delay (MM Internet, 1999). A further, more in-depth definition is given by (Interoute, 2005):
Chapter 2 – Literature Review
This is an example of latency in data transmission, but with specific reference to dynamic GPS observations, (Raymond, 2005) defines latency as the “delay between the time of fix and when it is available to the user”. Hence if the GPS is in
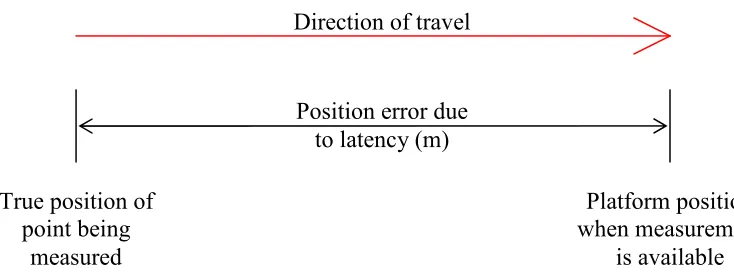
[image:25.612.124.491.279.418.2]motion, the platform on which the measurements are being made will move some distance during the time when the measurement is made and the time when it is available to the user (refer to Figure 2.4 below). With respect to VRS, this latency is a relatively unknown quantity which needs to be identified and compared to some form of standard (in this case conventional RTK surveying), for the benefit of users and potential users. Below is a graphical representation of the latency effect:
Figure 2.4 – The effect of Latency on the Position Solution.
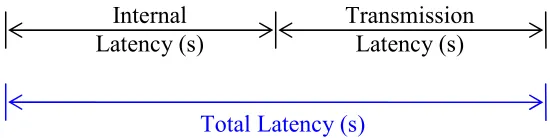
Latency may be divided into separate components for analysis. For example, total latency, with respect to GPS measurements, is comprised of both internal processing latency and transmission latency. There are also other factors which may contribute to the total latency of the system, but a detailed investigation is not presented as this research has concentrated on the effects of the combined total latency of the system.
Internal latency is that quantity of time which the instrument takes to complete its internal processes and present the data ready for use or transmission. Transmission latency is the period of time taken to send the measurement data from the originating source to the user, in the field for example (Bouvet et al, 2000).
Position error due to latency (m) Direction of travel
True position of point being
measured
Platform position when measurement
Chapter 2 – Literature Review
[image:26.612.193.468.137.206.2]It should again be noted that this project has aimed to quantify total latency only, with respect to VRS measurements. The concept of total latency is best demonstrated by the following figure (2.5):
Figure 2.5 – The Concept of Total Latency.
Given that position error due to latency is a function of the update rate (total latency) and the velocity of the vehicle (Campbell, Carney and Kantowitz, 1998), then for any given latency period, the dynamic platform position error will increase in proportion with the platform’s speed. This is an important fact to realise when designing the testing regime. Therefore this research hopes to assist in the determination of the relationship between platform velocity and position error due to latency for the VRS configuration under investigation, by completing the testing regime over a range of speeds. This would go some way toward facilitating a correction based on vehicle speed to be automatically applied directly to measurements which are made with this configuration. Of course, variations are possible for every different setup and individual latency calculations should be completed for the set-up in question before applying any correction to data.
A good definition of how latency affects GPS position is given by (Gibbings and O’Dempsey, 2005). The following quote relates to hydrographic measurements using GPS, but the principle remains the same:
“A time lag (latency) can be experienced between when a sensor record is measured and when it is recorded by the software. Similarly, a time lag (latency) may be experienced between when a GPS position is measured and when it is recorded.
Internal Latency (s)
Transmission Latency (s)
Chapter 2 – Literature Review
Most importantly, these two time lags may not be the same, and consequently the GPS logged position may not be exactly the same location as the depth sensor when the hydrographic data is logged.” (Gibbings and O’Dempsey, 2005)
This is particularly relevant to the study of latency in VRS measurements being undertaken in this research. Although the authors of this work (Gibbings and O’Dempsey, 2005) were using hydrographic depth sounding equipment as an external sensor, the system latency is very similar in that they have measured latency of the RTK system using short transects in opposing directions to quantify the latency as a lateral shift in position. This concept is expanded in the following section.
2.3.2 Latency in VRS-RTK GPS Measurements
Whilst there has been testing and evaluation of VRS-RTK accuracy in static surveying situations, further research is required with respect to dynamic measurement environments. (Higgins, 2001)
Given that there is very little information currently available regarding latency in the emerging field of VRS-RTK GPS, it becomes clear that it is an issue which must be addressed prior to the widespread implementation of such a system. (Raymond, 2005) asserts that latency may be a “significant source of error for a GPS in motion”.
Chapter 2 – Literature Review
the same paper, testing of latency was also conducted for RTK equipment (Trimble 5800 receiver) with similar results (0.53 seconds for the RTK system).
The positional error due to latency is a function of the time it takes for the system to calculate position and make it available to the user. Some of the early global positioning systems contain up to a few seconds worth of latency. (The Hydro graphic Society, 2002) and (Gallagher, 2002) state that common values for conventional RTK GPS latency (receiver latency) range from 300 to 500 milliseconds. It is also worth noting that some modern systems such as the Trimble MS750 receiver can reduce that figure to around 20 milliseconds (Trimble Navigation, 1999). Comparable data for VRS is not publicly available, but would be dependent on factors such as system configuration and the make and model of GPS receiver and ancillary equipment being used. This report intends to bridge the gap of research in this area, by quantifying latency with respect to a VRS user ‘in motion’ and comparing it to conventional RTK, for one particular equipment configuration.
In Technical Report 17 (OSG (N.Z.), 2003, p. 11), the New Zealand Office of the Surveyor-General states that for most applications 5 second latency is adequate however for applications such as fast moving platforms, less than 1 second of latency is required. That is to say that 5 seconds latency is not adequate for machine guidance and precision agriculture applications. This is reinforced by (Hu et al, 2002), who state that latency of up to one or two seconds is not critical for GPS RTK positioning, however this again this would not include high speed dynamic situations or those requiring the most precise dynamic measurements .
Chapter 2 – Literature Review
2.4 GPS in Dynamic Environments
Other research has shown that static performance of GPS receivers is not
necessarily indicative of dynamic performance and that few standards exist for
testing GPS performance under dynamic conditions (Stombaugh et al. 2002).
Previous studies have been completed to investigate the effects of latency in GPS measurements. (Smith and Thomson, 2003) outlined a method to evaluate GPS position latency in the guidance system of an agricultural aircraft. The method involved reflecting a beam of sun light vertically from the ground using two mirrors (to the author’s knowledge there is no explanation available regarding how the beam of light was checked to ensure it was vertical.). A photo-detector circuit under the wing triggered an extra data record to be inserted into the GPS data log. This position could then be compared with the known position of the light beam to determine position latency.
The authors report resulting latency determinations of less than 9 meters for all runs of the testing. This is a relatively small error given that the aircraft was travelling at 58 meters per second (around 208.8 km/h). The authors also report a high level of consistency in their findings, stating that the differences in consecutive runs were all less than 0.7 meters (7.77% of the error distance due to latency). The use of an optical sensor is seen as a very accurate means of referencing the dynamic measurements back to the fixed frame of reference and has therefore been adopted for this research project also.
Chapter 2 – Literature Review
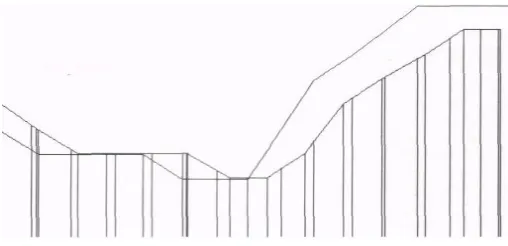
The method used to determine latency is to measure a series of transects (over areas of rapidly changing surface height) in opposite directions and compute the lateral shift in position (for runs in opposite directions). An example of the output from the latency test conducted by (Gibbings and O’Dempsey, 2005) is reproduced below (see Figure 2.6), clearly showing the lateral shift observed due to latency. The authors present this as an effective means of determining latency (justified by their results) and therefore this method of measuring transects (runs) in opposite directions is to be adopted as the basis for latency measurement in this project.
Figure 2.6 – Latency Test Results Showing Lateral Shift Observed by (Source: Gibbings and
O’Dempsey, 2005)
This previous research also utilises an external sensor (depth sounder in their case) that is synchronised with an incoming stream of GPS data, similar to the bar code reading device decided upon for use in this research project. The primary difference being that in the case of the VRS research, the sensor information does not need to be extracted (as is the case in (Gibbings and O’Dempsey, 2005)), since it is only being used to relate the VRS measurements to the fixed reference frame.
[image:30.612.188.442.276.399.2]Chapter 2 – Literature Review
2.5 Machine Guidance – A Potential Application
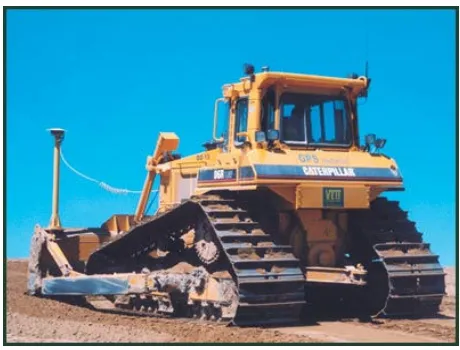
[image:31.612.213.443.292.467.2]The use of machine guidance systems has become increasingly popular over the past decade or so. Machine guidance systems are now becoming commonplace on large civil construction sites (see the image below of a bulldozer utilising machine guidance and note the GPS antenna mounted directly above one side of the blade) and also in precision agriculture applications. At the heart of the machine guidance system is a method for constantly and accurately locating the spatial position of the machine in question and then comparing that to the digital design for the work being undertaken.
Figure 2.7 – Bulldozer Utilising Machine Guidance – an Application (Source: Veit Companies 2005)
Chapter 2 – Literature Review
It should also be noted that while latency does affect the position solution, other factors may also be affecting the quality of the spatial position solution given by the VRS RTK GPS. A distinction must be made between latency and accuracy. Future testing is also required to gain an understanding of the accuracy which is achievable using VRS in dynamic applications such as machine guidance.
2.6 Summary: Chapter 2
The main point that may be drawn from this chapter is the requirement for further research into the effects of latency in VRS-RTK GPS measurements made in a dynamic environment. It also demonstrates the fact that latency is not a ‘new’ problem, and provides a review of some of the methods used in previous research to quantify latency in other forms of dynamic GPS measurements. Finally an overview of the VRS concept was given, including the status of testing in the Queensland VRS network.
Chapter 3 – Research Design and Methodology
---
CHAPTER 3
RESEARCH DESIGN AND METHODOLOGY
3.1 Introduction
The previous chapter established the need for a specific study into the effects of latency on VRS-RTK GPS measurements, where the measurements are made in dynamic situations.
The purpose of this chapter is to fully describe and document a method to quantify the latency present in GPS observations, made on a low speed moving platform. It is also intended that the following description of the methodology allow for full ‘traceability’ of the data gathered as a result of the testing and thereby allow the testing to be repeated or modified at any time in the future.
The method is designed to not only quantify VRS-RTK latency, but also to provide a direct comparison with the conventional RTK GPS technique, allowing potential users of the emerging VRS technology to assess its suitability for low speed dynamic positioning applications, when compared with conventional RTK.
Chapter 3 – Research Design and Methodology
3.2 Method
3.2.1 Reference Frame
To quantify any latency in the dynamic observations, the first step is to devise a method of referencing the measurements to fixed, stationary points. The previous chapter identifies a testing procedure where the fixed points are vertical beams of reflected light (Smith and Thomson, 2003) as outlined in section 4 of chapter 2. Given that the method used previously has demonstrated sound results measuring latency in a high speed dynamic environment, this methodology was originally based on the previous method, but has evolved to incorporate significant differences in determining a fixed reference frame and as such takes a varying approach to the problem. The main similarity that may still be identified is that the spatial position of the fixed marks must be accurately known and provides the basis for comparing the dynamic measurements to known stationary reference points.
The method developed in this testing regime uses an optical barcode reading device fixed to the moving platform, instead of a beam of light and a photo detector circuit as is used by Smith and Thomson (2003). The stationary points of reference used in this adaptation of the methodology are barcodes fixed to the face of stakes driven firmly into the ground, adjacent to the path of the moving platform. The fixed position of these stakes is measured by traditional static survey (either using GPS or a total station) both before and after the completion of the testing regime as a check to ensure the stakes do not move during testing.
3.2.2 A Dynamic Platform
Chapter 3 – Research Design and Methodology
[image:35.612.171.498.176.377.2]The GPS antenna is mounted on a purpose built frame, and the barcode reading device is also mounted on this frame, directly below the GPS antenna (checked using a plumb bob, see Figure 3.2 below). All other equipment as described below is mounted in the rear of the utility.
Figure 3.1 – Dynamic Platform, Utility with Frame Attached. (Author) GPS Antenna Mount
[image:35.612.113.500.412.689.2]Chapter 3 – Research Design and Methodology
3.2.3 Setup Configuration
Design of the equipment configuration is a major component of this research project. Section 3.3 provides an in depth description of the problems encountered with this task, however a brief description of the major equipment is provided herein. A Trimble 5800 GPS unit was utilised for this testing. It features an antenna with built in GPS receiver and RTK radio. If the VRS signal is required, the cellular phone is usually plugged into the RS232 port on the bottom of the 5800, but this is discussed in greater detail in section 3.3. An RTK base station is also required near the test site to allow for the RTK correction information to be obtained.
One of the most complex components of the design process associated with this methodology is concerned with interfacing the barcode reader to the data recording device (laptop or TSCe). The only possible means for connecting the bar code reader to the data recorder / laptop in a simple fashion is by way of a RS 232 serial connection (see the discussion in section 3.3 of this chapter, page 29). All other means of interface require the development of dedicated electronic circuits, which are beyond the scope of feasibility for this research project.
Chapter 3 – Research Design and Methodology
The methodology designed in this research utilises Trimble GPS equipment and no testing is done using GPS receivers from other manufacturers. Further future testing is required using a similar method as that described in this chapter for each individual equipment configuration, before any generalised conclusions can be made regarding other makes of GPS receiver.
3.2.4 Measurement Sequence
The measurement sequence for this testing consists of driving the vehicle (dynamic platform) with all required equipment on board along a straight section of road, keeping the vehicle’s tires against the kerb to maintain a consistent, repeatable path. The vehicle is driven in both directions past the fixed barcodes that are placed adjacent to the roadway (see Figure 3.4 below). This is done over the entire range of speeds for which the barcode reader will operate, as determined during initial testing.
In total, 4 barcodes are placed along the road section, at approximately 2 metre intervals, for a total run length of approximately 6 metres plus run-up and run-down distance to get the vehicle up to and down from the required speed. Note that for testing at higher speeds, the fixed reference marks may need to be spaced further apart to allow for greater latency errors in distance.
Chapter 3 – Research Design and Methodology
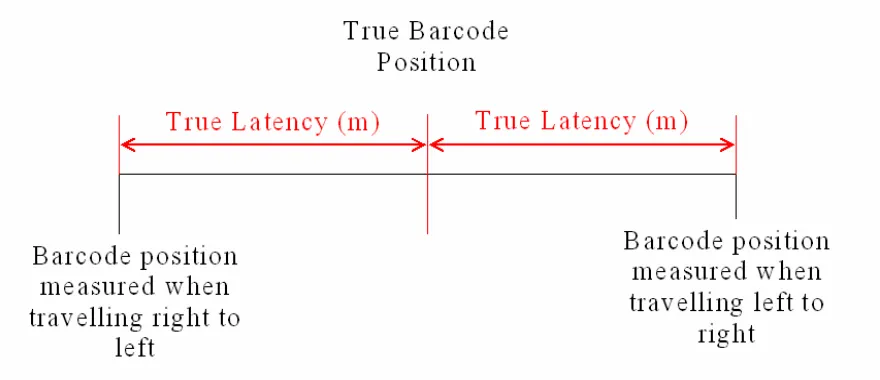
Figure 3.4 Barcode Reader Moving Past the Fixed Reference Points. (Author)
Chapter 3 – Research Design and Methodology
Figure 3.5 – Using the Measurement Sequence to Determine Latency. (Author)
The actual speed at which the testing is conducted is not a critical factor. The primary requirement relating to platform speed is that it remains constant for each run at a given speed, and in both directions. Therefore, low range four wheel drive is used to maintain a constant speed, with the driver concentrating on maintaining a consistent engine revolution value for a given gear ratio. This also creates a requirement that the section of road used for testing be relatively level, because travelling up a slope at a certain revolution value will be slower than travelling downhill at the same revolution value (for any given gearing ratio).
Chapter 3 – Research Design and Methodology
[image:40.612.139.478.206.284.2]The measurement data being logged by the data recorder is synchronised and combined with the barcode reader information using the external sensor function in TerraSync (Trimble Navigation, Christchurch, NZ) software. The synchronisation is done within the software by proportioning the time between consecutive GPS measurements and the input of external sensor information. For example, if the GPS is logging position data at 1 second intervals, the measurement timeline might be:
Figure 3.6 – GPS Measurement Timeline (fictitious example). (Author)
Once the input of external sensor information begins, the software will assign time and position data to the external sensor information based on when it occurs relative to the GPS measurements either side of this event. The resulting timeline might be:
Figure 3.7 – GPS Measurement Timeline Example Showing External Data Record Synchronisation. (Author) 6 sec x,y,z 7 sec x,y,z 8 sec x,y,z 9 sec x,y,z 6.71 sec x,y,z 8.68 sec x,y,z
GPS GPS GPS GPS
[image:40.612.147.493.471.575.2]Chapter 3 – Research Design and Methodology
3.2.5 Validating the Method
Before the actual testing takes place, it is prudent to validate the methodology to ensure it works as planned, and to ensure that all necessary data is being obtained. The primary objective of this initial testing is to ensure that the barcode reader can read the barcodes properly in a dynamic situation and insert a record into the data file of the data logger (TSCe) as we require. The initial testing gives an indication of what speed ranges the barcode reader will operate over.
Once the barcode reader arrived, initial testing was conducted in Toowoomba at the USQ campus. Since the VRS signal is not available in Toowoomba, only the RTK correction could be applied in this initial testing. This is still sufficient to provide an understanding of the speed ranges over which the barcode reader will work. It also gives an understanding of how the testing regime works and also what format the output data is in.
[image:41.612.63.564.597.721.2]Given that VRS is not to be used, a Trimble TSCe is used for data logging, with the barcode reader being plugged into the DB9 (com1) serial port. For this initial verification, the ANANGA semi-permanent base station at the USQ is used as the conventional RTK base station. An example of the raw data gathered during this initial testing is presented in Table 3.1 below and clearly shows the external sensor (barcode reader) information that has been recorded during this initial testing (displayed in the ‘TEXT’ column).
Table 3.1 – Sample raw data file generated during initial testing. Not that since only 2 bar
codes were used at this initial stage, both were encoded as 1, and read as 1.
ID EASTING NORTHING ELEVATION TEXT CHANNEL GPS_DATE GPS_TIME
97 394726.325 6945723.619 688.398
1
1 13/01/2006 01:54:26.338pm
179 394725.901 6945724.646 688.446
1
1 13/01/2006 01:55:47.149pm
181 394725.905 6945724.648 688.441
1
Chapter 3 – Research Design and Methodology
3.3 Problems and Contingencies
There are two primary problems that were encountered in the course of this research project. The first problem concerns the investigation and subsequent supply of an appropriate barcode reading device. The second problem relates to the task of interfacing all the necessary hardware and software components to conduct the testing.
The majority of the barcode reading devices which are available utilise the Universal Serial Bus (USB) port or the PS2 port (usually reserved for keyboard / mouse) of the PC for connectivity. The initial barcode reader models investigated use either USB or PS2 ports, making them unsuitable (because the digital signal could not be sent to TerraSync). The models of barcode reader tested initially are:
• OPT6125 Scanner from Opticon (USB Connection)
• 1000 CCD Scanner from CipherLab (PS2 Connection)
Neither was suitable due to their method of connection to the Data logger. Both are capable of reading data into some word processing programs, but not into TerraSync. Therefore it becomes clear that RS232 serial (com port) connection is required. Many barcode readers available on the market feature RS232 connectivity. The next reader tested was the Datalogic Touch 90 CCD scanner with RS232 connection. Although the device would plug into the data recorder, no signal was achieved because the device requires its own power supply and cannot draw power from the host device (as is the case with USB or PS2 devices).
Chapter 3 – Research Design and Methodology
This makes the Touch 90 scanner unusable, because any delay in the upload process introduces additional latency into the system and would therefore fail to provide a true measurement of the latency found in a ‘real world’ situation. This means that the 3 primary requirements to connect a barcode reader to the laptop and then import the signal data into TerraSync (as described above) are:
• Device must use a RS232 serial (com port) connection,
• Device must have it’s own power supply and
• Device must auto-upload data to the computer.
The only suitable device found on the market was the Microvision Flic barcode scanner (see figure 3.3). The technical specifications for this barcode reader are reproduced in appendix C of this dissertation (Expansys Australia).
This testing of barcode readers has taken a lot longer than the author had initially anticipated. Furthermore, unforseen extended delays (which have no explanation from the supplier) in the delivery of the barcode reader and associated equipment from the manufacturer have prevented the testing from being competed earlier in the course of this project. The author believes he has a much better understanding of how to both deal with suppliers and control logistics as a result of undertaking this exercise (as well as estimating task durations).
Chapter 3 – Research Design and Methodology
The full implementation of the methodology developed in chapter 3 has been attempted using surveying / GPS equipment provided by the DNRM in Brisbane. Available equipment included a Trimble R8 GPS receiver / antenna / radio unit, a GSM cellular phone with serial cable and a Trimble TSCe data recorder running TerraSync. Each problem encountered in this last phase of the project will now be discussed in detail.
ISSUE 1. Mobile Phone Connectivity / TerraSync
The first problem encountered during testing in Brisbane involves utilising the VRS correction data at the same time as an external sensor. The standard software running on the TSCe is the Trimble Survey Controller package. When completing a survey using this software on the TSCe in conjunction with the R8 receiver, the mobile phone is plugged into the serial port on the bottom of the R8 and survey controller will dial the number for the correction data through the receiver.
Chapter 3 – Research Design and Methodology
ISSUE 2. Laptop Computer for Data Recording
At this stage it was obvious that the primary issue was a lack of serial ports on the TSCe, so an attempt was made to do away with this device and a laptop computer was trialled as the data recording device. The laptop has TerraSync installed and utilises a USB to 4 serial port hub to provide sufficient serial ports. These ports automatically enumerate themselves as Com 7, 8, 9 and 10 when the device is connected. The barcode reader is plugged into com 7 and tested to ensure that this configuration would allow the import of external sensor data. This works fine. The receiver is connected to com 8 and a connection is established. The mobile phone is connected through com 9 and the driver software for the connection cable is installed.
The problem with this configuration arises when the phone settings are put into TerraSync. The correction source is set to VRS and the phone number is put into the software. The software then asks which modem to use to dial the number, and cannot find the modem of the mobile phone. The only options given are the built in 56k dial-up modem and the built in Bluetooth modem of the computer.
A method could not be found to get the software to recognise the mobile phone on com 9 as a modem capable of creating the VRS connection with the LANDCENTRE VRS server. This makes the laptop unsuitable as the data recording device (when using VRS) unless the corrections can be obtained by some other means (perhaps the internet for example).
ISSUE 3. TSCe I/O Ports
Chapter 3 – Research Design and Methodology
[image:46.612.147.460.215.377.2]The TSCe does have another multi-serial port usually reserved for the Bluetooth ‘Bluecap’ adaptor or the USB and phone line adaptor. The next configuration attempted was to use a USB to serial adaptor coming out of the Trimble USB and phone line adaptor to connect the barcode reader through this port. This was unsuccessful because software drivers for Windows CE are not available for the USB to serial adaptor.
Figure 3.8 TSCe I/O Port Configuration. Note the DB9 (RS232 serial) port on the left and the 26 pin multi -
port on the right, as well as the Infrared port directly above the 0 Shell port. (Trimble Navigation Ltd.)
Chapter 3 – Research Design and Methodology
At this stage the technical experts at Herga were consulted regarding any other possible means of creating this connection but no solution could be found. If TerraSync could dial the mobile phone through the receiver (as Survey Controller can) then this would free up the com 1 port on the TSCe for the external sensor, and for this feature to be integrated into future versions of the software is therefore a major recommendation of this research.
Possible Future Solutions
Further research by the author has also given rise to another possible solution to this problem. It is understood that a new version of the TSCe will soon be commercially available, known as the TSC2. It is also understood that the DNRM in Brisbane has one of these new data recorders on order. The new TSC2 will feature an additional USB port, in addition to the RS2332 (com 1) serial port. A USB cable is also available for the barcode reader, possibly allowing connection by this means.
Chapter 3 – Research Design and Methodology
3.4 Summary: Chapter 3
This chapter describes and fully documents a method for quantifying latency in low speed dynamic GPS measurements, and through changing the correction data source and repeating testing, provides a comparison between different types of correction data facility. The method has been tested using conventional RTK corrections to ensure sufficient data is collected in the process. Although it has not been tested in the field due to the device not yet being available, the author can see no reason why the use of the soon to be released TSC2 data recorder (possibly in conjunction with a Bluetooth enabled mobile phone) would not allow future research efforts to complete this evaluation.
Chapter 4 – Data Analysis
---
CHAPTER 4
DATA ANALYSIS
4.1 Introduction
The previous chapter fully describes and documents a method for measuring what if any latency is present in dynamic VRS measurements. This method also provides a comparison with the conventional RTK technique, by simply changing the real time correction source from VRS to conventional RTK.
This section intends to present an analysis of the data analysis used to obtain useful information resulting from the implementation of the testing regime utilising only RTK corrections. Given that the VRS data was not able to be captured as a part of this research project for the reasons described in the previous chapter, the analysis of the RTK data will give a foundation for ongoing research in this area. It should however be noted that the data analysis process for VRS data is exactly the same as for the RTK data, since the output files would be in an identical format and the VRS / RTK corrections are automatically applied before the data is recorded.
4.2 Data Analysis
4.2.1 Raw Data Collection
Chapter 4 – Data Analysis
The TerraSync program includes a feature for combining the GPS data with the data being received from an ‘external sensor’ (located in the ‘setup’ menu), in this case, the barcode reader. The process of combing this data was discussed in section 3.2.4 (page 24) of the previous chapter.
Once the raw data has been brought into the TSCe, some cursory analysis using TerraSync can be performed, primarily as a check in the field that sufficient data has been captured to facilitate the later processing. This initial analysis includes reviewing the raw data files and basic on-screen plotting of the collected data within TerraSync, as a further check to make sure the captured data ‘looks right’.
4.2.2 Data Transfer to Personal Computer
The raw data files must then be ‘dumped’ to a computer for analysis. The import of raw data is controlled from the personal computer (PC) within Trimbles’ Pathfinder Office software package. The Trimble Data Transfer utility is initiated from within Pathfinder Office, once the TSCe is connected by USB adaptor to the PC. A connection is established between the two devices using Microsoft ActiveSync and the raw files are transferred to the computer. These raw files are in the .SSF format and can be opened using Pathfinder Office.
4.2.3 Outputting Data for Analysis
Chapter 4 – Data Analysis
The first output file will contain all the points logged at the interval set by the user (every 1 second in this case). The second file will contain the sensor information, including the determined position of the sensor at the time of each sensor reading. In this case that will occur every time the barcode reader passes by the fixed barcodes. These two files may be combined as required by simply copying one into the other and performing a sort based on point ID numbers.
4.2.4 Analysing the Database Information
The majority of the analysis is performed using the Microsoft Excel spreadsheet program. Raw data relating to the measured position (corrected using conventional RTK in this case) of the fixed barcodes is extracted from the raw data files as described above (also see Table 4.1 below for an example).
Table 4.1 Sample Combined Output File. Table 4.1 shows combined output file of both
positions every second as well as sensor data.
ID Easting Northing Elevation TEXT GPS_Time GPS_Second 90 394843.210 6946275.715 685.714 01:02:49.000pm 442983.000 91 394842.879 6946275.690 685.716 01:02:50.000pm 442984.000 92 394842.569 6946275.656 685.706 01:02:51.000pm 442985.000 93 394842.542 6946275.654 685.707
5
01:02:51.083pm 442985.084 94 394842.246 6946275.638 685.717 01:02:52.000pm 442986.000 95 394841.891 6946275.604 685.739 01:02:53.000pm 442987.000 96 394841.447 6946275.560 685.743 01:02:54.000pm 442988.000 97 394840.963 6946275.534 685.780 01:02:55.000pm 442989.000 98 394840.599 6946275.500 685.772 01:02:56.000pm 442990.000 99 394840.212 6946275.477 685.795 01:02:57.000pm 442991.000 100 394840.084 6946275.473 685.799
4
[image:51.612.98.544.426.676.2]Chapter 4 – Data Analysis
For each run a separate file is logged in the field and subsequently output through Pathfinder Office. From these raw files the vehicle speed is calculated, utilising the time of measurement data (to 1/1000th of a second) and the distance between the barcodes (known from the static measurements of the bar code positions to the nearest millimetre), and applying the relationship:
Distance = Speed Time
This calculation is performed for each run pair (i.e. up and back) to ensure that each of the run pairs at each speed share a constant speed. If the majority are the same speed but one run pair is significantly different, then that run should be omitted from the calculation of average latency for that speed range. If the outlying run pair is included, it will distort the average latency computed for that speed (higher speed observations will obviously show a larger distance error due to latency).
From the raw position data, the latency for each run pair can be calculated. Averages of the latency distance error can be computed for the run pairs which are made at the same speeds (i.e. rejecting any outliers as explained above). This results in average latency distance errors for each.
Chapter 4 – Data Analysis
Table 4.2 – Sample Table Showing Raw Barcode Position (Sensor) Data. These positions
have been corrected in the GPS receiver using a fixed RTK solution. The text column gives the
encoded value of the barcode as read by the barcode reader. Note also the GPS time output to
1/1000th of a second.
ID Easting Northing Elevation Text Channel GPS_Date GPS_Time
33 394839.970 6946275.457 685.787 4
1 27/01/2006 02:24:45.532pm
88 394835.809 6946275.168 685.924 1
1 27/01/2006 02:25:39.260pm
180 394835.776 6946275.148 685.947 1
1 27/01/2006 02:27:10.263pm
191 394840.378 6946275.512 685.811 4
1 27/01/2006 02:27:20.514pm
420 394835.704 6946275.147 685.947 1
1 27/01/2006 02:31:08.424pm
428 394837.656 6946275.307 685.887 4
1 27/01/2006 02:31:15.858pm
437 394840.371 6946275.520 685.781 4
1 27/01/2006 02:31:23.282pm
502 394839.974 6946275.471 685.815 4
1 27/01/2006 02:32:27.156pm
582 394835.781 6946275.127 685.945 1
1 27/01/2006 02:33:46.908pm
4.2.5 Results
Finally, the results can be graphed in Excel to provide a graphical representation of the latency error for each run over the range of different speeds. Had the VRS signal been logged as well, these graphs would be output for both the conventional RTK and the VRS measurements, thereby presenting a graphical comparison of the latency for both these systems.
Chapter 4 – Data Analysis
Table 4.3 – Relationship Between Platform Speed and Position Error (Distance Difference). Not that the
direction of travel for this testing was in an almost due east / west direction.
Barcode Value / No. Speed Km/h Measured Easting True
Easting Difference
Measured Northing
True
Northing Difference
Distance Difference
4
1.16 394840.298 394840.201 0.097 6946275.511 6946275.471 0.040 0.104924 1.18 394840.084 394840.201 -0.117 6946275.473 6946275.471 0.002 0.117017 1.75 394840.378 394840.201 0.177 6946275.512 6946275.471 0.041 0.181687 2.1 394840.001 394840.201 -0.200 6946275.482 6946275.471 0.011 0.200302 2.16 394839.995 394840.201 -0.206 6946275.468 6946275.471 -0.003 0.206022 2.190 394839.952 394840.201 -0.249 6946275.462 6946275.471 -0.009 0.249163 2.21 394839.970 394840.201 -0.231 6946275.457 6946275.471 -0.014 0.231424 2.38 394839.937 394840.201 -0.264 6946275.447 6946275.471 -0.024 0.265089 2.540 394839.974 394840.201 -0.227 6946275.471 6946275.471 0.000 0.227000
1
[image:54.612.52.586.107.440.2]0.560 394835.704 394835.687 0.017 6946275.147 6946275.120 0.027 0.031906 0.91 394835.749 394835.687 0.062 6946275.150 6946275.120 0.030 0.068877 1.190 394835.776 394835.687 0.089 6946275.148 6946275.120 0.028 0.093301 1.430 394835.809 394835.687 0.122 6946275.168 6946275.120 0.048 0.131103 1.52 394835.557 394835.687 -0.130 6946275.136 6946275.120 0.016 0.130981 1.750 394835.515 394835.687 -0.172 6946275.125 6946275.120 0.005 0.172073 1.8 394835.485 394835.687 -0.202 6946275.128 6946275.120 0.008 0.202158 1.99 394835.448 394835.687 -0.239 6946275.123 6946275.120 0.003 0.239019 2.57 394835.455 394835.687 -0.232 6946275.095 6946275.120 -0.025 0.233343
Figure 4.1 - Barcode 4 Latency
[image:54.612.98.524.481.716.2]Chapter 4 – Data Analysis
Figure 4.3 - Latency - Combined Runs
0 0.05 0.1 0.15 0.2 0.25 0.3
1 2 3 4 5 6 7 8 9 10 11 12 13 14 15 16 17 18
Run No. (I.e. Increasing Speed)
[image:55.612.109.528.372.659.2]L a te n c y E rr o r (m )
Figure 4.2 - Barcode 1 Latency
0 0.05 0.1 0.15 0.2 0.25 0.3
1 2 3 4 5 6 7 8 9
Run No. (I.e. Increasing Spee d)
Chapter 4 – Data Analysis
It is clear to see from the graphic representations of the results provided above that a significant latency error is affecting the position solution of these dynamic RTK measurements, especially when the low platform speed is considered (from around 0.5 to 2.6 km/h). These results raise two important questions which should become the immediate focus of ongoing research efforts:
1. How much of this latency error is attributable to the GPS measurement component and how much is accounted for within the barcode reading device?
2. To what extent does the size of the barcode which is fixed to the stake in the ground affect the position at which the barcode is being measured?
The first point is difficult to determine and may be the source of its’ own complete investigation / research project. The second point is a little easier to determine. The width of the barcodes used in this testing is 50mm because it was found during the initial trials that barcodes of less than 50mm almost doubles the occurrence of the reader failing to detect the fixed barcode. Therefore, it would not be unreasonable to expect that because we are comparing travel in both directions, up to 100mm (0.1m) of the error could be attributable to the inaccuracy caused by using a 50mm wide barcode. This
would however also require further investigation and has not been completed as part of this research due to time constraints.
Chapter 4 – Data Analysis
The final point worth noting is that the relationship between platform speed and latency error appears to be linear. This is demonstrated in the combined graph (Figure 4.3) by the addition of the linear trend line in orange. This is to be expected because if the speed is doubled and the time (latency) remains fixed, the relationship of speed x time = distance shows that the distance value should double (i.e. 2 x 1 = 2 and 4 x 1 = 4, where the 4 would demonstrate a doubling of the platform speed).
4.3 Summary: Chapter 4
Chapter 4 has presented the method of data analysis that is applied to the data captured as a result of the implementation of the methodology outlined in chapter 3. This is a complete description of the methods of analysis required to extract useful information regarding latency in dynamic VRS RTK measurements from the raw data files attained in the implementation of the research methodology.
Chapter 4 has also demonstrated that latency is affecting the results that have been obtained from the testing carried out as an integral component of this research. As such, it becomes all the more important that further investigation of these effects is undertaken, over a greater range of speeds to allow potential users of dynamic VRS data to correct for the effects of latency in real time.
Chapter 5 – Discussion and Summary
---
CHAPTER 5
DISCUSSION AND SUMMARY
5.1 Introduction
Chapter 4 has outlined the data analysis processes required to extract useful information from the data that is collected upon implementation of the testing regime developed in this research project, to quantify latency in low speed dynamic VRS RTK GPS measurements. Chapter 4 also demonstrated that there is some latency error present in the gathered data.
During the course of this research, several issues have arisen which need to be addressed in the future. Chapter 5 provides an outline of the current status of the research, and also makes recommendations regarding the continued research and investigation of latency in dynamic VRS measurements.
5.2 Further Research and Recommendations
5.2.1 VRS Testing
Chapter 5 – Discussion and Summary
It is expected that this will initially involve the testing of the TSC2 once it becomes available, in an attempt to gather external sensor position information in conjunction with the VRS correction facility.
5.2.2 Additional TerraSync Requirements
As previously mentioned, this research has also led to the discovery that it is not possible to utilise the external sensor function in TerraSync on a TSCe data recorder and VRS correction data simultaneously. It is therefore a primary recommendation stemming from this research project that future versions of TerraSync should be able to dial the cellular mobile phone from the receiver, in the same way that the Survey Controller software package can (this information has been passed on to the manufacturer).
5.2.3 Testing at Higher Speeds
Future testing is also required to investigate latency and its’ effects on higher speed applications to gain a more thorough understanding of the relationship between platform speed and latency, in dynamic VRS measurements. It is the authors’ opinion that testing is required up to around 25 kilometres per hour in order to be of use to the precision agriculture community.
Chapter 5 – Discussion and Summary
One possible method to allow higher speed testing may be the design of a dedicated electronic circuit to facilitate input of ‘through beam’ optical sensor data into a Trimble data recorder (this was briefly considered in this project however time constraints proved prohibitive). For the same reasons given in this dissertation (i.e. there is insufficient com ports on the TSCe), the Trimble TSC2 running TerraSync will probably be the required data logging device (but this would need to be determined during the investigation mentioned above). The only other possibility would be to find a means of expanding the port capabilities of the TSCe, but this would probably require a dedicated device with Windows CE driver software, which to the best of the authors’ knowledge is not currently available (after a brief search).
5.2.4 Testing Involving Different Manufacturers
Future testing of the VRS network should also include experimentation with different equipment configurations. All the testing put forward in this research project utilises Trimble GPS equipment. Future testing should also be conducted to fully investigate the effects of latency in dynamic VRS networks, where trials are conducted using different makes of GPS equipment, and different models of equipment from the various manufacturers. This would provide a more generalised view of how latency affects dynamic measurements within VRS networks.
5.2.5 Accuracy Testing
Chapter 5 – Discussion and Summary
5.3 Summary
Chapter 5 presents various recommendations regarding possible future direction for ongoing research into the effects of latency on dynamic VRS measurements. The continuation of the research presented in this dissertation is required; in particular, the methodology developed herein needs to be carried through to completion, possibly through ongoing research efforts at the USQ once the required equipment becomes available. The TSC2 should be trialled to investigate whether or not this hardware can provide a solution to the current problem of a lack of serial ports on the data recording device. This research has also highlighted the need for a function to be incorporated into TerraSync to allow for the simultaneous use of VRS and an external sensor, namely enabling TerraSync to dial the VRS mobile phone from the receiver, not the TSCe com port 1.
Bibliography
---
BIBLIOGRAPHY
Bar-sever, Y. E., 2000, Marine Benefits from NASA’s Global Differential System: Sub Meter Positioning, Anywhere, Anytime, Dynamic Positioning Committee, Marine Technology Society, Dynamic Positioning Conference (Sensors).
Bouvet, D., Garcia, G., Improving the Accuracy of Dynamic Localisation Systems using RTK GPS by Identifying the GPS Latency, Institut de Recherche en Communications et Cybernétique de Nantes, France.
Campbell, J., Carney, C., Kantowitz, B., 1998, Human Factors Design Guidelines For Advanced Traveler Information Systems (Atis) And Commercial Vehicle Operations (Cvo) , Chapter 5, Vehicle Location Accuracy, Battelle Human Factors Transportation Center 4000 NE 41st Street Seattle, WA. [online], Available from:
http://www.fhwa.dot.gov/tfhrc/safety/pubs/atis/ch05/ch05_10.html [Viewed April 8th, 2005]
DLI, 2005, Landmarks – ‘Curtin Uni to Get $120,000 for Cutting Edge CORS Study’, Department of Land Information, Western Australian Government, p14, available from: http://www.dli.wa.gov.au/docvault.nsf/web/LM_DLI_landmarks45_200509/$FILE/LM_ DLI_landmarks45_200509.pdf
Bibliography
Higgins, M., 2001, An Australian Pilot Network for a Real Time Kinematic GPS Network Using the Virtual Reference Station Concept, [online], Available from:
http://www.fig.net/pub/proceedings/korea/full-papers/session11/higgins.htm [Viewed April 3rd, 2005]
Hu, G., Khoo, V., Goh, P., Law, C., 2002, Internet-based GPS VRS RTK Positioning with a Multiple Reference Station Network, Journal of Global Positioning Systems (2002), Vol. 1, No. 2: 113-120 [online], Available from:
http://www.gmat.unsw.edu.au/wang/jgps/v1n2/v1n2pE.pdf [Viewed April 6th, 2005]
Interoute Communications Limited, 2005, Glossary of Terms [online], Availabl