UNIVERSITY OF SOUTHERN QUEENSLAND
G
G
EO
E
OG
GR
RA
AP
PH
HI
IC
C
I
I
NF
N
F
OR
O
RM
MA
AT
TI
IO
ON
N
S
S
YS
Y
ST
TE
EM
M
B
B
AS
A
SE
ED
D
M
M
AN
A
NU
UR
RE
E
A
A
PP
P
PL
LI
IC
CA
AT
TI
IO
ON
N
P
P
LA
L
AN
NN
NI
IN
NG
G
A Dissertation submitted by
Badri Bahadur Basnet, M. Eng.
For the award of
D
D
OC
O
CT
TO
OR
R
O
OF
F
P
P
HI
H
IL
LO
OS
SO
OP
PH
HY
Y
CERTIFICATE OF DISSERTATION
I certify that the ideas, investigations, analysis, results, discussions, and conclusions
reported in this dissertation are entirely my own work, except where otherwise
acknowledged. I also certify that the work is original and has not been previously
used to earn academic awards.
Date: ……/……/… …
Signature of Candidate – Badri B Basnet
ENDORSEMENT
Date: ……/……/… …
Signature of Supervisor (1) – Dr Armando A Apan
Date: ……/……/… …
ABSTRACT
The disposal of animal waste has become a problem in many parts of the world due
to the rapid growth in the number and the size of intensive animal industries. Safe
waste disposal sites are rarely available and the relocation and/or treatment of animal
waste is seldom economically viable. The reuse of animal waste for energy recovery
and re-feeding is also not popular. Animal waste is a valuable source of plant
nutrients and a very good soil conditioner, and has been commonly applied as
fertiliser to agricultural fields. However, due to the increasing oversupply of animal
waste in recent years, it has often been applied in excess to the agricultural fields.
Excessive application of animal waste, without due consideration of its implications,
is a serious concern. The run-off and leaching losses of nutrients from the fields
fertilised with animal waste have contributed significantly to the eutrophication and
toxic blue-green algae blooms in surface water systems and nitrification of ground
water systems. It has also led to nutrient imbalances in the soils and odour pollution
to the surrounding communities. The animal waste, which is a valuable source of
plant nutrients, has thus become both an economic and environmental burden, and
there is a need to develop a strategy for its sensible use as a fertiliser in agricultural
fields.
Sensible use of animal waste involves the consideration of all the agricultural,
environmental, social, and economical limitations. A rational method of achieving
where it can be relocated and applied economically, limit the application rates to a
safe level, and observe appropriate manure management practices. This study
addressed each of these components by developing a comprehensive manure
application plan (MAP) for the site-specific use of animal waste as fertiliser in
agricultural fields.
Various geographic information systems (GIS) based techniques, including a
weighted linear combination model and map algebra based cartographic modelling,
were employed to achieve the goal. The appropriateness of the existing techniques
and procedures were evaluated and modified to meet the current input requirements.
New methods of analysis were devised as necessary. The Westbrook sub-catchment
of the Condamine River catchment in south-east Queensland was selected as the
study area. The sub-catchment covers 24,903 hectares and contains 39 intensive
animal industries. The catchment is also a part of the Murray-Darling Basin, which
has been suffering from toxic blue green algae blooms recurrently since 1991.
This study identified that only about one-fifth of the sub-catchment area is suitable
for animal waste application. Depending on the method of site suitability analysis
and the number of input factors used the suitable area ranged between 16 and 22
percent. This comparatively small area is mainly due to the presence of a large
proportion of non-agricultural areas in the sub-catchment. The suitable areas were
also found to have various degrees of suitability for waste application. However, the
degree of site suitability was affected by the number of input factors used in the
analysis, the weighting of the factors, and the method of factor attribute
Conventional methods of weighting input factors were found to be cumbersome and
not particularly suitable. Hence, this study developed a new ‘objective oriented
comparison’ method of factor weighting. Standardisation of input factors using a
continuous, rather than discrete, classification (ie fuzzy set) method was found to be
more consistent in degree of suitability determination. The discrete classification of
factor attributes into classes of different numbers and sizes, and the weighting of
classes to a sum of one, were identified as a limitation in using this standardisation
method. A new ‘weight adjustment’ method was devised and demonstrated to reduce
factor-weighting biases.
The suitable sites, degree of site suitability, and other relevant spatial and non-spatial
information were processed within a GIS framework to develop a comprehensive
manure application plan. The inherently high presence of available phosphorus in the
soils of the study area was recognised and the P2O5 content in the manure was used
as the basis for determining manure application rates. A complimentary nitrogen
supply map was also generated. Manure management practices applicable to the
LIST OF PUBLICATIONS ARISING FROM THIS WORK
Basnet, B B, Apan, A A and Raine, S R (2000). Selecting Sites Suitable for Animal Waste Application Using a Vector GIS. Proceedings of the Society of Engineering in Agriculture (SEAg) Conference, 2-5 April, Adelaide, Australia.
Basnet, B B, Apan, A A and Raine, S R (2001). Selecting Suitable Sites for Animal Waste Application using a Raster GIS. Environmental Management, 28 (4), p.519-531. DOI: 10.1007/s002670010241.
Basnet, B B, Apan, A A and Raine, S R (in press). Geographic Information System Based Manure Application Plan. Journal of Environmental Management, volume 64. DOI: 10.1006/jema.2001.0484
ACKNOWLEDGEMENTS
I wish to sincerely thank my supervisors Dr Armando A Apan and Dr Steven R
Raine who have contributed equally and complemented each other in guiding me
throughout this study. This study would not have been possible without their
continuous guidance, supervision, encouragement, and support. I would also like to
thank the Faculty of Engineering and Surveying for providing a scholarship for this
work. My thanks are also extended to the staff members of the Faculty and the Office
of Research and Higher Degrees for their continuous support.
I wish to extend my thanks to Mr Mark Schuster (Toowoomba City Council) for
providing some of the more important datasets, organising field visits, and giving
valuable advice. I also wish to thank the members of the AgWise research group for
their constructive comments and suggestions, and to acknowledge the assistance of
Mr Andrew Biggs, Mr Steve Donald (Department of Natural Resources), and Mr Bill
Mills (Department of Primary Industries) in data acquisition. I would also like to
acknowledge the Environmental Protection Agency (Queensland) and Australia
Surveying and Land Information Group for making relevant information available.
Finally, I wish to express my sincere thanks to my wife Bhagabati, son Prajwal and
daughter Prasamsa for their continuous encouragement and support throughout this
study. I would not have been able to complete this work without them allowing me to
carry on with the project work, often at the expense of more important parental
TABLES OF CONTENTS
1 GENERAL INTRODUCTION 1
1.1 Problem statement 1
1.2 Aim 4
1.3 Research approach 5
2 REVIEW OF LITERATURE 6
2.1 Introduction 6
2.2 Animal waste and the environment 6
2.3 Utilisation of animal waste 10
2.4 GIS as a tool for manure management 15
2.4.1 GIS and spatial analysis 15
2.4.2 Location modelling for waste application 18
2.4.3 Degree of site suitability for site-specific decision making 20
2.4.4 Application of GIS for site-specific manure management 22
2.5 The objectives 23
3 COMMON RESEARCH METHODS 25
3.1 Introduction 25
3.2 Study area 25
3.2.1 Using a sub-catchment as the study unit 29
3.2.2 Structuring the digital elevation model of the study area 30
3.2.3 Delineating the sub-catchment 34
3.3 Selection of input factors 35
3.4 Data acquisition and pre-processing 36
3.5 Site suitability evaluation 41
4 SITE SUITABILITY ANALYSIS 43
4.2 Selecting Sites Suitable for Animal Waste Application 43
4.2.1 Vector-based site suitability analysis 44
4.2.2 Raster-based site suitability analysis 44
4.2.3 Objectives 46
4.3 Materials and methods 47
4.3.1 Comparison of vector- and raster-based analyses 47
4.3.2 Field validation of suitability measurements 50
4.3.3 Sensitivity analysis 51
4.3.4 Weighting of input factors 56
4.4 Results 58
4.4.1 Comparison of vector- and raster-based analyses 58
4.4.2 Field validation of sites identified using the raster-based WLC
method 61
4.4.3 Sensitivity analyses 62
4.4.4 Evaluation of the OOC method 65
4.5 Discussion 66
4.5.1 Comparison of vector and raster methods of site suitability
analysis 66
4.5.2 Sensitivity analysis (degree of site suitability) 70
4.5.3 Objective oriented method of factor weighting 73
4.6 Conclusion 74
5 ASSESSING THE DEGREE OF SITE SUITABILITY 76
5.1 Introduction 76
5.2 Degree of site suitability for animal waste application 76
5.2.1 Standardisation of input factors 77
5.2.2 Ambiguities about standardisation 78
5.2.3 Effect of standardisation on degree of site suitability 79
5.2.4 Objectives 82
5.3 Materials and Methods 83
5.3.2 Standardisation using continuous rescaling 95
5.3.3 Comparing the classification and rescaling methods of
standardisation 96
5.4 Results 98
5.4.1 Effect of factor attribute classification 98
5.4.2 Effect of factor attribute rescaling 101
5.4.3 Comparison between the methods of standardisation 102
5.5 Discussion 106
5.5.1 Standardisation of factors using the classification method 106
5.5.2 Standardisation of factors using rescaling method 112
5.5.3 Factor attribute classification versus rescaling 114
5.6 Conclusion 115
6 DEVELOPING A MANURE APPLICATION PLAN 117
6.1 Introduction 117
6.2 Site-specific application of animal waste as fertiliser 117
6.2.1 Input variables 118
6.2.2 Critical plant nutrient 118
6.2.3 Non-agricultural aspects of animal waste reuse 119
6.2.4 Objective 120
6.3 Materials and methods 120
6.3.1 Data collection and pre-processing 120
6.3.2 Factor standardisation and weighting 120
6.3.3 Site suitability determination 121
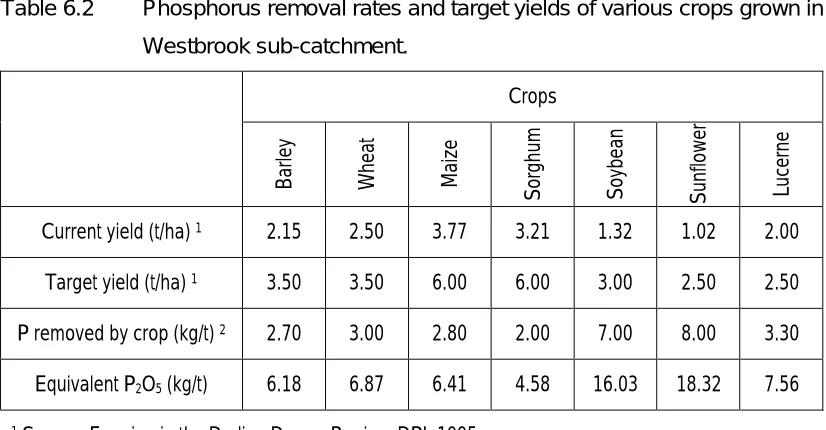
6.3.4 Determining the crop nutrient requirements 123
6.3.5 Manure allocation and nutrient content 126
6.3.6 Determining the manure application rate 127
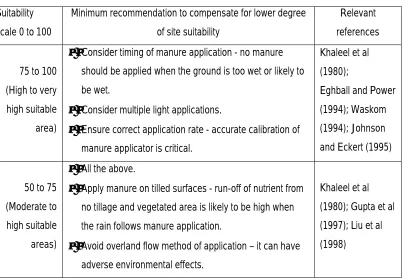
6.3.7 Alternate manure management strategies 128
6.4 Results 129
6.4.1 Site suitability 129
6.4.3 Manure allocation and manure nutrient (P2O5) contents 134
6.4.4 Manure application plan 136
6.4.5 Nitrogen application from manure sources 138
6.4.6 Maximum manure application rates 138
6.5 Discussion 141
6.5.1 Suitability measurements 141
6.5.2 Crop nutrient requirements 142
6.5.3 Manure allocation map 143
6.5.4 Manure application plan 144
6.5.5 Adoption of the manure application plan 147
6.6 Conclusions 151
7 GENERAL DISCUSSION 153
8 CONCLUSION 157
9 REFERENCES 162
10 APPENDICES 170
10.1 Appendix A. Datasets used in catchment delineation 170
10.2 Appendix B. Input factors 174
10.3 Appendix C. Classification of input factors 186
LIST OF FIGURES
Figure 2.1 Binary overlay: intersection and union operations 17
Figure 3.1 Location of the study area: Westbrook sub-catchment in south east
Queensland, Australia 26
Figure 3.2 Photographs: (a) the general landscape of the study area, (b) the
Westbrook Creek embankment, and (c) typical cultivated area 28
Figure 3.3 A process used to structure the digital elevation model and
delineate the sub-catchment 32
Figure 3.4 Hillshade view of the study area and the vicinities with overlaid
stream network 33
Figure 3.5 Delineated sub-catchment depicting the digital elevation model 34
Figure 3.6 Data pre-processing operations 39
Figure 3.7 The weighted linear combination of three factors producing an
output map with various degree of site suitability (following the
Figure 5.11 of Chrisman, 1997, p132). 42
Figure 4.1 Site suitability analysis using a vector-based binary intersection
operation 49
Figure 4.2 Processing of factors to use as input in WLC model 50
Figure 4.3 Sites suitable for animal waste application (Vector method) 59
Figure 4.4 Sites suitable for animal waste application (Raster method) 59
Figure 4.5 Effect of the number of input factors on suitable areas identified
using a raster-based method 61
Figure 4.6 Sites suitable for animal waste application in the Westbrook
Figure 5.1 Schematic representation of the effect of classification on cell
values 81
Figure 5.2 The process of factor attribute standardisation using both discrete
classification and continuous rescaling methods 84
Figure 5.3 Classification of factor attributes into different numbers of classes 88
Figure 5.4 Examples of input factors with attribute classified into class of
different sizes 90
Figure 5.5 Weighted average as a function of the method of standardisation 103
Figure 5.6 Effect of the number of classes on the degree of site suitability 107
Figure 5.7 Linear combination of input factors with varying class weights 107
Figure 5.8 Adjustment of weight to compensate the division of weight due to
factor attribute classification (modification of Figure 5.6) 110
Figure 5.9 Effect of class sizes on the dispersion and skewing of the cell
values 112
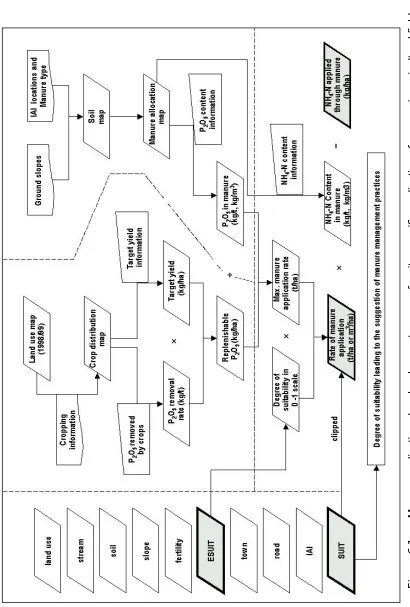
Figure 6.1 Manure application plan development process for site-specific
application of manure in agricultural fields 124
Figure 6.2 Overall suitability of sites for animal waste application 130
Figure 6.3 Crop distribution and nutrient (P2O5) requirement to achieve target
yield in the sub-catchment 133
Figure 6.4 Application area of the various manure types in the Westbrook
sub-catchment (Total application area = 21.4 % of the sub-sub-catchment) 134
Figure 6.5 Proposed allocation of manure and manure nutrient (P2O5) content
in the Westbrook sub-catchment 135
Figure 6.6 Suggested manure application plan for Westbrook sub-catchment 137
Figure 6.8 Ammonium nitrogen potentially applied if the manure application
LIST OF TABLES
Table 2.1 Commonly available software programs for the calculation of
manure application rates 14
Table 3.1 Selection of input factors for the site-specific manure management 35
Table 3.2 Data acquisition: sources, formats, scale, and uses 37
Table 3.3 Exclusionary criteria applied to input factors selected for site
suitability determination for animal waste application in
agricultural fields 40
Table 4.1 Input factors and potentially suitable area for each input factor 48
Table 4.2 Questionnaire for field assessment of site suitability 51
Table 4.3 Classification and weighting of factor attributes for raster-based
site suitability analysis 53
Table 4.4 Example of the pair-wise comparison matrix for class weight
determination associated with the “proximity to stream” factor 54
Table 4.5 Objective oriented comparison (OOC) method of weighting input
factors 58
Table 4.6 Site suitability measurements as affected by the number of input
factors in vector and raster methods 60
Table 4.7 Error matrix and Kappa index of agreement 61
Table 4.8 Summary of the WLC method based site suitability analysis 62
Table 4.9 Effect of the number of input factors in the areal extent and the
degree of site suitability for animal waste application 64
Table 4.10 Effect of factor weights on degree of site suitability for animal
Table 4.11 Weighting of input factors using AHP based WEIGHT module 66
Table 5.1 Classification of attributes and weighting 86
Table 5.2 Factor attribute classification using equal area method 87
Table 5.3 Area under each class as determined by different methods 89
Table 5.4 Weight distribution between classes using the equal increment
method 92
Table 5.5 Uneven weight distribution between classes based on the AHP
method 92
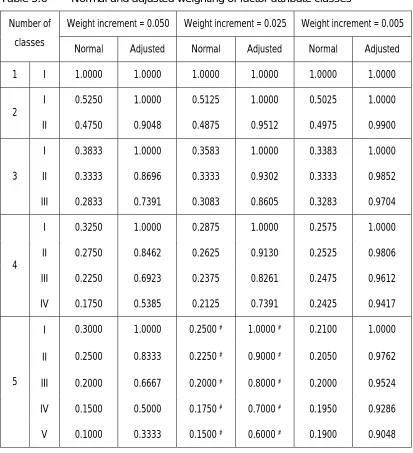
Table 5.6 Normal and adjusted weighting of factor attribute classes 94
Table 5.7 Details of the factor attribute classification of selected input factors 96
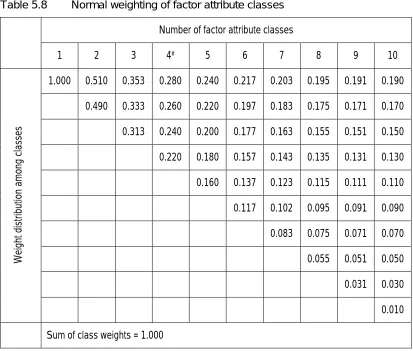
Table 5.8 Normal weighting of factor attribute classes 97
Table 5.9 Effect of the number of factor attribute classes on the degree of site
suitability measurements. 98
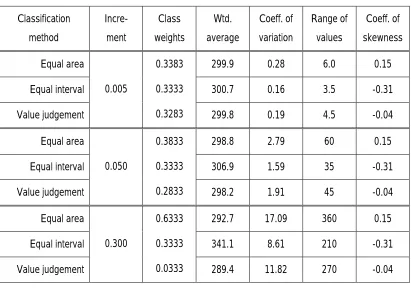
Table 5.10 Effect of class size and weights on the degree of site suitability 99
Table 5.11 Effect of uneven weight distribution on the degree of site
suitability 100
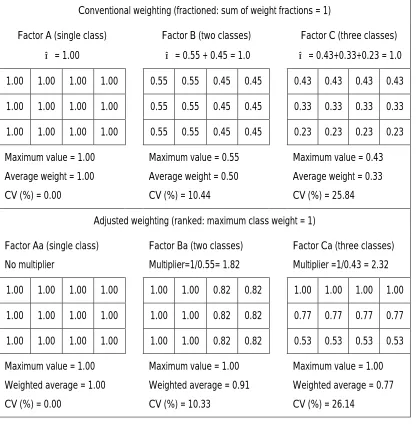
Table 5.12 Effects of weight adjustment on the degree of site suitability 101
Table 5.13 Degree of site suitability measurement obtained using rescaling
method of standardisation 102
Table 5.14 Effect of factor attribute classification (weighting and number of
classes) and rescaling on the degree of suitability 104
Table 5.15 Effect of the number of input factors on the degree of site
suitability 105
Table 6.1 Objective oriented comparison based weighting of input factors 122
Table 6.2 Phosphorus removal rates and target yields of various crops grown
Table 6.3 Nutrients contained in various types of solid and liquid animal
waste (source: OSU, 1992) 127
Table 6.4 Value attributes of environmental suitability map (expressed as a
fraction). 131
Table 6.5 Cropping area and crop nutrient (P2O5) requirements to achieve
target yields of various crops grown in the Westbrook
sub-catchment 132
Table 6.6 Maximum application rates of various manure types 140
Table 6.7 Areas under different degree of site suitability categories 140
CHAPTER 1
1
GENERAL INTRODUCTION
1.1 Problem statement
The disposal of animal waste has become a problem due to the development of
intensive animal industries (IAI) in many parts of the world including Australia.
Intensive animal industries have been developed for economic gain through
centralised management of the animal production system. However, this has led to
the challenging task of safely disposing of the waste generated at the animal
production facilities (Alocilja, 1998). Safe waste disposal sites are rarely available
and the removal of waste to such sites is often not economical. Similarly, the
treatment of animal waste is seldom economically viable and the chemical,
biological, and engineering methods of animal waste reuse (eg composting, energy
recovery and re-feeding) are not popular.
Despite many possible uses of animal waste, its application as fertiliser to
agricultural fields remains the most widely accepted and viable disposal option (He
and Shi, 1998). However, due to the availability of animal waste in large quantities at
concentrated animal production facilities, it has often been applied in excess to the
surrounding agricultural fields. Excessive application of waste, without proper
consideration of the actual requirements, has led to the run-off and/or leaching losses
of nutrients (eg nitrogen and phosphorus) from the soil causing agricultural non-point
major cause of the nitrification of ground water systems and eutrophication of
surface water systems (Khaleel et al, 1980). Eutrophication of surface water systems
has resulted in toxic blue green algae blooms in many waterways including the
Murray-Darling River system in Australia (Young et al, 1994). Excessive and
frequent use of animal waste to agricultural fields, next to animal production
facilities, have also released unpleasant odours to the surrounding community and
provided a breeding ground for harmful insects and pests. Thus, the excessive
application of animal waste to agricultural fields, in close proximity to the intensive
animal industries, has been a serious concern. The distribution of animal waste to
other agricultural areas is therefore considered necessary.
Agricultural fields that are likely to receive animal waste as fertiliser vary widely in
their suitability due to agronomic, environmental, social, and economic limitations.
Obviously, some fields may not be suitable for animal waste application due to the
site-specific limitations, while others may vary in their level of suitability due to their
biophysical and/or socio-economic characteristics. In effect, not all agricultural fields
can be treated equally for animal waste application. Therefore, the most important
task to be performed, before applying animal waste as fertiliser to the agricultural
fields, is to evaluate the suitability of the fields and develop a plan for the
site-specific application of manure. However, such a plan cannot be developed without
considering the full range of agricultural, environmental, social, and economic
limitations.
A number of manure management procedures and computer-based programs (eg
in recent years to determine the optimum animal waste application rates in the
agricultural fields. Most of these programs (procedures) calculate “typical” manure
application rates to meet crop nutrient requirements at the point scale. Some
programs attempt to optimise the manure application rates by taking social,
economical, and/or environmental factors into account. However, none of them are
designed to address the spatial characteristics of the fields to develop a site-specific
manure application plan. For instance, the exclusion of sensitive areas requires the
inclusion of spatial uniqueness, which is beyond the scope of such programs (or
procedures). Obviously, these programs (or procedures) are not meant to differentiate
fields (or parts of a field) in terms of their level of suitability and therefore they offer
no manure management alternatives to counteract various degree of suitability
between (or within) the fields. These programs are also limited in capacity in terms
of planning manure application in a catchment-wide scale. However, catchment-wide
manure application is fundamental because the adverse effects of manure misuse are
not limited to the manure application sites.
Due to the spatial nature of the problem and the involvement of many parameters, the
development of a comprehensive catchment-wide manure application plan is not a
straightforward task. It involves understanding the effects of various factors on the
areal extent and the degree of suitability. It also requires incorporating and
processing a large volume of spatial and non-spatial information including crop
nutrient requirements and manure nutrient contents. Problems of this nature are best
attempted using a geographic information system (GIS), which is capable of
In recent years, limited attempts have been made to identify suitable sites for animal
waste application using GIS. For example, Jain et al (1995) and He and Shi (1998)
identified suitable manure application sites using GIS but they did not take the
degree of suitability of the application sites into account. Similarly, Hendrix and
Buckley (1992) demonstrated a method for selecting sites for land application of
sewage sludge. However, there are not any studies focusing on the site-specific
application of animal or other waste as fertiliser in agricultural fields within a
catchment. Thus, catchment-wide manure application planning represents an area
with a serious gap in the knowledge required for the site-specific application of
animal waste as fertiliser in agricultural fields.
1.2 Aim
The excessive use of animal waste as fertiliser in some agricultural fields have
already contributed to a range of effects including eutrophication and toxic
blue-green algae blooms in surface water systems, nitrification of ground water systems,
and odour pollution. Currently available methods of determining the best field
application rates of animal waste are deficient in terms of making site-specific
judgements and planning the manure application on a catchment-wide scale. The
excessive application of animal waste to agricultural fields with little or no
consideration of site-specific limitations should no longer be tolerated. Therefore,
manure application planning for the site-specific application of this recyclable waste
has become a task requiring urgent attention. Hence, the overall aim of this study is
to establish a framework for the development of a comprehensive catchment-wide
in agricultural fields.
1.3 Research approach
The approach adopted in developing a comprehensive catchment-wide manure
application plan for the site-specific application of manure to agricultural fields
involved reviewing the current state of knowledge in the literature, identifying areas
requiring attention, and formulating the specific research objectives (Chapter two).
The general research methods to achieve the individual objectives, including the
delineation of the study area and the structuring of the digital elevation model for the
study area are outlined in Chapter three.
The identification of sites suitable for animal waste application was achieved using a
geographic information system based site suitability analysis technique (Chapter
four). The degree of suitability of the sites was also investigated along with the
effects of the various input parameters in the degree of site suitability measurements
(Chapter five).
The development of a manure application plan for the study area required
aggregation of the diversified information. Spatial and non-spatial information was
combined using a geographic information system to develop a comprehensive,
catchment-wide, manure application plan for the site-specific use of animal waste as
fertiliser in agricultural fields (Chapter six). The general discussion and the
CHAPTER 2
2
REVIEW OF LITERATURE
2.1 Introduction
The development of intensive animal industries has created a relatively new problem
of animal waste disposal (Chapter 1). While the use of animal waste as fertiliser is
the traditional, conventional, and acceptable utilisation/disposal option, there is an
increasing requirement for the broader consideration of the agricultural,
environmental, social, and economical implications of this form of utilisation.
The current issues associated with animal waste utilisation and management are
examined in this chapter. Literature related to the disposal of animal waste and the
environment including agricultural non-point source pollution is reviewed (Section
2.2), along with the benefit of using animal waste as fertiliser in agricultural fields
(Section 2.3). An overview of the current status of the use of geographic information
system tools for spatial management of animal waste is then presented (Section 2.4)
prior to outlining the specific project objectives (Section 2.5).
2.2 Animal waste and the environment
Animal production is developing towards fewer but larger production units that
feature centralised control of the technology and the production process (Hoban et al,
1997), increased production efficiency (Davis et al, 1997) and decreased production
world including south-east Queensland, where the number and size of intensive
animal industries (ie dairy, feedlot, piggery and poultry farms) has been growing
rapidly in recent years (AgWise, 1999). The development of large intensive animal
production units is associated with the generation and accumulation of large volumes
of animal waste (Younos, 1990) that have brought about the new challenges in
manure handling (Hoban et al, 1997), utilisation (Alocilja, 1998), and disposal
(Younos, 1990). As a consequence, the management of animal waste has become a
serious environmental concern (Garnier et al, 1998) and hotly contested topic
(Hatfield, 1997; Hoban et al, 1997) in determining the socio-economic and
environmental sustainability of intensive animal production systems (Vellidis et al,
1996).
The primary environmental concerns related to intensive animal production facilities
are due to odour and nutrient pollution (Safley, 1994). Air can be polluted by the
release of odours (gases) during the manure decomposition process and/or the land
application of manure (Sutton, 1994). Much of the odour is caused by the
volatilisation of ammonia and other harmful gases from the animal waste (Eghball
and Power, 1994). Besides unpleasant odours, the ammonia is also poisonous and
can cause incidences of Newcastle disease in poultry (Moore et al, 1995). Air
pollution can also occur due to the dusty environment that can be created around the
intensive animal production facilities (Eghball and Power, 1994). The decomposing
wastes also provide a breeding ground for hazardous insects and pests (El-Ahraf and
Willis, 1996, p20).
nutrients contained in the manure have the potential to pollute soil and water bodies.
Soils can be polluted due to the build up of nutrients as a result of extremely high
manure application rates (or dumping) in fields (Eghball and Power, 1994; Sutton,
1994). Such polluted soils are hostile to plant growth due to nutrient imbalances
(Eghball and Power, 1994) and are more inclined to release nutrients in the run-off
(Khaleel et al, 1980). The nutrients lost in the run-off contribute to eutrophication of
water bodies. While the eutrophication of water systems (ie enrichment with
nutrients) can be caused from a variety of sources (eg discharges from municipal
waste treatment plants, manufacturing discharges, urban run-off, golf courses,
residential lawns, and agriculture), agriculture has been identified as a common
leading source of nutrient pollution (Nowlin, 1994; Sutton, 1994).
Water pollution from agricultural sources is due to leaching, leaking, and direct
run-off of nutrients from the fertilised fields and/or intensive animal production facilities
(Sutton, 1994). The contamination of water bodies due to the accumulation of
nutrients lost from agricultural land and animal production facilities is commonly
referred to as agricultural non-point source (NPS) pollution, since these pollutants do
not enter the water bodies from a fixed point (Giupponi et al, 1999). The concerns
about NPS pollution are due to increased concentrations of nutrients (eg nitrogen,
phosphorus), oxygen demanding compounds (eg carbon), and pathogens in the
run-off water (Khaleel, et al, 1980) that are potentially harmful when they reach the
ground and surface water systems. For example, high nitrate concentrations in
ground water systems may lead to health and environmental quality problems (Stone
may result in eutrophication (Beegle and Lanyon, 1994). Nutrients from agricultural
non-point sources are often the main cause of eutrophication of surface water
systems (Daniel et al, 1994). The eutrophication may lead to the growth of
undesirable plants such as toxic blue green algae that can exhaust oxygen supplies in
water and result in fish kills and the loss of desirable aquatic vegetation (Stone et al,
1998a). Blue green algae are bacteria (Cyanobacteria) that create unpleasant odours
and lower drinking water quality. Their toxins may also cause sickness in humans
and death in livestock and pets (Kuhn, 1993; Herath, 1997; Steffensen et al, 1997).
Blue green algae blooms are primarily caused by the availability of excess nitrogen
and phosphorus nutrients in water (Herath, 1997), with phosphorus being the limiting
nutrient (Kuhn, 1993).
In Australia, nutrients from animal waste sources have been identified as the major
cause of eutrophication and toxic blue green algae blooms in the Murray-Darling
River system (Young et al, 1994) where the worlds’ largest algal bloom was
recorded in 1991 (Kuhn, 1993; Young et al, 1996; Herath, 1997). The feedlots and
piggeries, located along the Murray River, are estimated to deliver 1650 and 2530
tonnes of phosphorus respectively per year (Young et al, 1994). The frequency and
severity of toxic blue green algae blooms is also on the rise due to reduced river
flows and eutrophication (Young et al, 1996). The economic impact of
eutrophication and toxic blue green algae blooms is severe. The large algal bloom of
1991 resulted in an estimated loss of $ 10 million due to lost recreation alone
2.3 Utilisation of animal waste
Animal waste can be utilised in a number of ways. Energy could be recovered from
the animal waste by burning it and/or producing methane gases (Eghball and Power,
1994). Animal waste may be used for land filling and/or reclaiming mined soils
(Eghball and Power, 1994). Other uses of animal waste include re-feeding it to other
animals such as the use of poultry manure to raise fish (Moore et al, 1995) in areas
where pelleted fish diets are limited and expensive (Anuta, 1995). However, very
little manure is used for the above purposes (Eghball and Power, 1994).
Despite advances in animal waste treatment research, there is a significant lag in
on-farm animal waste treatment techniques (Yunos, 1990). Both aerobic and anaerobic
treatment processes are very effective for biodegradation but not for nutrient removal
(Yunos, 1990). Advanced nutrient removal systems are expensive. Thus, the
treatment of animal waste represents a considerable environmental and economical
problem (Garnier et al, 1998). Despite the availability of chemical, biological, and
engineering methods of waste re-use and treatment (Younos, 1990), the use of
animal waste as manure to the cropland remains the most common and often least
expensive method of animal waste utilisation (He and Shi, 1998). Therefore, the land
is usually the ultimate site for using (or disposing) most of the waste generated at
confined animal production facilities (Patni and Culley, 1989; Moore et al, 1995).
The animal waste contains nitrogen, phosphorus, potassium, micronutrients, and
organic matter. Fortunately, these nutrients are essential for plant growth and the
organic matter contained in the manure can help improve soil physical properties
micronutrients that are essential for plant growth (Younos, 1990). Application of
animal waste and lagoon effluent as fertiliser to agricultural fields is the conventional
method of animal waste management (Gupta et al, 1997; Liu et al, 1998). Benefits
include improved soil physical properties (eg infiltration, aggregation, and bulk
density), reduced run-off and wind and water erosion, decreased energy requirement
for tillage, and reduced impedance to seedling emergence and root penetration
(Eghball and Power, 1994). Therefore, the use of animal waste as fertiliser is a
method of disposal that may reduce the potential for environmental problems
(Alocilja, 1998), increase agricultural production through nutrient recycling (Vellidis
et al, 1996; Liu et al, 1998), and regenerate the soil for better crop growth (Younos,
1990). Hence, animal waste is an excellent source of plant nutrients and organic
matter when added to soils, but if poorly administered can pollute the run-off
(Eghball and Gilley, 1999).
The run-off from land treated with animal waste may contain carbon, nitrogen and
phosphorus, each of which can promote undesirable environmental impacts (Daniel
et al, 1994). These nutrients may increase substantially in the run-off water if the
manure is applied in excess of crop nutrient requirement and/or beyond the
assimilative capacity of the land (Couillard and Li, 1993; Vellidis et al, 1996; Stone
et al, 1998a). The run-off of nutrients due to excessive application may lead to a
significant increase in the surface water contamination (Eghball and Power, 1994)
and subsequent eutrophication and toxic blue green algae blooms (Couillard and Li,
1993). Excessive application of animal waste may also lead to nitrate leaching into
bacterial or viral pathogens levels in lakes and rivers (Moore et al, 1995).
The land application of manure usually occurs within a few kilometres from where it
is produced (Moore et al, 1995). Obviously, transporting the manure to a greater
distance from the source of production would increase the potential area for land
application (Moore et al, 1995) and thereby reduce the environmental risks (Long
and Fleming, 1999). However, the fields adjacent to the animal production facilities
receive the manure first due to the close proximity and low transportation cost (He
and Shi, 1998). This happens despite the fact that the economically viable manure
hauling distance could be up to 20 kilometres from the production site (Eghball and
Power, 1994; Moore et al, 1995). In some cases, animal producers may lack
agricultural lands for manure application at a greater distance from the animal
production facility (Sutton, 1994). In south-east Queensland, the preference of
manure application to the fields close to the animal production facility has been due
to the convenience, cost effectiveness, and non-ownership of land at a greater
distance (Schuster, Personal communication). Consequently, there has been an
increasing trend in the application of animal waste at levels far in excess of
agronomic fertilisation rates to the agricultural fields surrounding the local intensive
animal production facilities (AgWise, 1999).
Application of manure at rates that supply available plant nutrients at recommended
agronomic rates is desirable to maximise the use of nutrients, minimise the nutrient
build up in the soil (Liu et al, 1998), and avoid the run-off and leaching losses of
nutrients to watercourses (Eghball and Power, 1994). Evidences suggest that the
surface water (Caldwell, 1998). In recent decades, significant progress has been
made in developing tools to assist producers identify appropriate animal manure
and/or lagoon effluent application rates. Methods of calculating sustainable
agronomic rates by taking into account the nutrient value of the manure (determined
by factors such as application time, method, and weather condition) and plant
nutrient requirement (affected by current fertility status and crop type) have been
developed (eg Joern and Brichford, 1993). A number of computer-based manure
management programs have also been developed to determine appropriate agronomic
application rates (Table 2.1). Many of the manure management programs (eg
MAP3.0, MARC98, and MCLONE4) commonly include environmental and
economic modules, which take nutrient type (eg nitrogen or phosphorus) and nutrient
value into account when determining the final recommended application rates.
These programs calculate “typical” manure application rates to meet the crop nutrient
requirements at a point scale and hence, do not take the spatial characteristics of the
location into account. They are not designed to: (a) differentiate fields (or parts of a
field) according to their level of suitability, (b) plan manure application at a
catchment-wide scale, or (c) fully incorporate the spatial variability associated with
the socio-economic and environmental limitations of manure application planning.
However, the development of a comprehensive animal waste application plan
requires the consideration of site-specific variables such as soil properties,
topography (He and Shi, 1998), land use, field location, social limitations (Hendrix
and Buckley, 1992), nutrient run-off and leaching potential (Johnson and Eckert,
management programs have a limited capacity to incorporate such site-specific
(spatial) variables in determining catchment-wide site-specific manure application
rates. Therefore, these programs are merely manure application rate calculators
rather than a planner.
Table 2.1 Commonly available software programs for the calculation of manure application rates
Description Developer Source Scope of the software
Manure Application Planner (MAP) University of Minnesota, USA Schmitt et al, (1997)
Manure application planner that meets the environmental standard and achieves economic feasibility. Manure Application Rate Calculator (MARC98) Manitoba Agriculture, Canada Tessier (1999)
Calculates manure application rate by considering nutrient value of manure and crop nutrient needs.
Manure, Cost, Labour, Odour, Nutrients, and Environment (MCLONE3) University of Guelph, Canada Ma and Ogilvie (1998)
Calculates environmental risks and makes manure recommendations by considering cost, labour, odour and nutrient, and environment.
Animal Manure as a plant Nutrient Resource (AMANURE) Purdue University, USA Sutton et al, (1999)
Estimates the nutrient value of manure and recommends a manure application rate that matches crop requirements.
Manure Nutrient Inventory Spreadsheet University of Nebraska, USA Koelsch (1999)
Estimates the land area required for agronomic utilisation of manure nutrients.
The development of a comprehensive catchment-wide animal waste application plan
for the site-specific application of animal waste as fertiliser to agricultural fields
requires processing of non-spatial (eg crop nutrient requirements, crop yield, and
distribution) parameters. The requirement to simultaneously process spatial and
non-spatial parameters suggests that an alternative tool such as a geographic information
system (GIS) may provide a sensible platform for the development of a
comprehensive site-specific manure application plan at a catchment scale.
2.4 GIS as a tool for manure management
A GIS is a system of hardware, software, data, people, organisations, and
institutional arrangements (Chrisman, 1997, p5) that is designed to accept large
volumes of spatial data derived from a variety of sources and to store, retrieve,
manipulate, analyse, and display these data according to user’s requirements
(Burrough and McDonnell, 1998, p11). In many ways, a GIS is similar to traditional
data display and output systems such as computer-aided design (CAD). However, the
analytical capability of the GIS makes it a very powerful tool as compared to other
related systems (DeMers, 2000, p11). A number of different types of GIS software
have been developed for spatial data management and modelling, the choice of
which depends on the experience of the user and the nature of the application (Jain et
al, 1995). Some of the more common GIS software systems are ARC/INFO (ESRI,
1992), GRASS (Byars et al, 1995), ArcView (ESRI, 1996), MapInfo (MapInfo Corp,
1994), IDRISI (Eastman, 1997), and TNT (MicroImages, Inc, 2001). ARC/INFO
(ESRI, 1992) typically operates within the UNIX or Windows NT environments and
is currently one of the most popular high-end GIS software programs available.
2.4.1 GIS and spatial analysis
Geographic information systems are currently used to assemble and manage large
visual representations of model results (Steyaert and Goodchild, 1994, p333). The
spatial modelling within GIS involves simplified representations of reality (eg map
layers) and the subsequent use of GIS techniques (ie methods) for the purpose of
analysis, understanding, and/or prediction (Apan and McDougall, 2000). Spatial
modelling is the process of looking at data characteristics through a number of data
(ie map) layers for each location to solve a specific problem (ESRI, 1996, p26).
Spatial analysis and modelling is useful for site suitability evaluation, for estimating
and predicting, and for interpreting and understanding the location and distribution of
geographic features and phenomenon (ESRI, 1996a, p2).
The site suitability evaluation typically requires the integration of many different
data sources, which is ideally performed using map overlay techniques (Davis, 1996,
p223). The digital map overlay procedures depend on the absolute location of each
feature, which can be expressed in either a vector or raster format. The differences
between raster and vector systems are based on the way in which the earth’s surface
is perceived, represented, and stored (Nichols, 1998). In raster-based systems, the
surface is divided into uniform cells (pixels) of desired size and each cell is assigned
a value that is characteristic to that location. In vector-based systems, the data (ie
point, lines, and polygons) are identified as discrete x and y coordinate pairs
(Burrough and McDonnell, 1998, p40).
The vector GIS based Boolean overlay is a conventional site suitability analysis
technique that combines Boolean constraints (ie input factors with their attributes
classified as suitable or unsuitable) using binary intersection (ie logical AND) or
binary intersection operation identifies entries (ie areas) that are common to both
layers while the binary union operation combines the entries (ie areas) that appear in
one or the other input factors ignoring any overlap effect (Figure 2.1). Boolean
overlay is typically used for crisp spatial mapping in which areas are designated by a
simple binary number as either belonging or not belonging to the designated set
(Eastman, 2000).
Figure 2.1 Binary overlay: intersection and union operations
The weighted linear combination (WLC) is a commonly used raster GIS based
method of site suitability analysis (Eastman, 1997, p9-5). In this method, the input
factors are weighted and standardised prior to combining them linearly to produce a
site suitability map (Church, 2000). Weighting of input factors (ie criteria) is often
necessary because the factors are likely to contribute differently (ie unequally) in
determining the suitable sites (Chrisman, 1997, p131). For example, in selecting sites
for sewage sludge applications the slope factor could have much greater impact (ie
weight) than the soil factor in terms of retaining the applied sludge in the fields.
Standardisation of input factors is essential to make the factors commensurate for
linear combination (Eastman, 1997, p9-10). For example, the input factors chosen for
streams cannot be combined linearly without previously converting them to a
common numeric range (ie standardising). These factors may be standardised by
classifying their attributes. Classification involves replacing the continuous factor
attributes with discrete classes (eg class I, II, and III) and weighting or ranking the
classes appropriately (Burrough et al, 1992). Alternatively, factor attributes may be
standardised by re-scaling the attributes into a continuous scale of zero to one, 0 to
100, or 0 to 255 (Eastman, 1997, p9-10). Both standardisation methods have been
conventionally used in site suitability determination.
The suitability maps generated using Boolean overlay and WLC methods frequently
lead to considerably different results (Eastman, 1997, p9-5) due to the difference in
aggregation logic (Jiang and Eastman, 2000). Eastman (2000) demonstrated that the
total area selected as suitable using the WLC method lies in between the intersection
(AND-ness) and union (OR-ness) operation of the Boolean overlay. The suitable
areas, selected using these two methods, also differ significantly in their composition
(ie structure or makeup). For example, the Boolean overlay method produces output
maps with areas designated as either suitable (ie true) or unsuitable (ie false)
(Eastman, 2000). While, the output of the WLC model is a composite map with each
grid cell assigned a suitability value (Banai-Kashani, 1989; Eastman, 1997, p 9-13;
Chrisman, 1997, p131; Jiang and Eastman, 2000), which could be arranged into
various degrees of suitability for site-specific decision-making.
2.4.2 Location modelling for waste application
Location modelling (ie search for a suitable sites) involves the process of finding the
such as the application of animal waste and/or sewage sludge as fertiliser to the
fields. Site selection for waste utilisation/disposal is a difficult, costly, and
time-consuming but crucial task (Hendrix and Buckley, 1992). In some circumstances,
suitable sites may be determined based on a single factor (ie criterion). For example,
animal waste application sites could be found by selecting agricultural land from a
land use map. However, in most circumstances, many more factors have influence in
site suitability determination. A careful selection of all the relevant factors is critical
(DeMers, 2000, p371) since failing to do so may result in misjudging the suitability
of a field completely. Often, a single factor can affect the site suitability
dramatically. For instance, a field suitable for animal waste application due to its
favourable soil type, slope, land use, and proximity to watercourses could be totally
unsuitable due to its adjacency to residential areas.
Due to the involvement of many input factors in the site selection process, such
analyses are often referred to as multi-criteria evaluations (Eastman, 2000).
Multi-criteria evaluation techniques, together with geographic information systems, form a
powerful tool in the process of land suitability assessment (Bierman, 1999, p202).
Multi-criteria based site suitability assessments are commonly performed using both
vector- and raster-based methods (Eastmann, 2000). In the past, it has been used to:
(a) identify animal waste (eg Jain et al, 1995; He and Shi, 1998) and sewage sludge
(Hendrix and Buckley, 1992; Towers and Horne, 1997) application sites; (b) locate
waste disposal sites (eg Siddiqui et al, 1996; Basagaoglu et al, 1997); and (c) detect
sites with high non-point source pollution potential (eg Heatwole and Shanholtz,
management and none of them has the site selection for manure application as the
primary objective. Consequently, there are issues such as the factor sensitivity and
the relative merits of vector and raster methods in determining suitable sites for
animal waste application that have not yet been addressed in the literature.
2.4.3 Degree of site suitability for site-specific decision making
The degree of site suitability measurements, using the WLC model, is of particular
interest because the discrete suitable or unsuitable (ie true or false) outcome
presented by the Boolean overlay method of suitability analysis limits the way we
think about the world (Burrough, 1996, p15). It is necessary to be able to deal with
concepts that are not just true or false (ie suitable or unsuitable) but that operate in
between (Burrough, 1996, p15). After all, the site suitability is not commonly
Boolean in character, but expresses varying degrees of set membership (ie fuzziness)
(Jiang and Eastman, 2000). The crisp spatial mapping procedure of the Boolean
overlay method (Eastman, 2000) ignores the important aspects of fuzziness (ie
inexactness) and divides the undividable continua to produce significantly different
results for the same area (Burrough, 1996, p16). However, the multi-criteria based
WLC model is capable of inputting standardised continuous data to produce a
continuous map with various degrees of site suitability (Jiang and Eastmann, 2000),
which could be of great value in making site-specific decisions. For example, in the
case of manure application planning, the degree of site suitability measurements
could provide the basis for the site-specific application of animal waste as fertiliser to
suitable agricultural fields. However, the use of the degree of site suitability
the reproducibility of such measurements.
The reproducibility of the degree of site suitability measurements is critical because
they have to be reliable, verifiable, and defendable before they can be successfully
used for site-specific decision-making. However, this is an area that has received
very little attention in the past despite the fact that the site suitability scoring
technique was first introduced in early seventies (Hopkins, 1977) and used for power
plant siting in Maryland a few years later (Dobson, 1979). Since then, the
measurements of the degree of site suitability have been reported occasionally but
very little has been done to evaluate the sensitivity of such measurements. For
example, Hendrix and Buckley (1992) used degree of site suitability measurements
to classify sewage waste application sites to various levels of suitability but they did
not assess the reliability of the degree of site suitability measurements. Jain et al
(1995) determined the degree of site suitability by rescaling the measured cumulative
suitability scores between 0 and 100 to locate livestock production facility. They
however, did not examine the reproducibility of the degree of site suitability
measurements. Jiang and Eastman (2000) pointed out the usefulness of the multiple
criteria based weighted linear combination method in assessing the various degrees
of suitability for locations under consideration. However, they neither outlined the
measurement procedure nor discussed its reliability. Hence, there is a significant gap
in terms of assessing the reliability and reproducibility of the degree of site suitability
measurements in the literature. The effect of the number of input factors, weighting
of factors, and the method of factor attribute standardisation on the degree of site
2.4.4 Application of GIS for site-specific manure management
The availability of the multi-criteria based WLC method of site suitability analysis
suggests that it should be possible to identify manure application rates according to
site-specific requirements. In recent years, some attempts have been made to identify
suitable sites and develop decision support systems for environmental management
of animal waste as fertiliser in agricultural fields. For instance, Jain et al (1995) used
a multi-criteria based spatial modelling technique to determine suitable land areas for
the planning of livestock production systems and for selecting suitable land areas for
manure application. They used a weighted linear combination model to generate the
site suitability map and ranked the suitable sites into various degrees of suitability.
However, they did not explore the possibility of using the degree of site suitability
measurements for the site-specific application of animal waste as fertiliser in
agricultural fields. In any case, they were using 100 m × 100 m (1 ha) cell resolution
and the recommendation of manure application rates at a field level would not have
been accurate enough. In the process of examining the distribution of manure in
Michigan State, He and Shi (1998) identified potentially suitable land for animal
waste application and proposed a transportation model for the transport of excess
manure. They identified suitable parcels of cropland for manure application based on
limited input parameters and disregarded the potential variations between the
selected land parcels. They used broadly recommended manure application rates in
their transportation model and did not consider the determination of site-specific
manure application rates. Heatwole and Shanholz (1991) developed an animal waste
pollution index based on the general geographic characteristics of a site and of the
Since their focus was to rank the pollution potential of individual livestock
operations: they did not explore the possible variations in manure application sites
and rates. There are no other significant site-specific animal waste management
studies. The limited few presented above, did not fully incorporate the
socio-economic and environmental factors in determining suitable manure application sites
and have not attempted to develop a site-specific manure application plan. Thus,
there is a significant gap in the area of manure management because there is no study
devoted to the site-specific use of animal waste as fertiliser in agricultural fields.
2.5 The objectives
Animal waste may be best utilised as fertiliser in agricultural fields. However, there
are potential environmental hazards that have to be addressed along with the
agronomic requirements and socio-economic and environmental limitations. The
importance of the catchment-wide animal waste application planning was discussed
and the usefulness of the geographic information system based techniques for the
site-specific animal waste application planning at a catchment-wide scale was
highlighted. The review focused on the site suitability analysis, degree of site
suitability determination, and site-specific manure application planning techniques.
Significant gaps were found in the literature within each of these areas.
The appropriateness of the various methods of site suitability analysis and the effect
of the number of input factors on areal extent of suitability are unknown. While a
method to assess the degree of site suitability is available, the effect of various data
pre-processing methods on the analysis is still unknown. The development of
encompassed in the literature. Therefore, there is a need to address these gaps for the
development of a comprehensive manure application plan.
The aim of this study is to establish a framework for the development of a
comprehensive catchment-wide manure application plan for the site-specific
application of animal waste as fertiliser in agricultural fields. The specific objectives
necessary to achieve this aim are:
1. to identify an appropriate GIS-based site suitability analysis technique and to
evaluate the factor sensitivity in determining areal extent of suitability;
2. to investigate the analytical factors influencing the degree of site suitability
determination and evaluate its possible use for site-specific decision-making;
and
3. to develop a geographic information system based catchment-wide manure
application plan for the site-specific application of animal waste as fertiliser to
CHAPTER 3
3
COMMON RESEARCH METHODS
3.1 Introduction
This chapter defines the project study area, discusses its suitability for this
site-specific manure management study, and delineates it from the digital elevation
model (DEM). Structuring a DEM is a pre-requisite for the sub-catchment
delineation. This chapter also provides the basis of identification, selection, and
processing of input factors for the site-specific animal waste utilisation study. The
common research methods applicable to chapters 4, 5, and 6 are outlined in this
chapter, while the section specific details follow in the respective chapters.
3.2 Study area
The Westbrook Creek sub-catchment of the Murray-Darling River Basin was
selected as the study area for this work. The Westbrook creek is situated close to the
city of Toowoomba in south-east Queensland, Australia (Figure 3.1). This area was
selected as the study site because of the: (a) presence of many intensive animal
industries in the area, (b) presence of limited agricultural land for animal waste
application, (c) water quality concerns in the area, (d) increasing demands for the
establishment of new intensive animal industries, (e) availability of the digital data
for the area, and (f) close proximity to the city of Toowoomba and the University of
Figure 3.1 Location of the study area: Westbrook sub-catchment in south east Queensland, Australia
Figure
3
.1
Location of the study area: Westbrook sub
A reconnaissance survey of the area was conducted prior to choosing the site for the
animal waste management study. The sub-catchment covers 24,903 hectares and
contained 20 dairies, 4 cattle feedlots, 9 intensive piggeries, and 6 intensive poultry
farms in 1998/99 (AgWise, 1999). The Westbrook area is relatively flat (ie 90 % area
within 10% slope) with undulating to rolling hills (Figure 3.2a) and it is drained by
the Westbrook Creek system (Figure 3.2b). Most of the flat and undulating areas
have fertile self-mulching Vertisol soils (Isbell, 1996, p102) and are used for
extensive farming (Figure 3.2c). The sizes of the farm holdings vary from tens to
several hundred hectares. Other land-uses and vegetation include native pasture,
woodlands, and open forest. There are no major townships within the sub-catchment
but the city of Toowoomba adjoins the study area in the east.
The common crops grown in the Westbrook creek sub-catchment include barley,
wheat, maize, sorghum, soybean, sunflower, and lucerne. At the time of
investigation, single yearly harvest is a common practice for most crops except
lucerne, which is harvested seven times in a year. The use of animal waste for
fertilising crops is currently restricted to the fields near the intensive animal
production facilities. Chemical fertilisers are also widely used for fertilising crops in
(a)
(b)
(c)
3.2.1 Using a sub-catchment as the study unit
Catchments and sub-catchments are the fundamental hydrologic units commonly
used for land and water resources management study (Moore et al, 1991). Using a
sub-catchment as a study unit for animal waste application planning was one of the
many possible options available for delineating the study area. Sub-catchments
(catchments) are natural hierarchical dissections of landscapes connected in the
direction of flow (Band, 1999). The subdivision of the landscape into catchments and
sub-catchments is performed around the stream network and these areas are defined
on the basis of the drainage network above the catchment outlet (Moore et al, 1991).
Using a sub-catchment as a geographic boundary for animal waste application
planning in agricultural fields was justified in this study on the basis that:
• Application of animal waste, as manure in agricultural fields, requires adjusting
the application rates to minimise surface water pollution. The net effect of
animal waste application on surface water pollution can be conveniently
monitored in a sub-catchment scale at the outlets.
• The odour and dust pollution arising from animal waste sources are mostly
restricted within the sub-catchment. This is because, the odour and dust usually
rise up in the atmosphere and dilute at higher altitude before drifting away to
the neighbouring sub-catchments. Any effect of odour and dust will therefore
be most prevalent within the service sub-catchment.
• Transportation network density within a sub-catchment is usually higher than
between catchments. This is due to the presence of higher hills as
Transport infrastructure is a prerequisite for relocating animal waste cost
effectively and conveniently for field application.
• Most agricultural areas are located on the lower slopes in the sub-catchment
since the steep hills near the boundaries are often not suitable for agricultural
practices. The cost of transportation of manure typically becomes restrictive if
moved beyond the sub-catchment boundaries.
• Leaching of nutrients to the groundwater system is a serious environmental
problem. Knowledge of the surface water hydrology is important to protect the
groundwater system since they are interconnected through the process of
recharge and discharge. The catchment, which serves as the recharge zone for
groundwater, is an appropriate unit to understand the surface water hydrology.
3.2.2 Structuring the digital elevation model of the study area
A digital elevation model (DEM) is an ordered array of numbers that represents the
spatial distribution of elevations above some arbitrary datum in a landscape (Moore
et al, 1991). The DEM serves as input for generating a number of other useful data
sets including slopes, aspects, hillshades, flow accumulation, and flow direction.
Sub-catchments can be readily delineated from the digital elevation model (DEM)
provided the natural surface drainage (flow direction) is represented accurately in the
DEM (Hutchinson and Gallant, 1999).
Grid and triangulated irregular network (TIN) based methods are available within
GIS for structuring a DEM. TOPOGRID is a grid-based DEM structuring module
available within ARC/INFO (ESRI, 1997). The CREATETIN followed by
(ESRI, 1997). The process shown in Figure 3.3 was followed to create the digital
elevation models (10 m × 10 m cell size) for the approximated study area (Appendix
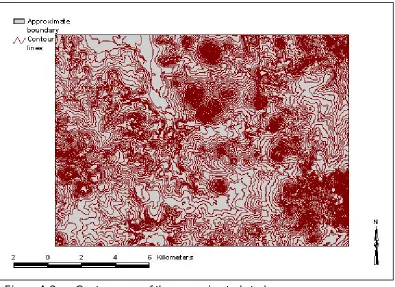
A, Figure A.1) using both of these methods. The contour map (Appendix A, Figure
A.2) and flow corrected stream network (Appendix A, Figure A.3) data of the
approximated study area were used as inputs for structuring the DEM. Raw contour
and stream network data sets from 1: 25,000 maps were pre-processed before using
them as input.
The digital elevation models created using the two different methods were correlated
and found to be very similar (r = 0.9945). However, the DEM structured using the
TOPOGRID-based method was selected for the sub-catchment delineation due to its
computational efficiency, simple structure, and compatibility with raster GIS (Moore
et al, 1991). A hillshade view was created from the DEM for three-dimensional
viewing of the study area (Figure 3.4).
The spurious sinks or local depressions, which may be formed due to insufficient,
incorrect, or wrongly interpolated data (Hutchinson and Gallant, 1999), were filled in
the TOPOGRID-based DEM to make it depressionless (Appendix A, Figure A.4).
This is an essential step in using the DEM as input in catchment delineation (Moore
et al, 1991). The accuracy of the DEM was verified through random comparison of
spot heights between the DEM and the contour map. There was no apparent
Figure 3.3 A process used to structure the digital elevation model and delineate the sub-catchment
Contour Flow corrected
stream
Rectangular boundary
TIN
TOPOGRID CREATETIN
DEM
(Lattice) DEM
correlated
Flow direction Flow
accumulation
Depressionless DEM Depressionless
DEM
any sink ?
yes
Fill Fill
no
yes
no
Sub-catchment Catchment delineation Pour point
Figure 3.4 Hillshade view of the study area and the vicinities with overlaid stream network
Figure
3
.4
Hillshade
3.2.3 Delineating the sub-catchment
Delineation of the sub-catchment was achieved using the WATERSHED module in
ARC/INFO. This process involved computing the flow direction and identifying the
pour point (ie catchment outlet) prior to determining the catchment boundary. Flow
direction (Appendix A, Figure A.5) and flow accumulation grids (Appendix A,
Figure A.6) were computed from the selected DEM. The computed flow direction
grid was used as input into the WATERSHED function of the ARC/INFO to
delineate the sub-catchment boundary. The delineated sub-catchment boundary
(Appendix A, Figure A.1) was used to clip all the input data sets including the
depressionless DEM, which circumscribed the DEM of the study area (Figure 3.5).