Accepted Article
Title:
Analysing the Relation Between Structure and Aggregation
Induced Emission (AIE) Properties of Iridium(III) Complexes
through Modification of Non-Chromophoric Ancillary Ligands
Authors:
Laura Abad Galán, David B. Cordes, Alexandra M.Z. Slawin,
Denis Jacquemin, Mark I. Ogden, Massimiliano Massi, and Eli
Zysman-Colman
This manuscript has been accepted after peer review and appears as an
Accepted Article online prior to editing, proofing, and formal publication
of the final Version of Record (VoR). This work is currently citable by
using the Digital Object Identifier (DOI) given below. The VoR will be
published online in Early View as soon as possible and may be different
to this Accepted Article as a result of editing. Readers should obtain
the VoR from the journal website shown below when it is published
to ensure accuracy of information. The authors are responsible for the
content of this Accepted Article.
To be cited as:
Eur. J. Inorg. Chem.
10.1002/ejic.201801118
a. Laura Abad Galán, Prof. Mark .I. Ogden and Asoc. Prof. Max Massi.
School of Life and Molecular Science and Curtin Institute for Functional Molecules and Interfaces, Curtin University, Kent Street, Bentley 6102 WA, Australia.
b. Laura Abad Galán, David D. Cordes, Prof. Alexandra M.Z. Slawin and
Reader Eli Zysman-Colman.
Organic Semiconductor Centre, EaStCHEM School of Chemistry, University of St. Andrews, St. Andrews, Fife, KY16 9ST, United Kingdom
c. Prof.Denis Jacquemin
School of CEISAM, UMR CNRS 6230, University of Nantes, 2 rue de la Houssinière, 44322 Nantes, France.
Analysing the Relation Between Structure and Aggregation
Induced Emission (AIE) Properties of Iridium(III) Complexes
through Modification of Non-Chromophoric Ancillary Ligands
Laura Abad Galán
a,bDavid B. Cordes
b, Alexandra M.Z. Slawin
b, Denis Jacquemin*
c, Mark I. Ogden*
a,
Massimiliano Massi*
aand Eli Zysman-Colman*
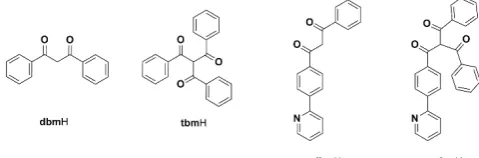
bAbstract: Unconventionally modified dibenzoylmethane (dbm) ligands have been synthesised and successfully utilised as ancillary ligands for neutral Ir(III) complexes of the formula [Ir(dFppy)2(LX)],
where dFppyH is 2-(2,4-difluorophenyl)pyridine and LX is tribenzoylmethane (tbm) or 1-phenyl-3-(4-(pyridin-2-yl)phenyl)propane-1,3-dione (pydbm). The modification of the ligands aims to prevent or enhance possible intermolecular interactions between the dFppy and/or the LX moiety in comparison with the previously reported [Ir(dFppy)2(dbm)] complex. The
aggregation induced emission (AIE) properties of these complexes are significantly modulated, as a consequence of the different π-π interactions revealed by X-ray crystallography.
Introduction
Since the observation of phosphorescence of
tris(2,2’-bipyridyl)ruthenium(II) dichloride [Ru(bpy)3]Cl2,1phosphorescent
transition metal complexes have garnered a great deal of
attention2–6 due to their use in a wide range of applications such
as emitters for electroluminescent devices,7 sensitizers for
energy and electron transfer,8–11 photocatalysis,6,12–15 dyes for
solar cells,16 imaging reagents as biological probes,17–19 and
sensors.20,21
Aggregation-induced emission (AIE) is a photophysical phenomenon, first formulated in 2001, where non-emissive luminogens are induced to emit light after the formation of
aggregates.22 Its discovery provided a new platform of research
that quickly motivated the science community because of its potential application particularly in life science and biomedical
engineering.23–27 Solid-state phosphorescence emission,
sometimes described as AIE, has been often found in platinum (II) complexes. Owing to their planar structures, Pt-Pt interactions in the solid state are possible, allowing efficient
metal-metal-to-ligand charge transfer (MMLCT) transitions.28–30
In contrast, octahedral iridium complexes cannot interact in a similar manner, making MMLCT transitions impossible. In 2008,
the first AIE iridium(III) complex was presented, [Ir(ppy)2(dbm)],
where ppyH = 2-phenylpyridine and dbm = dibenzoylmethane.31
This complex showed strong π-π interactions between the offset pyridine rings of two adjacent ppy ligands with a distance of ~3.37 Å. This proximity modifies the nature of the excited states, presenting enhanced phosphorescence in the solid state. Since then numerous examples have been presented in the
literature.32–37 Moreover, several examples of dFppy-based
iridium complexes have also shown AIE properties.35,38–40 The
[Ir(dFppy)2(dbm)] complex [dFppyH =
2-(2,4-difluorophenyl)pyridine], in particular, presented different π-π interactions between two neighbouring complexes in the X-ray
structure that involved the dFppyand the ancillary dbm ligands.
However, the lack of examples where structural organisation and AIE effects are directly compared inspired us to undertake this study. Two new complexes and the previously reported
complex [Ir(dFppy)2(dbm)], which is used as reference, have
been synthesised in an effort to better understand the relationship between intermolecular interactions, particularly involving the ancillary ligand, and the AIE phenomenon. The dFppy ligand was chosen as the cyclometalating moiety as it is known to favor π-π interactions in the solid state. Firstly, the
previously reported dbm and tbm41 molecules were employed
as ancillary ligands to probe if the extra carbonyl group on the α
-CH position would inhibit the π-π interactions between the
phenyl rings of the dbm moiety. Secondly, two new molecules,
1-phenyl-3-(4-(pyridin-2-yl)phenyl)propane-1,3-dione (pydbmH)
and
2-benzoyl-1-phenyl-3-(4-(pyridin-2-yl)phenyl)propane-1,3-dione (pytbmH) were designed to assess the effect of the extra
[image:2.595.305.545.534.613.2]pyridine ring, which could potentially allow intermolecular interactions in a similar manner to the dFppy moiety.
Figure 1. Structures of the ancillary ligands used in this report.
Results and Discussion
Synthesis of ligands. The
1-phenyl-3-(4-(pyridin-2-yl)phenyl)propane-1,3-dione (pydbmH) was synthesised in two
steps via a Claisen condensation to afford the intermediate 1-(4-bromophenyl)-3- phenylpropane-1,3-dione (Br-dbmH) in 85% yield, followed by a Stille cross-coupling reaction in 40% yield to obtain the desired molecule. The
2-benzoyl-1-phenyl-3-(4-Accepted
(Figure 2) in 65% yield. Both ligands were characterised by
melting point, 1H-NMR, 13C-NMR spectroscopy, mass
[image:3.595.48.285.132.272.2]spectrometry and elemental analysis (See experimental section).
Figure 2. Reaction scheme for ligands pydbmH and pytbmH.
Synthesis of the complexes. The chloro-bridged dimer, [Ir(dFppy)2(µ-Cl)]2, was synthesised in 67% yield by refluxing
dFppyH in 2-ethoxyethanol with IrCl3 as the iridium source. For
the synthesis of the previously reported complex
[Ir(dFppy)2(dbm)] (1), sodium carbonate in 2-ethoxyethanol was
used, affording the product in 90% yield, where the
characterisation matched that previously reported.42 When this
methodology was followed for the synthesis of 2 using tbmH,
the resulting retro-Claisen condensation product, 1, was
obtained. However, when triethylamine in a mixture of
DCM/EtOH (80:20 v/v) was employed, the desired complex 2
was isolated in 40% yield; the retro-Claisen product 1
corresponded to the remainder of the isolated material in a 30% yield (Figure 3).
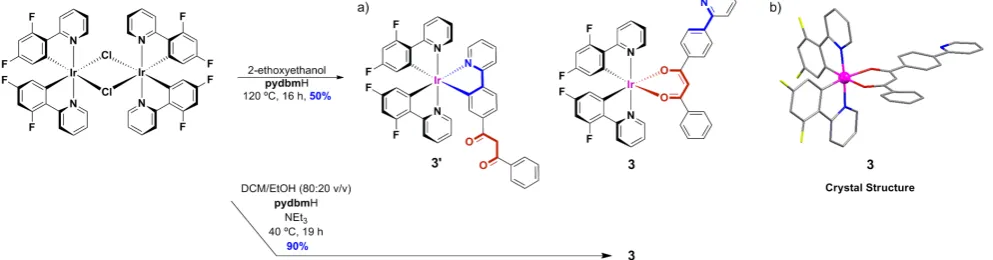
The synthesis of 3’ was first attempted without the presence of base in 2-ethoxyethanol. These conditions were chosen to favor
the coordination of the pydbm in a C^N mode leaving the
-dione moiety free for further coordination. However, the crystal structure of the resulting purified product, obtained in 50% yield, showed coordination of the ligand in a ketonate mode within the complex [Ir(dFppy)2(pydbm)], 3 (Figure 4b). The conditions of
the complexation reaction were then modified in an attempt to increase the yield of the reaction. When NEt3 and a mixture of
DCM/EtOH (80:20 v/v) were used, complex 3 was synthesised
in an excellent yield of 90%.Finally, the synthesis of complex 4,
[Ir(dFppy)2(pytbm)], was attempted following the O^O
coordination conditions. Unfortunately, the desired complex could not be isolated and only the retro-Claisen condensation
complex, 3, was obtained as the main product of the reaction in
80% yield. Retro-Claisen condensation reactions of
β-triketonates in solution has been previously noted43,44 by us and
the scope and mechanism of this transformation is currently
under investigation. The three isolated complexes 1-3 were fully
characterised by melting point, 1H-NMR, 13C-NMR, 19F-NMR,
mass spectrometry and elemental analysis (see experimental section).
Figure 3. Reaction scheme for complexes 1 and 2.
X-ray diffraction studies. The crystal structure of 1 had already been reported. The literature report stated that the
[Ir(dFppy)2(dbm)] complex crystallised as two polymorphs: one
in the space group C2/cand the other one in P .38 The main
difference between the two is the presence of different π-π interactions between two neighbouring complexes, involving a combination of two dFppy, one dFppy and one dbm or two dbm ligands.
In the case of complexes 2 and 3, crystals were obtained from
dichloromethane by slow diffusion of either ether (2) or hexane
[image:3.595.305.545.217.399.2](3). Complex 3 crystallised in the triclinic space group P . The asymmetric unit contained two similar but symmetrically inequivalent Ir(III) units, with an Ir…Ir distance of 8.85 Å.
Figure 4.- Reaction scheme for complexes 3’ and 3.
Accepted
[image:3.595.47.544.591.721.2]Interestingly, these two independent Ir(III) complexes are connected by π-π interactions involving the offset pyridine group of a dFppy ligand and the phenyl ring of the pendant
phenylpyridine moiety of pydbm, with interplanar distance and
centroid-to-centroid distance of 3.315 Å and 3.808 Å,
[image:4.595.58.284.158.323.2]respectively (Error! Reference source not found.).
Figure 5. Representation of the X-ray crystal structure of [Ir(dFppy)2(pydbm)] (3), emphasising the supramolecular composition formed by π-π stacking interactions. Hydrogen atoms and solvent molecules have been omitted for clarity.
In the case of 2, the complex crystallised in the monoclinic
space group I2/a, with a single complex in the asymmetric unit.
Only one set of π-π interaction are found (Error! Reference
source not found.); between adjacent and offset dFppy ligands,
with a centroid to centroid distance of 3.678(2) Å. This π-π
interaction also has a pair of CH···π interactions working in concert with it, involving hydrogen atoms on the π-stacking rings
interacting with the π-system of further dFppy rings of the
adjacent complex, at a distance of 2.62 Å. As predicted, the extra acyl group of the b-triketonate, in comparison to the dbm
molecule, seems to be responsible of the lack of π-π interactions between the phenyl rings of two subsequent units. However, weak C-H···O hydrogen bonds do occur, between a phenyl C-H of a coordinated ketone, and the non-coordinating ketone oxygen of an adjacent complex (CH···O distance of 2.57 Å, corresponding C···O separation of 3.234(4) Å). These interactions give rise to a weakly interacting zigzag chain
running along the crystallographic b-axis.
Figure 6. Representation of the X-ray crystal structure of [Ir(dFppy)2(tbm)] (2), emphasising the supramolecular structure formed by intermolecular interactions. Hydrogen atoms and molecules of solvent have been omitted for clarity.
UV-VIS absorption. The absorption spectra of 1-3 measured in
acetonitrile are presented in Error! Reference source not
found. while Figure S13 provides the corresponding spectra obtained with Time-Dependent Density Functional Theory
(TD-DFT). Complexes 2 and 3 present relatively unstructured
spectra comparable to that of 1, which itself shows a profile
equivalent to that reported in the literature.38 Complexes 2 and 3
show higher molar absorptivities compared to 1, likely due to the
presence of the extra acyl group and pyridine ring, respectively, in these complexes. The high energy absorption bands are assigned to π-π* transitions of the dFppy45,46 and ancillary
ligands.31,47 (250 - 350 nm). The low energy band at 380 nm is
attributed to a metal-to-ligand charge transfer transition (1MLCT),
while bands above 400 nm can be assigned to mixed CT.38 The
onset of the CT bands is of comparable energy at ~465 nm for the three complexes, which suggests that these bands are
based on the π orbitals of the dFppy ligands and similar metal
orbitals. TD-DFT predicts the lowest vertical singlet transitions at 413 (f=0.02) and 406 nm (f=0.04), 409 (f=0.02) and 406 nm (f=0.03), and 426 (f=0.01) and 407 nm (f=0.04) for for 1, 2 and 3,
[image:4.595.306.543.387.551.2]respectively, all of which correspond to mixed HOMO to LUMO and HOMO to LUMO+1 transitions. As can be seen in Figure S14, the HOMO is localised on the metal and fluorinated phenyl rings, whereas the LUMO and LUMO+1 are localised on the ancillary ligand and C^N ligands, respectively. These bands therefore have a mixed MLCT and LLCT character.
Figure 7. Absorption spectra of [Ir(dFppy)2(L)] for L = dbm (black trace), tbm (blue trace) and pydbm (red trace) in acetonitrile at room temperature (ca. 10 -5 M).
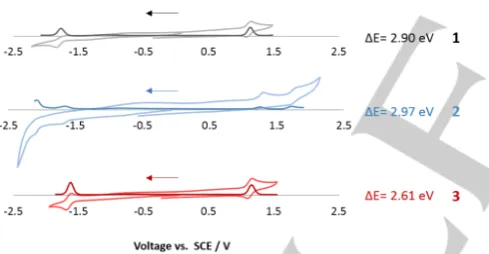
Electrochemistry. The electrochemical properties were studied by cyclic voltammetry (CV) and differential pulse voltammetry (DPV) in de-aerated MeCN at 298 K in order to estimate the energies of the frontier molecular orbitals of 1-3 A summary of the redox potentials of the complexes, referenced with respect to
the saturated calomel electrode, SCE, (Fc/Fc+ = 0.38 V in
MeCN)48, is given in Table 1.
The electrochemistry of the related tris-cyclometalated Ir(III)
complex, fac-Ir(dFppy)3, had been previously studied.49 The
reversible oxidation of this reference complex involves the
Accepted
[image:4.595.52.286.595.686.2]iridium ion and the π orbitals of the difluorophenyl (dFph) part of the dFppy ligands (IrIII/IV + dFph) whereas the reduction is
localised on the pyridyl ring of the dFppy ligands. Thus, if
oxidation or reduction processes involving the ancillary ligand do
not take part in these systems, complexes 1-3 will present a
comparable behaviour to that of fac-Ir(dFppy)3. The reported
redox values for fac-Ir(dFppy)3 are Eox = 0.76 V; Ered = -2.49 V vs
SCE in MeCN. A second reference complex,
[Ir(dFppy)2(acac)],50 possesses comparable electrochemical
properties (Eox = 0.76 V; Ered = -2.44 V vs SCE) to those of fac
-Ir(dFppy)3.
The oxidation potentials of 1-3 were found, respectively, at 1.05
V, 1.30 V and 1.10 V (Figure 8). These numbers vary
significantly from the oxidation potentials for the two reference complexes, suggesting some contribution from the ancillary ligands, likely via influence of the electron density on the iridium.
Furthermore, while 1 and 3 show similar oxidation potentials,
complex 2 presents a larger value, which is indicative of a
stronger influence of tbm in comparison to dbm or pydbm on
the oxidation process. When looking at the reduction potential values (Ered(1) = -1.85 V; Ered(2) = -1.67 V; Ered(3) = -1.60 V) a
significant change with respect to the reduction of fac-Ir(dFppy)3
(Ered = -2.49 V) is observed that is indicative of an ancillary
ligand-based LUMO, in agreement with previous assignments in the literature for the [Ir(dFppy)2(dbm)],38,42 as well as with the
present theoretical result (Figure S14).
Figure 8. CV and DPV traces of 1 (black trace), 2 (red trace) and 3 (blue trace), versus SCE (Fc/Fc+ = 0.38 V in MeCN). Scan rates of 100 mV s-1 with scans taken in the negative direction.
Surprisingly, significantly different values of the oxidation and reduction potentials as well as the redox gap were found in the literature for 2 (Eox42 = 0.32 V, Ered42 = -2.02 V and ΔE42 = 2.34
eV; Eox38 = 0.73 V, Ered38 = -2.16 V and ΔE38 =2.64 eV).38,42
These literature values are also different to the experimental data observed in the present study under similar conditions (Eox(1) = 1.05 V, Ered(1) = -1.85 V and ΔE(1) =2.90 eV). This
could be due to different values given for the internal standard
ferrocene/ferrocenium (Fc/Fc+).48 While in the case reported
here a value of 0.38 V vs SCE48 was used, other numbers such
as 0.40 V51 or 0.45 V52 can also be found in literature.
Unfortunately, the reported literature for complex 2 does not
include the number used for this referencing, making this comparison infeasible.
The LUMO of complex 3 is the most stabilised, which is a logical
consequence of the presence of a pyridyl ring. The DFT
calculation indeed also return a LUMO more stabilised in 3 than
in both 1 and 2, by -0.16 eV. As can be seen in the ESI, the
LUMO of 1 and 3 is localised almost exclusively on the ancillary
[image:5.595.51.296.401.528.2]ligand, whereas there is additionally a small contribution from the C^N ligand for 2.
Table 1. Electrochemical data for complexes 1-3.a
Complex Eox / V b
HOMO / eV c
Ered /
V b
LUMO/ eV
c
DEH-L/
eV
fac-Ir(dFppy)349 0.76 -5.56 -2.49 -2.31 3.25
Ir(dFppy)2(acac)50 0.76 -5.56 -2.44 -2.36 3.20 1 1.05 -5.85 -1.85 -2.95 2.90
2 1.30 -6.10 -1.67 -3.13 2.97
3 1.10 -5.81 -1.60 -3.20 2.61
a. Measurements were performed in MeCN at 298 K at a scan rate of 100 mV s-1, with Fc/Fc+ used as an internal standard. b. Potential values were obtained from the DPV spectra and referenced with respect to SCE (Fc/Fc+ = 0.38 V).48 c. The energies of the HOMO and LUMO levels estimated using: EHOMO = -[Eox vs Fc/Fc+ + 4.8]eV and ELUMO = -[Ered vs Fc/Fc+ + 4.8]eV, respectively.
Photophysics. The photophysical properties of 1-3 were studied in MeCN and dichloromethane at room temperature, in a dichloromethane frozen matrix at 77 K, in doped films (10 wt% in PMMA) and in the solid state as powder samples. The photophysical data, including excited state lifetimes (tPL) and
photoluminescence quantum yields (FPL) are reported in Error!
Reference source not found. and 3.
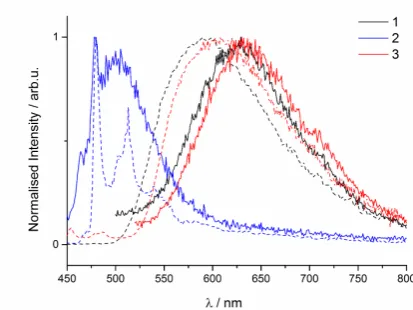
The room temperature emission spectra in deaerated MeCN show very weak emission at 629 nm, 498 nm and 625 nm for the
1, 2 and 3,respectively (Figure 9). In the case of complexes 1
and 3, the broad emission band is significantly red-shifted
compared to the structured emission of fac-Ir(dFppy)3 at 469 nm,
itself previously assigned to mixed MLCT/LC transitions.49 The
tPL were found to be on the order of nanoseconds (tPL (1) = 12
ns and tPL (3) = 7.5 ns) and the FPL values below 1%, indicative
of large non-radiative decay. This photophysical profile strongly contrasts with the FPL and FPL of fac-Ir(dFppy)3 (tPL = 1.64 µs ,
FPL = 77%)49. Indeed, previous DFT calculations for 1 suggested
that the emission had MLCT mixed with intraligand charge transfer (ILCT) character and the poor emissive properties in solution were caused by efficient non-radiative decay promoted by strong vibrations of the dbm in the low frequency region.53
Therefore, comparable behaviour would be expected for
complex 3. In the case of complex 2, although the emission
maximum is not significantly shifted with respect to the
3MLCT/LC transition of fac-Ir(dFppy), the tPL (30 ns), FPL (2%)
and profile of the emission bands are indicative of significant changes and seem more characteristic of significantly quenched
ligand-centred (LC) emission. For 1, 2 and 3, the DFT computed
0-0 phosphorescence wavelengths are 565, 518 and 576 nm, respectively, which should correspond to the intersection point between the absorption and phosphorescence bands. The ordering is in good agreement with the measurements of Figure
Accepted
9, although our value for 2 is too blue-shifted. Therefore, the triplet states of the three ancillary ligands were also estimated at the 0-0 transition of the phosphorescence spectra of their gadolinium complexes. Values of 487 nm, 183 nm and 504 nm
for the dbm, tbm and pydbm were found, respectively (Figure
S15). In the case of tbm, this experimental value matches with
what it was observed for complex 2, which confirms the LC
nature of this transition.
The evolution of the geometry of the structures in going from the lowest singlet to triplet states (coordinates in the ESI) is also
markedly different. While for 2, the acac moiety is almost
unaffected by the change of state, in both 1 and 3, one notices a
shortening of the Ir-O bonds (from ca. 2.16 Å to 2.09 Å) and a significant change of dihedral angle of the acac moiety compared to the ideal orientation that goes from 2-3° in the singlet state to ca. 25° in the triplet state. The computed spin
density difference plots can be found in Figure 10. For 1 and 3
the spin density of the triplet is mainly localised on the metal and the ancillary ligands, hence explaining the similarity between the
two emission spectra. In contrast, in 2, the triplet state is mainly
localised on one of the two more rigid C^N ligands according to DFT, consistent with the emission profile shown in Figure 9 as well as with the above described changes of structures. It is also interesting to note that the spin density on the Ir centre is estimated to be similar in all three complexes (ca. 0.5-0.6), i.e., it is the localisation of the triplet rather than the involvement of the metal that differs in the three structures.
[image:6.595.50.288.408.575.2]Figure 9. Normalised emission (lexc = 420 nm) spectra for 1 (black trace), 2 (blue trace) and 3 (red trace) in MeCN (solid trace) and dichloromethane at room temperature (ca. 10-5 M) (dashed trace).
Figure 10. Spin density difference plots for the lowest triplet states of the three studied complexes, where the contour threshold for the spin density is 2 x 10⁻³ au.
The photoluminescence spectra were also studied in deaerated dichloromethane at room temperature in order to assess the impact of using less polar solvents (Figure 9). CT states are frequently found to be stabilised upon increasing the solvent
polarity.54–58 This effect is commonly known as positive
solvatochromism. However, solvatochromisim is a complex phenomenon as many different interactions and dynamic processes can take place. Indeed, the experimental data for
complexes 1 and 3 showed an unusual but not
unprecedented59,60 negative solvatochromic shift. This indicates
a decrease of the dipole moment in the excited state with respect to the ground state, i.e., DFT predicts that the total dipole moment of 1 (3) goes from 6.8 to 1.2 D (6.8 to 3.2 D) when going from the ground to the excited state. Such changes naturally translates into a higher stabilisation of the ground state
in more polar solvents consistently with previous suggestions.59
By contrast, the emission maximum undergoes a slight positive
solvatochromism in complex 2, which is consistent with DFT
(increase of dipole from 5.4 D to 8.9 D) and with the different nature of the triplet state (vide supra).45
When the photoluminescence properties were studied in a frozen dichloromethane matrix, a clear blue-shift was identified
in complexes 1 and 3, while the emission maximum of 2
remained unchanged (Figure 11). The fact that no rigidochromic
shift was found for the emission maximum in 2 hints to a 3LC
nature emission for this complex in the solid-state. By contrast,
the blue-shifted emission of complexes 1 and 3 suggests mixed
CT character, in agreement with the literature and the RT PL
studies.42 The three complexes in the frozen matrix presented
prolonged lifetime values of 800 ns, 3.77 µs and 630 ns for 1, 2
and 3, respectively. These longer lifetimes can be explained by
a reduction of the vibrational motions at 77 K, which results in a decrease in the non-radiative decay rate. While 1 and 3 have similar ФPL values, that of 2 is much longer, which is another
indication that in this case, the transition is LC in nature.
Figure 11. Normalised emission (λexc = 420 nm) spectra for 1 (black trace), 2 (blue trace) and 3 (red trace) in MeCN (10-5 M) at room temperature (dark trace) and in a dichloromethane matrix at 77 K (dashed trace).
Accepted
[image:6.595.316.523.501.656.2]In contrast to the weak emission found for the three complexes in solution, intense luminescence was produced at ~550 nm when the complexes were doped into films (10 wt% in PMMA), with improved photoluminescence quantum yields of 8.2%, 8.9% and 6.3% for 1, 2 and 3, respectively (Figure 12). As previously observed for [Ir(dFppy)2(dbm)] (1),38,42 the phosphorescence
mechanism for 2 and 3 is modulated by intermolecular
interactions. These interactions promote the stabilisation of the excited states and also induce reduced non-radiative decay. Interestingly, the maximum emission wavelength is similar for the three complexes at ~550 nm, which may indicate that the transitions occurring are based on similar delocalised states as previously suggested for 1.31
Table 2. Photophysical data of 1-3 in MeCN and DCM (ca. 10-5 M) at RT and 77 K.
Complex Medium lPL / nm FPL / %a tPL / ns
1 MeCN-RT DCM-RT DCM-77K 629 660 595 1.02 - - 12 18 800 2 MeCN-RT DCM-RT DCM-77K 498 477 478 2.1 - -
2 (35%), 30 (65%) 17 3770 3 MeCN-RT DCM-RT DCM-77K 625 679 607 0.5 - - 7.5 10 630
a.Photoluminescence quantum yields in MeCN relative to
[Ru(bpy)3](PF6)2 in MeCN (FPLref = 9.5%) 61
When the photophysical behaviour of 1-3 were explored in the
crystalline powder state, where there can be different sets of intermolecular interactions, a red-shift in the emission maximum was found for each of the here investigated complexes (Figure
12). These data suggest that the excited states change nature
due to the different intermolecular interactions as a function of increased aggregation. Interestingly, the largest shift was found
for complex 2,which happened to present the strongest ancillary
ligand-based interactions as assessed by the relatively shorter
distance of 3.2 Å, against 3.4 Å for the dbm and pydbm ligands
in the crystal structure. Photoluminescence quantum yields and excited state lifetimes in the powder state were measured to be
21%, 3% and 6%, and 361 ns, 13 ns and 97 ns for 1, 2 and 3,
respectively. These data reveal that the dbm-containing
complexes are more efficient emitters in the powder. Indeed, while radiative decay rates (kr), calculated from FPL = kr/(kr + knr)
were comparable for complexes 1 and 3 and significantly larger
in the case of 2, non-radiative decay rates (knr) for 2 and 3 were
found to be 30 and 4 times larger than that of 1 (22·106 s-1). It is
important to note that the plane of the acac unit for complexes 1
and 3 in the excited state is significantly distorted with respect to
the C-Ir-C plane while this distortion is almost neglible for
complex 2. These data therefore suggest that the lack of
distortion in the solid state may lead to possible deactivation pathways, which is in agreement with results previously found
on acac and iminophenolate complexes.62
FFigure 12. Normalised emission spectra (lexc = 420 nm) for 1 (black trace), 2 (blue trace) and 3 (red trace) in doped films (10 wt% in PMMA) (solid trace) and as powder (dashed trace).
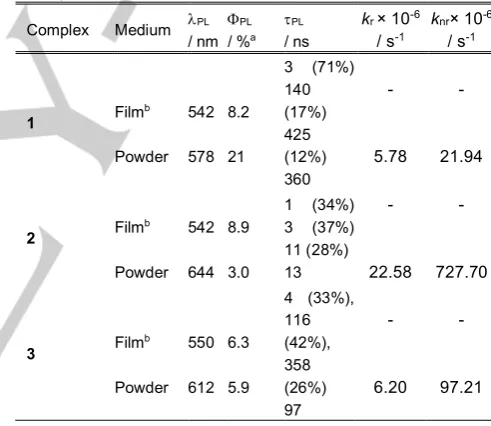
Table 3. Photophysical data of 1-3 in PMMA doped films and powder (lexc = 420 nm).
Complex Medium lPL / nm
FPL
/ %a
tPL
/ ns
kr × 10-6
/ s-1
knr× 10-6
/ s-1
1 Film
b Powder 542 578 8.2 21
3 (71%) 140 (17%) 425 (12%) 360 - 5.78 - 21.94
2 Film
b Powder 542 644 8.9 3.0
1 (34%) 3 (37%) 11 (28%) 13 - 22.58 - 727.70
3 Film
b Powder 550 612 6.3 5.9
4 (33%), 116 (42%), 358 (26%) 97 - 6.20 - 97.21
a.Photoluminescece quantum yields measured with an integrating sphere. b.
Films were prepared by doping 10 wt% of the complex in PMMA.
As a function of this analysis, AIE studies were performed on 1-3.
Indeed, addition of water into dilute acetonitrile solutions turned on the photoluminescence emission of the three complexes with a large enhancement in the emission intensity for 3, a modest enhancement for 1, and almost a negligible effect for the tbm
analogue, 2 (Figures 13, S11 and S12, respectively). These
results clearly suggest that the structural modifications of the ancillary ligands tune the intermolecular interactions, and hence directly affect the AIE behaviour. The PL intensity was a
maximumwhen the water contentreached 70%, 80% and 60%
for 1, 2 and 3, respectively, and then decreased at higher
percentages in every case. This is probably due to two different reasons: firstly, after aggregation, the molecules become
covered with other aggregated particles and do not emit light;63
Accepted
[image:7.595.316.545.84.245.2] [image:7.595.298.544.321.534.2]and secondly, because in the process of aggregation of crystallites, amorphous particles are simultaneously formed,
which do not enhance the emission intensity.64
[image:8.595.48.288.131.285.2]Figure 13. a) Emission spectra (lexc= 420 nm) of 3 in dilute MeCN (1) MeCN-H2O (4:6 v/v) (2) and MeCN-H2O (1:9 v/v) (3). b) Variation of intensity according to water content.
Conclusions
Herein, two novel iridium complexes, [Ir(dFppy)2(pydbm)], 3, and
[Ir(dFppy)2(tbm)], 2, bearing β-diketonate/triketone ligands,
respectively, were synthesised and their optoelectronic
properties compared to the reference complex [Ir(dFppy)2(dbm)],
1. All three complexes are poorly emissive in acetonitrile and dichloromethane solutions while their emission properties are remarkably enhanced in both 10 wt% PMMA films and as powders. By analysing the molecular packing in the crystal structures of 2 and 3, the aggregation-induced emission could be explained by a change in the nature of the emission to one based on a mixed metal-to-ligand charge transfer and ligand-to-ligand charge transfer state formed in the solid state. These results showed that the addition of different substituents to the
dbm moiety, a pyridyl group in the case of [Ir(dFppy)2(pydbm)],
or a benzoyl group in the case of [Ir(dFppy)2(tbm)], alters the p
-p stacking involving the ancillary ligands and disrupts the
intermolecular interactions of the cyclometalated moiety (dFppy), which modulates the AIE properties of the iridium complexes.
Experimental Section
General Procedures. Commercial chemicals were used as supplied. All reactions were carried out using solvents of reagent grade or better. Flash column chromatography was performed using silica gel (60 Å, 40-63 μm). Analytical thin layer chromatography (TLC) was performed using silica plates with aluminum backings (250 μm with indicator F-254). Compounds were visualised under UV light. 1H, 13C and 19F NMR spectra were recorded on Bruker Avance spectrometers at 300 – 500 MHz, 126 MHz and 376 MHz, respectively. High-resolution mass spectra were recorded at the EPSRC UK National Mass
Spectrometry Facility at Swansea University on a quadrupole time-of-flight (ESI-Q-TOF), model ABSciex 5600 Triple TOF in positive electrospray ionisation mode and spectra were recorded using sodium formate solution as the calibrant. Elemental analyses were performed by Mr. Stephen Boyer, London Metropolitan University. Melting points (Mp) were recorded using open-ended capillaries on an Electrothermal melting point apparatus and are uncorrected.
Photophysical measurements. All samples were prepared in HPLC grade MeCN. Absorption spectra were recorded at room temperature using a Shimadzu UV-1800 double beam spectrophotometer. Molar absorptivity determination was verified by linear least squares fit of values obtained from at least four independent solutions at varying concentrations ranging from 5.22 × 10⁻⁵ to 8.41 × 10⁻⁶ M. The sample solutions for the emission spectra were prepared in HPLC grade MeCN and degassed via three freeze−pump−thaw cycles using an in-house designed quartz cuvette. Steady-state and time-resolved emission spectra were recorded at room temperature using a Gilden photonics Fluorimeter and Edinburgh Instruments
FLS980 fluorimeter, respectively. For steady-state
measurements at room temperature complexes 1-3 were excited
at 420 nm. The excited state lifetimes of the complexes were obtained by time correlated single photon counting (TCSPC) at an excitation wavelength of 378 nm using a pulsed diode laser, and PL emission was detected at the corresponding steady-state emission maximum for each complex. Photoluminescence quantum yields in solution were determined using the optically
dilute method.65 A stock solution with absorbance of ca. 0.2 was
prepared, and then four dilutions were prepared with dilution factors between 2 and 20 to obtain solutions with absorbances of ca. 0.103, 0.076, 0.052, and 0.026, respectively. The Beer−Lambert law was found to be respected (linear dependency) at the concentrations of the solutions. The emission spectra were then measured after the solutions were degassed by three freeze−pump−thaw cycles using an in-house designed quartz cuvette prior to spectrum acquisition. For each sample, linearity between absorption and emission intensity was verified through linear regression analysis, and additional measurements were acquired until the Pearson regression factor (R2) for the linear fit of the data set surpassed 0.9.
Individual relative quantum yield values were calculated for each solution, and the values reported represent the slope value. The
Fs = Fr(Ar/As)(Is/Ir)(ns/nr)2 equation was used to calculate the
relative quantum yield of each of the sample, where Fr is the
absolute quantum yield of the reference, n is the refractive index of the solvent, A is the absorbance at the excitation wavelength, and I is the integrated area under the corrected emission curve. The subscripts s and r refer to the sample and reference, respectively. A solution of [Ru(bpy)3](PF6)2 in deaerated MeCN
at 298 K (FPL = 9.5%) was used as a reference. 61 Quantum
yields in the solid state were measured with the use of an
integrating sphere coated with BenFlect.66
Electrochemical measurements. Cyclic voltammery (CV) and differential pulse voltammetry (DPV) measurements were
Accepted
performed on an Electrochemical Analyzer potentiostat model 600D from CH Instruments. Solutions were prepared in MeCN and degassed with solvent-saturated nitrogen by bubbling for ca.
10 min prior to scanning. Tetra(n
-butyl)ammoniumhexafluorophosphate (TBAPF6; ca. 0.1 M in
MeCN) was used as the supporting electrolyte. Two Ag/Ag+
electrodes (silver wire in a solution of 0.1 M KCl in H2O) were
used as the pseudoreference electrode and counter electrode, respectively; a platinum electrode was used for the working electrode. The redox potentials are reported relative to a saturated calomel electrode (SCE) electrode with a
ferrocene/ferrocenium (Fc/Fc+) redox couple as the internal
reference (0.38 V vs SCE).48
Theoretical methods. To perform DFT and TD-DFT
calculations, we have used the Gaussian16 program.67 Our
calculations consisted in geometry optimisation vibrational spectra determinations and TD-DFT calculations of the different structures. We have applied default procedures, integration grids, algorithms and parameters, except for tighten energy (typically 10−10 a.u.) and internal forces (10−5 a.u.) convergence thresholds. The ground-state geometrical parameters have been
determined with the M06 functional.68 The vibrational spectrum
has been subsequently determined analytically at the same level of theory and it has been checked that all structures correspond to true minima of the potential energy surface. At least, the first thirty low-lying excited-states have been determined within the vertical TD-DFT approximation using the same functional, that is
suited for optical spectra69,70 Phosphorescence was studied by
optimizing the lowest triplet excited-state with unrestricted DFT (M06 functional). For the structural and vibrational calculations, we used the LanL2DZ atomic basis set and pseudo-potential for all atoms, augmented by d functions with α=0.587, 0.736, 0.961 and 1.577 for C, N, O and F, respectively and f functions with exponent of 0.938 for the Ir centres. During all steps, a modelling of bulk solvent effects (here CH3CN) through the
Polarizable Continuum Model (PCM),71 using the liner-response
approach in its non-equilibrium limit for the TD-DFT part of the calculation. The contour threshold used to draw the MOs (spin densities) was set to 0.02 (0.002) au.
Synthesis of ligands
pydbmH (1-phenyl-3-(4-(pyridin-2-yl)phenyl)propane-1,3-dione).
4-bromo benzoic acid (1 g, 4.90 mmol, 1.2 equiv.) was dissolved in MeOH in the presence of a catalytic amount of H2SO4 and
refluxed for 16 h. The crude mixture was then neutralised with
saturated Na2CO3 and extracted with ethyl acetate (3 x 15 mL).
The organic layer was then dried under reduced pressure giving the correspondent methyl 4-bromobenzoate as a white solid in a quantitative yield. A suspension of NaH (60% in mineral oil, 468 mg, 11.70 mmol, 3 equiv.) was prepared in 15 mL of THF and stirred for 30 min. at 0 ºC. After this time, a solution of the acetophenone (465 mg, 3.90 mmol, 1 equiv.) in 7 mL of THF was added dropwise at 0 ºC. The same step was then
performed with the previously prepared methyl
4-bromobenzoate (1 g, 4.65 mml, 1.2 equiv.). The suspension was kept at room temperature for 1 h. and then heated at 40 ºC for
16 more h. The crude mixture was neutralised with an HCl solution (1 M) and extracted with ethyl acetate (3 x 15 mL). The compound was purified by recrystallisation from EtOH giving a
white solid corresponding to
1-(4-bromophenyl)-3-phenylpropane-1,3-dione (Br-dbmH) in 85% yield, whose characterisation matched with reported literature.72 Finally,
2-(tributylstannyl)pyridine (607 mg, 1.65 mmol, 1 equiv.) was reacted with the previously formed Br-dbmH (500 mg, 1.65 mmol, 1 equiv.) using Stille coupling reaction conditions catalysed by Pd(PPh3)4 (92 mg, 0.08 mmol, 0.05 equiv.) in dry
toluene.73 The reaction mixture was refluxed for 32 h. at 120 ºC.
The crude product was purified by silica gel chromatography (hexanes/ethyl acetate 90:10,), giving the pure compound as a
light brown solid. Yield 40%. Rf = 0.55. M.p. 83-85 °C. 1H NMR
(500 MHz, CDCl3) δ 8.77 (dt, J = 4.7, 1.4 Hz, 1H), 8.15 (q, J = 8.6 Hz, 4H), 8.07 – 8.02 (m, 2H), 7.86 – 7.80 (m, 2H), 7.63 – 7.57 (m, 1H), 7.56 – 7.50 (m, 2H), 7.33 (ddd, J = 6.2, 4.8, 2.6 Hz,
1H), 6.95 (s, 1H). 13C NMR (126 MHz, CDCl3) δ 186.13, 184.88,
156.16, 149.93, 143.06, 135.71, 135.59, 132.54, 128.72, 127.65, 127.40, 127.12, 122.89, 120.97, 93.36, 77.28, 77.03, 76.77.
HR-MS (FTHR-MS+) [M+H]+: Calculated: 302.1176, Found: 302.1209.
Elemental analysis calcd (%) for C20H15NO2(H2O): C, 77.40; H,
5.20; N, 4.51; found: C, 77.80; H, 5.35 H, 4.27.
pytbmH (2-benzoyl-1-phenyl-3-(4-(pyridin-2-yl)phenyl)propane-1,3-dione). NaH (60% in mineral oil, 40 mg, 0.99 mmol, 3 equiv.) and pydbmH (100 mg, 0.33 mmol, 1 equiv.) were combined in 10 mL of THF and the suspension was maintained at 0 ºC. To this suspension, the benzoyl chloride (93 mg, 0.66 mmol, 2 equiv.) in 5 mL of THF was added dropwise. After the addition, the mixture was stirred under a nitrogen atmosphere at 40 ºC for 24 h. The crude was neutralised with an acetic acid solution (1 M) and extracted with ethyl acetate (3 x 10 mL). The organic layers were dried under vacuum and the resulting solid washed with diethyl ether in order to remove the excess of benzoic acid formed in the reaction mixture. The pure compound resulted as
a pale brown solid. Yield: 50%. M.p. 197-199 ºC. 1H NMR (400
MHz, CDCl3) δ 8.81 – 8.67 (m, 1H), 8.17 – 8.01 (m, 4H), 8.01 –
7.93 (m, 4H), 7.84 – 7.76 (m, 2H), 7.63 (t, J = 7.4 Hz, 2H), 7.50
(t, J = 7.7 Hz, 4H), 7.32 (ddd, J = 6.6, 4.8, 1.7 Hz, 1H), 7.19 (s,
1H). 13C NMR (101 MHz, CDCl
3) δ 192.03, 191.71, 136.17,
135.69, 134.06, 129.54, 129.39, 129.05, 128.80, 128.49, 128.31,
128.12, 127.69, 114.98, 66.50. HR-MS (FTMS+) [M+H]+:
Calculated: 406.1435, Found: 406.1438. Elemental analysis calcd (%) for C27H19O3 (0.75·H2O): C, 77.40; H, 4.93; N, 3.34;
found: C, 77.40; H, 4.57; N, 3.35.
Synthesis of complexes
[Ir(dFppy)2(µ-Cl)]2
(Tetrakis[2-(4’,6’-difluorophenyl)-pyridinato-N,C2’]-bis(µ-chloro)diiridium(III)). A modified version of the originally reported by Nonoyama was followed.74 IrCl3.3H2O (1
equiv.) and the CˆN ligand (2.2 equiv.) were dissolved in 2-ethoxyethanol and distilled water (3:1 v/v) to give a
concentration of ca. 0.2 M. The mixture was degassed by three
cycles of vacuum/ N2 and heated to reflux for 18 h. After 1 h. a
yellow precipitate was observed. The reaction was cooled to room temperature follow by addition of water to favor the
Accepted
precipitation of the dimer. The isolated solid was washed with a mixture of water and ethanol (1:1 v/v) and then a mixture of hexanes and diethyl ether (1:1 v/v), before drying to give the title
compound.
Tetrakis[2-(4’,6’-difluorophenyl)-pyridinato-N,C2’]-bis(µ-chloro)diiridium(III), [Ir(dFppy)2(µ-Cl)]2. Yield: 67%. 1H-
NMR (400 MHz, CDCl3) (ppm) δ 9.12 (d, J = 6.7 Hz, 1H), 8.31 (d,
J = 9.3 Hz, 1H), 7.87 – 7.78 (m, 1H), 6.83 (t, J = 7.2 Hz, 1H),
6.38 – 6.31 (m, 1H), 5.29 (d, J = 9.1 Hz, 1H). 19F-NMR (377 MHz,
CDCl3) (ppm) δ -107.72 (d, J = 10.3 Hz), -110.32 (d, J = 10.3
Hz). The characterisation matched with reported literature. 74
General procedure for the synthesis of [Ir(dFppy)2(L)]. To a
round bottom flask containing [Ir(dFppy)2(µ-Cl]2 (100 mg, 0.08
mmol) and the LH (LH= dbmH, tbmH, pydbmH and pytbmH)
(0.18 mmol, 2.2 equiv.) and NEt3 (0.18 mmol, 1 equiv.) were
added in a mixture DCM/MeOH (80:20 v/v) to give a suspension
with a concentration of ca. 0.02 M. The mixture was degassed
via bubbling with N2 for 10 min, before the reaction vessel was
sealed. The reaction mixture was heated to 40 0C for 19 h. The
solution was cooled to room temperature, and the solvent evaporated. The crude product was purified by silica gel chromatography in hexanes/DCM (70:30), giving in each case the pure compound as a yellow solid.
[Ir(dFppy)2(dbm)] (1). Yield: 90%. Rf = 0.43. M.p. 307-309 °C. 1H
NMR (500 MHz, DMSO-d6) δ 8.50 (dd, J = 6.0, 1.5 Hz, 2H), 8.26
(d, J = 8.5 Hz, 2H), 8.06 – 8.01 (m, 1H), 7.85 – 7.77 (m, 4H),
7.54 – 7.43 (m, 4H), 7.39 (t, J = 7.7 Hz, 4H), 6.76 (ddd, J = 12.2,
9.4, 2.4 Hz, 2H), 6.71 (s, 1H), 5.65 (dd, J = 8.7, 2.4 Hz, 2H). 19F
NMR (470 MHz, DMSO-d6) δ -108.88, -110.64 (d, J = 9.9 Hz).
The characterisation matched with reported literature.42
[Ir(dFppy)2(tbm)] (2). Yield: 40%. Rf = 0.67. M.p. 317-319 °C. 1H
NMR (500 MHz, CDCl3) δ 8.52 (d, J = 5.8 Hz, 2H), 8.26 (d, J =
8.3 Hz, 2H), 7.76 (m, J = 17.1, 8.2 Hz, 6H), 7.43 (t, J = 7.3 Hz,
2H), 7.33 (t, J = 7.6 Hz, 4H), 7.10 (t, J = 7.3 Hz, 2H), 6.59 (s,
1H), 6.39 (ddd, J = 11.7, 9.4, 2.4 Hz, 2H), 5.77 (dd, J = 8.8, 2.3
Hz, 2H). 19F NMR (471 MHz, CDCl3) δ 108.52 – 108.68 (m),
-110.69 – -110.88 (m). 13C NMR (126 MHz, CDCl3) δ 186.24,
148.06, 138.46, 129.44, 129.11, 127.71, 127.04, 77.28, 77.03,
76.77, 65.89. HR-MS (TOFMS+) [M+H]+: Calculated: 901.1668,
Found: 901.1673. Elemental analysis calcd (%) for C44H27O3N2Ir:
C, 58.73; H, 3.02; N, 3.11; found: C, 58.74; H, 3.12; N, 3.12.
[Ir(dFppy)2(pydbm)] (3). Yield: 90%. Rf = 0.25. M.p. 313-315 °C.
1H NMR (500 MHz, CDCl3) δ 8.72 (d, J = 4.3 Hz, 1H), 8.57 (t, J =
4.9 Hz, 2H), 8.29 (d, J = 8.2 Hz, 2H), 8.03 – 7.86 (m, 4H), 7.86 –
7.70 (m, 6H), 7.42 (dt, J = 51.5, 7.5 Hz, 3H), 7.14 (ddt, J = 7.5,
5.9, 1.6 Hz, 2H), 6.67 (s, 1H), 6.42 (ddt, J = 12.4, 9.3, 3.0 Hz,
2H), 5.80 (dt, J = 8.7, 2.9 Hz, 2H). 19F NMR (377 MHz, CDCl3) δ
-109.13 (dd, J = 9.9, 4.6 Hz), -111.33 (dd, J = 10.1, 3.2 Hz). 13C
NMR (126 MHz, Chloroform-d) δ 207.07, 179.39, 178.63, 165.28,
163.59, 161.69, 159.75, 156.64, 151.56, 149.85, 148.02, 140.95, 138.00, 130.60, 128.77, 127.33, 126.89, 122.52, 121.76, 120.69,
115.18, 97.25, 95.20. HR-MS (FTMS+) [M+H]+: Calculated:
874.1669, Found: 874.1664. Elemental analysis calcd (%) for
C42H26O2N3Ir: C, 57.59; H, 3.00; N, 4.81; found: C, 57.78; H,
2.91; N, 5.00.
X-Ray Crystallography
X-ray diffraction data for both complexes were collected at 173 K using a Rigaku FR-X Ultrahigh Brilliance Microfocus RA generator/confocal optics with XtaLAB P200 diffractometer [Mo Kα radiation (λ = 0.71075 Å)]. Intensity data were collected using ω steps accumulating area detector images spanning at least a hemisphere of reciprocal space. Data for all compounds analysed were collected and processed (including correction for
Lorentz, polarisation and absorption) using CrystalClear.75
Structures were solved by Patterson methods (PATTY)76 and
refined by full-matrix least-squares against F2
(SHELXL-2018/3).77 Non-hydrogen atoms were refined anisotropically, and
hydrogen atoms were refined using a riding model. All calculations were performed using the CrystalStructure
interface.78 Selected crystallographic data are presented in
Table S1. CCDC 1849982-1849983 contains the supplementary
crystallographic data for this paper. The data can be obtained free of charge from The Cambridge Crystallographic Data Centre via www.ccdc.cam.ac.uk/structures.
Acknowledgments
E.Z.-C. acknowledges the University of St. Andrews and EPSRC (EP/M02105X/1) for financial support. We thank Umicore AG for the gift of materials. We thank the EPSRC UK National Mass Spectrometry Facility at Swansea University for analytical services. This work is supported by a Royal Society International Exchanges Grant and by the Australian Research Council and. LAG thanks Curtin University for the postgraduate scholarship. This work used the computational resources of the CCIPL installed in Nantes.
Keywords: Iridium • AIE • β-triketonates •
1 J. P. Paris and W. W. Brandt, J. Am. Chem. Soc., 1959, 81, 5001–5002.
2 I. M. Dixon, J.-P. Collin, J.-P. Sauvage, L. Flamigni, S. Encinas and F. Barigelletti, Chem. Soc. Rev., 2000, 29, 385–391.
3 A. F. Henwood and E. Zysman-Colman, Chem. Commun., 2017, 53, 807–826.
4 J. A. Gareth Williams, S. Develay, D. L. Rochester and L. Murphy, Coord. Chem. Rev., 2008, 252, 2596–2611. 5 V. W.-W. Yam and K. M.-C. Wong, Chem. Commun., 2011,
47, 11579–11592.
6 C. K. Prier, D. A. Rankic and D. W. C. MacMillan, Chem. Rev., 2013, 113, 5322–5363.
7 R. D. Costa, E. Ortí, H. J. Bolink, F. Monti, G. Accorsi and N. Armaroli, Angew. Chemie - Int. Ed., 2012, 51, 8178– 8211.
8 D. Sykes and M. D. Ward, Chem. Commun. , 2011, 47, 2279–81.
9 J. R. Piper, L. Cletheroe, C. G. P. Taylor, A. J. Metherell, J. A. Weinstein, I. V. Sazanovich and M. D. Ward, Chem. Commun., 2017, 53, 408–411.
10 D. Sykes, A. J. Cankut, N. M. Ali, A. Stephenson, S. J. P.
Accepted
Spall, S. C. Parker, J. a Weinstein and M. D. Ward, Dalton Trans., 2014, 43, 6414–28.
11 H. Tsubaki, A. Sekine, Y. Ohashi, K. Koike, H. Takeda and O. Ishitani, J. Am. Chem. Soc., 2005, 127, 15544–15555. 12 J. H. Montoya, L. C. Seitz, P. Chakthranont, A. Vojvodic, T.
F. Jaramillo and J. K. Nørskov, Nat. Mater., 2016, 16, 70– 81.
13 J. J. Concepcion, J. W. Jurss, M. K. Brennaman, P. G. Hoertz, A. O. T. Patrocinio, N. Y. Murakami Iha, J. L. Templeton and T. J. Meyer, Acc. Chem. Res., 2009, 42, 1954–1965.
14 J. W. Tucker and C. R. J. Stephenson, J. Org. Chem., 2012,
77, 1617–1622.
15 G. Sahara, R. Abe, M. Higashi, T. Morikawa, K. Maeda, Y. Ueda and O. Ishitani, Chem. Commun., 2015, 51, 10722– 10725.
16 M. K. Nazeeruddin and M. Gratzel, Photofunctional Transition Metal Complexes, 2007, vol. 123.
17 A. J. Amoroso, M. P. Coogan, J. E. Dunne, V. Fernández-Moreira, J. B. Hess, A. J. Hayes, D. Lloyd, C. Millet, S. J. A. Pope and C. Williams, Chem. Commun., 2007, 29, 3066– 3068.
18 K. K. W. Lo, M. W. Louie and K. Y. Zhang, Coord. Chem. Rev., 2010, 254, 2603–2622.
19 C. Caporale, C. A. Bader, A. Sorvina, K. D. M. MaGee, B. W. Skelton, T. A. Gillam, P. J. Wright, P. Raiteri, S. Stagni, J. L. Morrison, S. E. Plush, D. A. Brooks and M. Massi,
Chem. - Eur. J., 2017, 23, 15666–15679.
20 V. Guerchais and J. L. Fillaut, Coord. Chem. Rev., 2011,
255, 2448–2457.
21 M. Keefe, K. D. Benkstein and J. T. Hupp, Coord. Chem. Rev., 2000, 205, 201–228.
22 J. Luo, Z. Xie, J. W. Y. Lam, L. Cheng, B. Z. Tang, H. Chen, C. Qiu, H. S. Kwok, X. Zhan, Y. Liu and D. Zhu, Chem. Commun., 2001, 381, 1740–1741.
23 R. Hu, N. L. C. Leung and B. Z. Tang, Chem. Soc. Rev., 2014, 43, 4494–4562.
24 Y. Hong, J. W. Y. Lam and B. Z. Tang, Chem. Soc. Rev., 2011, 40, 5361–5388.
25 J. Mei, N. L. C. Leung, R. T. K. Kwok, J. W. Y. Lam and B. Z. Tang, Chem. Rev., 2015, 115, 11718–11940.
26 Y. Liu, C. Deng, L. Tang, A. Qin, R. Hu, J. Z. Sun and B. Z. Tang, J. Am. Chem. Soc., 2011, 133, 660–663.
27 Y. Hong, J. W. Y. Lam and B. Z. Tang, Chem. Commun., 2009, 29, 4332–4353.
28 W. Lu, B. X. Mi, M. C. W. Chan, Z. Hui, C. M. Che, N. Zhu and S. T. Lee, J. Am. Chem. Soc., 2004, 126, 4958–4971. 29 Y. Sun, K. Ye, H. Zhang, J. Zhang, L. Zhao, B. Li, G. Yang,
B. Yang, Y. Wang, S. W. Lai and C. M. Che, Angew. Chemie - Int. Ed., 2006, 45, 5610–5613.
30 V. W. W. Yam, K. H. Y. Chan, K. M. C. Wong and B. W. K. Chu, Angew. Chemie - Int. Ed., 2006, 45, 6169–6173. 31 Q. Zhao, L. Li, F. Li, M. Yu, Z. Liu, T. Yi and C. Huang,
Chem. Commun., 2008, 3, 685–687.
32 B. H. Wu, M. J. Huang, C. C. Lai, C. H. Cheng and I. C. Chen, Inorg. Chem., 2018, 57, 4448–4455.
33 L. L. Wen, X. G. Hou, G. G. Shan, W. L. Song, S. R. Zhang, H. Z. Sun and Z. M. Su, J. Mater. Chem. C, 2017, 5, 10847–10854.
34 C. Climent, P. Alam, S. S. Pasha, G. Kaur, A. R.
Choudhury, I. R. Laskar, P. Alemany and D. Casanova, J. Mater. Chem. C, 2017, 5, 7784–7798.
35 P. Alam, S. Dash, C. Climent, G. Kaur, A. R. Choudhury, D. Casanova, P. Alemany, R. Chowdhury and I. R. Laskar,
RSC Adv., 2017, 7, 5642–5648.
36 G. Li, W. Guan, S. Du, D. Zhu, G. Shan, X. Zhu, L. Yan, Z. Su, M. R. Bryce and A. P. Monkman, Chem. Commun., 2015, 51, 16924–16927.
37 M. Mauro and C. Cebrián, Isr. J. Chem., 2018, 58, 901–914. 38 C. H. Shin, J. O. Huh, M. H. Lee and Y. Do, Dalton Trans.,
2009, 33, 6476–9.
39 Z. Song, R. Liu, Y. Li, H. Shi, J. Hu, X. Cai and H. Zhu, J. Mater. Chem. C, 2016, 4, 2553–2559.
40 P. Alam, G. Kaur, A. Sarmah, R. K. Roy, A. R. Choudhury and I. R. Laskar, Organometallics, 2015, 34, 4480–4490. 41 B. L. Reid, S. Stagni, J. M. Malicka, M. Cocchi, G. S. Hanan,
M. I. Ogden and M. Massi, Chem. Commun., 2014, 50, 11580–11582.
42 X. Gu, T. Fei, H. Zhang, H. Xu, B. Yang, Y. Ma and X. Liu,
Eur. J. Inorg. Chem., 2009, 16, 2407–2414.
43 L. Abad Galán, B. L. Reid, S. Stagni, A. N. Sobolev, B. W. Skelton, M. Cocchi, J. M. Malicka, E. Zysman-colman, E. G. Moore, M. I. Ogden and M. Massi, Inorg. Chem., 2017, 56, 8975–8985.
44 L. Abad Galán, A. N. Sobolev, B. W. Skelton, E. Zysman-colman, I. Mark and M. Massi, ChemRxiv., 2018, 10.26434/chemrxiv.6008294.v1.
45 S. Lamansky, P. Djurovich, D. Murphy, F. Abdel-Razzaq, H. E. Lee, C. Adachi, P. E. Burrows, S. R. Forrest and M. E. Thompson, J. Am. Chem. Soc., 2001, 123, 4304–4312. 46 S. Lamansky, P. Djurovich, D. Murphy, F. Abdel-Razzaq, R.
Kwong, I. Tsyba, M. Bortz, B. Mui, R. Bau and M. E. Thompson, Inorg. Chem., 2001, 40, 1704–1711.
47 A. P. Bassett, S. W. Magennis, P. B. Glover, D. J. Lewis, N. Spencer, S. Parsons, R. M. Williams, L. De Cola and Z. Pikramenou, J. Am. Chem. Soc., 2004, 126, 9413–9424. 48 V. V. Pavlishchuk and A. W. Addison, Inorg. Chim. Acta,
2000, 298, 97–102.
49 K. Dedeian, J. Shi, N. Shepherd, E. Forsythe and D. C. Morton, Inorg. Chem., 2005, 44, 4445–4447.
50 E. Baranoff, B. F. E. Curchod, J. Frey, R. Scopelliti, F. Kessler, I. Tavernelli, U. Rothlisberger, M. Grätzel and M. K. Nazeeruddin, Inorg. Chem., 2012, 51, 215–224.
51 M. A. Halcrow and G. Christou, Biomimetic Chemistry of Nickel, 1994, vol. 94.
52 R. T. Jonas and T. D. P. Stack, Inorg. Chem. , 1998, 37, 6615–6629.
53 Y. Wang, P. Bao, J. Wang, R. Jia, F. Bai and H. Zhang,
Inorg. Chem., 2018, 57, 6561–6570.
54 A. Marini, A. Mun, A. Biancardi and B. Mennucci, J. Phys. Chem. B, 2010, 114, 17128–17135.
55 J. M. Fernández-Hernández, J. I. Beltrán, V. Lemaur, M. D. Gálvez-López, C. H. Chien, F. Polo, E. Orselli, R. Fröhlich, J. Cornil and L. De Cola, Inorg. Chem., 2013, 52, 1812– 1824.
56 A. Onder, M. Turkyilmaz and Y. Baran, Inorg. Chim. Acta, 2012, 391, 28–35.
57 M. A. Chagas and W. R. Rocha, Chem. Phys. Lett., 2014,
612, 78–83.
58 J. Jayabharathi, V. Thanikachalam, N. Srinivasan and M. V. Perumal, J. Fluoresc., 2011, 21, 1585–1597.
59 S. Fantacci, F. De Angelis and A. Selloni, J. Am. Chem. Soc., 2003, 125, 4381–4387.
60 D. Chen, K. Li, X. Guan, G. Cheng, C. Yang and C. M. Che,
Organometallics, 2017, 36, 1331–1344.
61 K. Suzuki, A. Kobayashi, S. Kaneko, K. Takehira, T. Yoshihara, H. Ishida, Y. Shiina, S. Oishi and S. Tobita,
Phys. Chem. Chem. Phys., 2009, 11, 9850.
62 A. J. Howarth, R. Patia, D. L. Davies, F. Lelj, M. O. Wolf and K. Singh, Eur. J. Inorg. Chem., 2014, 3657–3664. 63 Y. Jiang, G. Li, W. Che, Y. Liu, B. Xu, G. Shan, D. Zhu, Z.
Su and M. R. Bryce, Chem. Commun., 2017, 53, 3022– 3025.
64 Q. Lu, X. Li, J. Li, Z. Yang, B. Xu, Z. Chi, J. Xu and Y. Zhang, J. Mater. Chem. C, 2015, 3, 1225–1234. 65 G. a. Crosby and J. N. Demas, J. Phys. Chem., 1971, 75,
991–1024.
66 J. C. De Mello, H. F. Wittmann and R. H. Friend, Adv. Mater., 1997, 9, 230–232.
67 M. J. Frisch, G. W. Trucks, H. B. Schlegel, G. E. Scuseria,
Accepted
M. A. Robb, J. R. Cheeseman, G. Scalmani, V. Barone, G. A. Petersson, H. Nakatsuji, X. Li, M. Caricato, A. V. Marenich, J. Bloino, B. G. Janesko, R. Gomperts, B. Mennucci and J. B. Hratch, 2016.
68 Y. Zhao and D. G. Truhlar, Theor. Chem. Acc., 2008, 120, 215–241.
69 D. Jacquemin, E. A. Perpète, I. Ciofini, C. Adamo, R. Valero, Y. Zhao and D. G. Truhlar, J. Chem. Theory Comput., 2010, 6, 2071–2085.
70 D. Jacquemin, C. Adamo and B. Mennucci, J. Chem. Theory Comput., 2012, 8, 2359–2372.
71 J. Tomasi, B. Mennucci and R. Cammi, Chem. Rev., 2005,
105, 2999–3093.
72 Z. He, X. Qi, Z. She, Y. Zhao, S. Li, J. Tang, G. Gao, Y. Lan and J. You, J. Org. Chem., 2017, 82, 1403–1411.
73 C. H. Chang, Z. J. Wu, C. H. Chiu, Y. H. Liang, Y. S. Tsai, J. L. Liao, Y. Chi, H. Y. Hsieh, T. Y. Kuo, G. H. Lee, H. A. Pan, P. T. Chou, J. S. Lin and M. R. Tseng, ACS Appl. Mater. Interfaces, 2013, 5, 7341–7351.
74 M. Nonoyama, Bull. Chem. Soc. Jpn., 1974, 47, 767–768. 75 2015.
76 P. T. Beurskens, G. Beurskens, R. de Gelder, S. Garcia-Granda, R. Israel and J. M. Smits, M.DIRDIF-99, The DIRDIF99 Program System, Technical Report of the University of Nijmegen, The Netherlands, 1999. 77 G. M. Sheldrick, Acta Crystallogr. Sect. C Struct. Chem.,
2015, 71, 3–8. 78 2018.
Accepted
FULL PAPER
The structural and photophysical
properties of neutral Ir(III)
complexes using modified β
-diketonates as ancillary ligands have been investigated, resulting in significantly modulated aggregation induced emission properties.
Key Topic*
AIE properties
Page No. – Page No.
Analyzing the Relation Between Structure and Aggregation Induced Emission (AIE) Properties of Iridium(III) Complexes through Modification of Non-Chromophoric Ancillary Ligands
![Figure 5. Representation of the X-ray crystal structure of [Ir(dFppy)2(pydbm)] (3), emphasising the supramolecular composition formed by π-π stacking interactions](https://thumb-us.123doks.com/thumbv2/123dok_us/8555456.364044/4.595.52.286.595.686/figure-representation-structure-emphasising-supramolecular-composition-stacking-interactions.webp)