ADHERENCE IN BEHAVIOURAL INTERVENTIONS FOR
STROKE PATIENTS:
MEASUREMENT AND PREDICTION
Sara A. Joice
A Thesis Submitted for the Degree of PhD at the
University of St Andrews
2005
Full metadata for this item is available in Research@StAndrews:FullText
at:
http://research-repository.st-andrews.ac.uk/
Please use this identifier to cite or link to this item: http://hdl.handle.net/10023/7262
This item is protected by original copyright
Adherence In Behavioural Interventions For Stroke Patients:
Measurement And Prediction
Sara A. Joice
Submitted for the degree of Doctor of Philosophy
University of St Andrews
ABSTRACT
ADHERENCE IN BEHAVIOURAL INTERVENTIONS FOR STROKE PATIENTS: MEASUREMENT AND PREDICTION
Background:With the increasing incidence in stroke and the resultant high prevalence of residual disability resources are not adequately meeting the needs of the patients.
Furthermore patients continue to express dissatisfaction with their care. New
interventions are being developed and evaluated. However, when offered these new
interventions, patients may refuse or not participate fully. A stroke workbook intervention
was developed through a line of research examining the role of perceived control in
recovery. During the randomised controlled trial (RCT) evaluating its efficacy patients
failed to fully participate in the activities proposed in the workbook. Why, when there is
such a dearth of treatment available, do stroke patients not fully participate in or adhere to
the interventions offered?
Methods:Three studies were conducted, a predictive study using the intervention group of the RCT exploring the demographic, clinical and psychological factors predicting
adherence; a predictive study using one of the intervention groups from a larger 2x2 RCT
to examine the predictors of adherence to an easier intervention (video); and a third
longitudinal study examining the efficacy of an even simpler intervention (letter) on
increasing adherence to the video. The theoretical framework of Leventhal’s Self
Regulation Model was used to develop the letter intervention and to explain the findings.
easier intervention promoted adherence especially for men and the more impaired.
Women appeared to adhere more readily to the complex intervention. These gender
differences may be associated with illness representations. A theoretical-based letter does
not increase adherenceper sebut may increase the amount of adherence to an easier
intervention.
Conclusion:Adherence behaviour is not one type of behaviour and is associated with measurement difficulties. The Self-Regulation model appeared to offer some logical
explanations to the findings. The findings have clinical implications and could possibly be
CONTENTS
ABSTRACT iii
LIST OF FIGURES ix
LIST OF TABLES x
ACKNOWLEDGEMENTS xv
OVERVIEW xvii
CHAPTER 1
WHY, WHEN STROKE PATIENTS CONTINUE TO EXPRESS DISSATISFACTION WITH THE CARE THEY RECEIVE, DO THEY
FAIL TO PARTICIPATE IN AN INTERVENTION WHEN IT IS OFFERED?
SUMMARY 1
INTRODUCTION 2
DEFINITION OF STROKE 2
EPIDEMIOLOGICAL PERSPECTIVE 3
INDIVIDUAL PERSPECTIVE 4
A SYSTEMATIC REVIEW 9
Background 9
Methods 9
Results 9
Discussion 22
THE STROKE WORKBOOK INTERVENTION STUDY – SWOT 26
Preliminary study 1: 29
Preliminary study 2 30
THE PRESENT THESIS 31
CHAPTER 2
DEFINING PATIENTS BEHAVIOUR AND EXPLAINING IT WITHIN THE CONCEPTUAL FRAMEWORK OF THE SELF-REGULATION
MODEL
SUMMARY 32
DEFINING PATIENT’S BEHAVIOUR 33
Compliance, Adherence and Concordance 33
THE SELF-REGULATION MODEL 38
ADHERENCE – what are we measuring? 48
APPLYING THE TERMS AND THEORY TO THE BEHAVIOUR IN SWOT
51
CHAPTER 3
WHAT DEMOGRAPHIC, CLINICAL AND PSYCHOLOGICAL FACTORS PREDICT PARTICIPATION AND ADHERENCE IN A
STROKE WORKBOOK INTERVENTION?
SUMMARY 54
BACKGROUND 56
RESEARCH QUESTIONS 60
DESIGN 61
MATERIALS 61
MEASURES 62
Predictor Variables 62
Dependent Variables 65
PROCEDURE 66
STATISTICAL ANALYSIS 67
RESULTS 68
PARTICIPANTS 69
DEVELOPING ADHERENCE MEASURES 70
Descriptive Statistics 72
RESEARCH QUESTION 1 73
Participators versus Non-Participators 73
Predictors of Participation 75
RESEARCH QUESTION 2 77
Active Adherence versus Non-Active 77
Predictors of Active Adherence 79
Passive Adherers versus Non-Passive 80
Predictors of Passive Adherence 82
Active Adherers versus Non-Adherers 83
Predictors of Active Adherence 85
Predictors of The Amount of Active Adherence 86
POST-HOC QUESTION 87
DISCUSSION 89
CONCLUSION 94
CHAPTER 4
AN EASIER INTERVENTION: DOES IT INCREASE ADHERENCE?
SUMMARY 95
BACKGROUND 97
RESEARCH QUESTIONS 102
DESIGN 102
RECRUITMENT PROCEDURE 103
MATERIALS 105
MEASURES 106
Predictor Variables 106
PROCEDURE 110
RANDOMIZATION AND BLINDING 111
STATISTICAL ANALYSIS 113
RESULTS 114
PARTICIPANTS 114
DEVELOPING ADHERENCE MEASURES 116
Descriptive Statistics 118
RESEARCH QUESTION 1 120
RESEARCH QUESTION 1a 124
Low Impairment and Adherence 124
High Impairment and Adherence 125
RESEARCH QUESTION 2 127
RESEARCH QUESTION 3 131
Predictors of Intervention Active Adherence 138
DISCUSSION 141
Methodological Limitations 149
CONCLUSION 150
CHAPTER 5
A SIMPLE THEORETICALLY DESIGNED LETTER FROM HEALTH PROFESSIONALS: CAN IT INFLUENCE ADHERENCE TO AN EASIER INTERVENTION, ILLNESS REPRESENTATIONS
AND OUTCOME?
SUMMARY 151
BACKGROUND 153
RESEARCH QUESTIONS 158
DESIGN 159
PARTICIPANTS 159
MATERIALS 162
MEASURES 163
Predictor Variables 163
Dependent Variables 164
PROCEDURE 165
RANDOMIZATION AND BLINDING 167
RESULTS 169
Scoring the IPQ-R 169
DEVELOPING ADHERENCE MEASURES - to the letter intervention 173
Descriptive Statistics 174
Implications of Reading or Not Reading the Letter 179
RESEARCH QUESTION 1 183
RESEARCH QUESTION 2 185
Effects of Exposure to Interventions on Illness Representations 191
POST-HOC QUESTION 5.1 193
POST-HOC QUESTION 5.2 194
POST-HOC QUESTION 5.3 198
POST-HOC QUESTION 5.4 201
DISCUSSION 202
Descriptive Baseline Data 202
Implications of Low Rate of Letter Adherence 202
Does a Personalised Theoretical Letter, Influence How Patients Adhere to a Video Intervention?
205
Do the Letter and Video Influence the Patient’s Illness Representations?
206
Do the Letter and Video Influence Patient’s Outcomes in Terms of Disability and Mood?
208
Limitations of Study 208
Future Research 210
CONCLUSION 211
CHAPTER 6
AIMS, FINDINGS, EVIDENCE AND IMPLICATIONS
SUMMARY 213
INTRODUCTION 215
WHAT DEMOGRAPHIC, CLINICAL AND PSYCHOLOGICAL FACTORS PREDICT PARTICIPATION AND ADHERENCE IN A STROKE WORKBOOK INTERVENTION?
219
AN EASIER INTERVENTION: DOES IT INCREASE ADHERENCE? 230 A SIMPLE THEORETICALLY DESIGNED LETTER FROM HEALTH
PROFESSIONALS: CAN IT INFLUENCE ADHERENCE TO AN EASIER INTERVENTION, ILLNESS REPRESENTATIONS AND OUTCOME?
233
Limitations of Studies 237
Future Research 241
CONCLUSION 242
REFERENCES 244
APPENDICES
Appendix A 256
Appendix B 258
Appendix C 276
Appendix D Appendix E
Figure Number
List of Figures Page
CHAPTER 1
Figure 1.1: International Classification of Impairments, Disabilities and Handicaps (ICDH-2; WHO, 1998)
6
CHAPTER 2
Figure 2.1: The Parallel Process Model (Leventhal 2003) 40
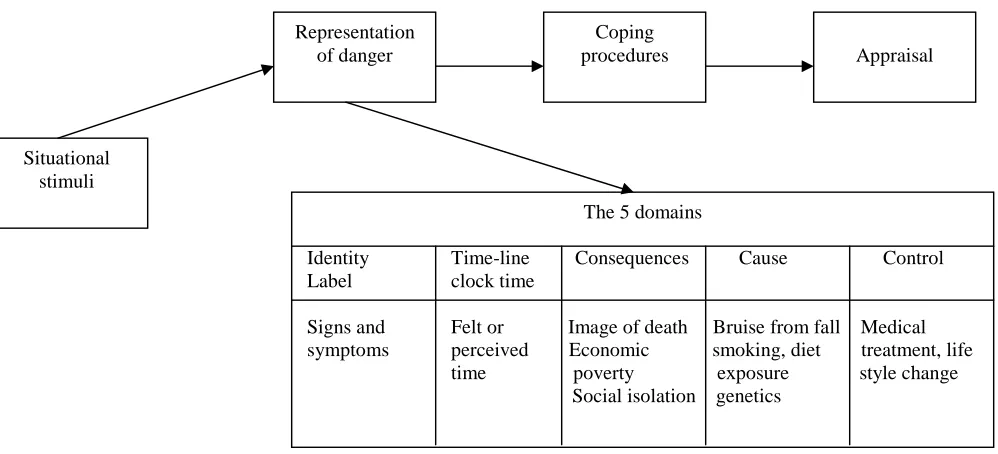
Figure 2.2: Five Substantive Domains of Illness Representation. (Brownlee et al 2000)
43
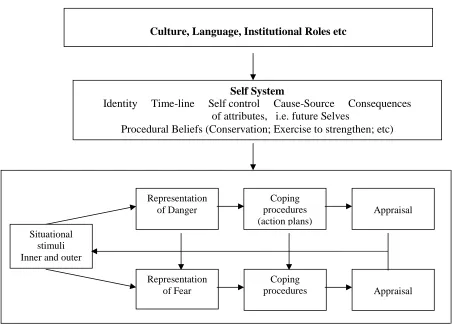
Figure 2.3: Common Sense Model (of Self-Regulation), Leventhal et al (1984, 1992, 1997 2000 and 2004)
47
CHAPTER 3
Figure 3.1: Non-Adherent and Active Adherent Patients with High and Low Impairment
87
CHAPTER 4
Figure 4.1: Differences between Non-Active Adherence and Intervention Active Adherence in Patients with High Impairment
126
Figure 4.2: Differences in Adherence between Intervention and Gender 132 Figure 4.3: Differences in Mean Barthel Index Scores between the
Genders and Intervention
136
Figure 4.4: Differences in Mean Active Behavioural Coping Scores Between the Genders and Intervention
136
Figure 4.5: Differences in Mean Problem Focused Coping Scores Between the Genders and Intervention
137
Figure 4.6: Differences in Mean Desire for the Intervention between the Genders and Intervention
138
CHAPTER 5
Figure 5.1: Patient Recruitment for FAST Study 160
Figure 5.2: Numbers of Patients in each Condition at T1 and T2 and Reasons for Non-Participation in the Trial
161
Figure 5.3: Patients Response to Question Asking if They Had Received or Read the Letter
173
Figure 5.4: Mean Score for Time Line-Chronic (IPQ-R) for Each Group 177 Figure 5.5: Mean Score on Cause: Controllable Personal Risk (IPQ-R) for
Each Group
178
Figure 5.6: Mean Score on Personal Control Scale of the IPQ-R 190 Figure 5.7: Mean Score on Cause Controllable Personal Risk Scale of the
IPQ-R
190
Figure 5.8: Mean Score on Time-Line Cyclic Scale of the IPQ-R 195 Figure 5.9: Mean Score on Consequence Scale of the IPQ-R 196 Figure 5.10: Mean Score on Cause Controllable Personal Risk Scale of the
IPQ-R
Table number
List of Tables Page
CHAPTER 1
Table 1.1: Summary of Citations from the Literature Review 10 Table: 1.2a: RCTS Examining Environments in Which Stroke Patients Were
Cared For
11
Table: 1.2b: RCTs Examining Environments in Which Stroke Patients Were Cared For
12
Table 1.3: RCTs Testing the Effectiveness of Specific Therapies in Stroke Patients
17
Table 1.4: RCT Testing the Effectiveness of Social Support Interventions 20 Table 1.5: RCTs Testing the Effectiveness of Giving Information to Stroke
Patients
21
CHAPTER 3
Table 3.1: The Study Group; Gender and Ages 61
Table 3.2: Patient Participation Groups; Gender and Numbers 69 Table 3.3: Participators Group with Intact Data Sets; gender; numbers and
ages
70
Table 3.4: Principle Components Analysis of Behavioural Activities; range of scores, mean, standard deviation Cronbach’s alphas and component loadings
71
Table 3.5: Demographic, Clinical, Psychological and Dependent Variables; number of responses, classification, means, standard deviations and Cronbach’s alphas
72
Table 3.6: Demographic Differences between Participators and Non-Participators;2& t-test results
73
Table 3.7: Clinical Differences between Participators and Non-Participators; 2
& t-test results
74
Table 3.8 Psychological Differences between Participators And Non-Participators; t-test results
74
Table 3.9: Logistic Regression Analyses Of Participation Predictor Variables 75 Table 3.10: Demographic Differences Between Active Adherers and
Non-Active;2and t-test results
77
Table 3.11: Clinical Differences between Active Adherers and Non-Active;2 and t-test results
78
Table 3.12: Psychological Differences between Active Adherers and Non-Active; t-test results
79
Table 3.13: Logistic Regression Analysis of Active Adherence Predictor Variables
80
Table 3.14: Demographic Differences between Passive Adherers and Non-Passive;2& t-test results
81
Table 3.15: Clinical Differences between Passive Adherers and Non-Passive; 2
and t-test results
Table 3.16: Psychological Differences between Passive Adherers and Non-Passive; t-test results
82
Table 3.17: Logistic Regression Analysis of Passive Adherence Predictor Variables
83
Table 3.18: Demographic Differences between Active Adherers and Non-Adherers;2& t-test results
83
Table 3.19: Clinical Differences between Active Adherers and Non-Adherers; 2
& t-test results
84
Table 3.20: Psychological Differences between Active Adherers and Non-Adherers; t-test results
84
Table 3.21: Logistic Regression Analysis of Active Adherence Predictor Variables
85
Table 3.22: Correlations between Amount of Active Adherence and Predictor Variables (probabilities less than or equal to .2)
86
Table 3.23: Multiple Regression Analysis between Predictor Variables with Probabilities of .20 and Amount of Active Adherence Predictor Variables
86
Table 3.24: Multiple Regression Analysis Summary Model of Amount of Active Adherence
87
Table 3.25: Numbers of Patients in Adherence Categories for Workbook 87 Table 3.26: Differences between Non-Adherent and Active Adherent Patients:
2
result
88
CHAPTER 4
Table 4.1: Patients Randomly Allocated to the Video Study Group; gender numbers and ages
103
Table 4.2: Recruitment Method; number and percentage of patients 110 Table 4.3: Effectiveness of the Blinding Procedure on the Principle Researcher 112 Table 4.4: Not Watching Videos; reasons for not watching and patient numbers 115 Table 4.5: Patient Adherence Groups; numbers and gender 115 Table 4.6: Correlations between Measures of Adherence to Video Activities 117 Table 4.7: Principle Components Analysis of Adherence Measures; range of
scores, mean, standard deviation Cronbach’s alphas and component loadings
117
Table 4.8: Demographic, Clinical and Psychological Dependent Variables; response numbers, classification, means, standard deviations and Cronbach’s alpha results
118
Table 4.9: IPQ-R Scores, means, standard deviations and Cronbach’s alpha results
119
Table 4.10: Numbers of Patients in Adherence Categories for Workbook and Video Interventions
120
Table 4.11: Differences between Non-Participant and Participant Patients;2 result
120
Table 4.12: Differences between Non-Adherence and Intervention Adherence (passive, active and video watchers);2results
Table 4.13: Differences between Non-Active Adherence (including passive adherence) and Intervention Active Adherence:2results
121
Table 4.14: Activities in the Interventions and Maximum Scores 122
Table 4.15: Differences in Mean Percentage Adherence between the Video and Stroke Workbook (Active) Adherence; t-test results
122
Table 4.16: Video and Active Adherence Scores Categorised into None, Some and Most Activities Completed
123
Table 4.17: Differences in Mean Adherence Scores between the Video and Stroke Workbook (Active) Adherence; t-test results
123
Table 4.18: Low and High Impairment Groupings; distribution of patient numbers
124
Table 4.19: Differences between Non-Adherence and Intervention Adherence in Patients with Low Impairment:2results
124
Table 4.20: Differences between Non-Active Adherent and Intervention Active Adherence in Patients with Low Impairment:2result
125
Table 4.21 Differences between Non-Adherence and Intervention Adherence in Patients with High Impairment:2results
125
Table 4.22: Differences between Non-Active Adherence and Intervention Active Adherence in Patients with High Impairment:2results
126
Table 4.23: Demographic Differences between Video Adherers and Non-Adherers;2& t-test results
127
Table 4.24: Clinical Differences between Video Adherers and Video Non-Adherers;2& t-test results
127
Table 4.25: Psychological Differences between Video Adherers and Video Non-Adherers; t-test results
128
Table: 4.26: Logistic Regression Analysis of Video Adherence Predictor Variables with Probabilities of .20
129
Table 4.27: A Summary of the Predictors of Adherence to a Complex and Easy Intervention
131
Table 4.28: Distribution of Male and Females in the 4 Groups 131 Table 4.29: Difference in Adherence between Intervention and Gender:2
results
132
Table 4.30a: Demographic, Clinical and Psychological Differences between Genders and Interventions: ANOVA results
133
Table 4.30 b: Psychological Differences between Genders and Interventions: ANOVA results
134
Table 4.30c: Demographic and Clinical Differences between Genders and Interventions:2results
135
Table 4.31: 2Analysis of Presence of a Carer between Gender and Intervention
135
Table 4.32 Logistic Regression Analyses of Intervention Active Adherence Variables
CHAPTER 5
Table 5:1. The FAST Study; Numbers, gender and age per group 161 Table 5.2: Recruitment Method: number and percentage of patients 165 Table 5.3: Effectiveness of the Blinding Procedure on the Researcher 167 Table 5.4: Principal Component Analysis with Varimax Rotation of the
“Cause” Items from the IPQ-R (7 components).
170
Table 5.5: Principal Component Analysis with Varimax Rotation of the “Cause” Items from the IPQ-R Forced into a Four-Component Solution
171
Table 5.6: Demographic and clinical variables; number of responses;
classification, means, standard deviations and Cronbach’s alphas.
174
Table 5.7: Differences between the Four Groups History of Previous Stroke:
2
results
174
Table 5.8: Differences between Those Who Did and Did Not Receive the Video and History of Previous Stroke:2
results
175
Table 5.9: Differences between Those Who Did and Did Not Receive the Letter and History of Previous Stroke:2
results
175
Table 5.10: Psychological Variables: classification, Cronbach’s alphas, mean scores, and standard deviations taken at T1
176
Table 5.11: ANOVA Output for Time-Line Chronic and Cause –Controllable Perceived Risk
177
Table 5.12: Patients Who had First or Previous Stroke and their Perception of Time Line Chronicity and Cause Controllable Personal Risk; t-test results
178
Table 5.13: Demographic Differences between Letter Readers and Non-Readers:2& t-test results.
179
Table 5.14: Clinical Differences between Letter Readers and Non-Readers:2 & t-test results
180
Table 5.15: Chi2Analysis Contingency Table for Analysis of Left and Right Sided Weakness and Adhering to the Letter or Not
180
Table 5.16: Psychological Differences between Letter Readers and Non-Readers: t-test results
181
Table: 5.17: Logistic Regression Analysis of Letter Adherence Predictor Variables with Probabilities of .20
182
Table: 5.18: Effect of Receiving the Theoretical Letter on Video Adherence:2 results
183
Table 5.19: Effect of Reading the Theoretical Letter on Video Adherence:2 results
183
Table 5.20: Effect of Reading the Theoretical Letter on Video Adherence Including the Video Only Group:2results
184
Table 5.21: Video Adherence Score; Differences between Readers and Non-Readers: t-test result
184
Table 5.22a: Difference in Mean Score of Illness Representations in the Four Groups: ANOVA results
186
Table 5.22b: Difference in Mean Score of Illness Representations in the Four Groups: ANOVA results
Table 5.22c: Difference in Mean Score of Ways of Coping in the Four Groups: ANOVA results
188
Table 5.22d: Difference in Mean Score of RLOC and Confidence in Recovery in the Four Groups: ANOVA results
189
Table 5.23: Patients Exposed or Not Exposed to an Intervention; intervention groups and numbers
191
Table 5.24: Differences between Intervention Exposure and Affected Side:2 results
192
Table 5.25: Differences in Impairment between Those With Left and Right Sided Weakness: t-test results
192
Table 5.26: Differences in Illness Representations between Those Who Were Exposed to an Intervention and Those Who Were Not (T2); t-test results
194
Table 5.27: Repeated Measures ANOVA of Timeline Cyclic of Patients Exposed or Not Exposed to an Intervention
195
Table 5.28: Differences in Timeline Cyclic Mean Scores between T1 and T2 In Those Who Were Exposed or Not Exposed to an Intervention; t-test results
196
Table 5.29: Repeated Measures ANOVA of Consequence of Patients Exposed or Not Exposed to an Intervention
197
Table 5.30: Repeated Measures ANOVA of Cause; Controllable Personal Risk of Patients Exposed or Not Exposed to an Intervention
198
Table 5.31: Differences between Gender and Intervention Exposure:2results 198 Table 5.32: Difference in Mean Score of Disability and Mood in the Four
Groups; ANOVA results
200
Table 5.33: Differences in Disability and Mood between Those Who Were Exposed to an Intervention and Those Who Were Not (T2); t-test results
201
CHAPTER 6
Table 6.1a: Summary of Results of Study 1 216
Table 6.1b: Summary of Results of Study 2 217
For my Dad
October 1927 – June 2004
Acknowledgements
Where to start….
My thanks go to Marie Johnston with out whom I would never have got this far and to
Derek Johnston who made coffee possible for Marie and I when we needed
sustenance.
Thank you too, to all the patients who took part in the studies; quite frankly you made
my data collection easy, interesting and enjoyable.
I would like to give a special thanks to Debbie Bonetti who kept me grounded, sane
and heartened.
Academically thanks go to Diane Dixon (DD), Beth Pollard (BP) Jo Hart,
Marie-Carmen Lopez and Val Morrison who made the FAST (and SWOT) studies possible.
All the doctors, secretaries and nurses at Ninewells who helped me along the way;
especially Mary Falconer who taught me to swear at the computer and Ron
MacWalter who supported me throughout with a smile and a twinkle in his eye!
I thank Karen Lammie for her design of the perfect character illustrations for the
stroke workbook and her gentle encouragement to do my PhD.
On the home front I would like to thank Mary McNeil, Mel Wood, Roz Doig and
Gillian Macfarlane, Chloe, Lottie and Holly for caring and keeping Polly amused.
Personally I would like to say thank you to Gwen for keeping me organised, to Mum
for all the timed phone calls and a big thanks to Paul and Polly for being….Paul and
OVERVIEW
CHAPTER 1: WHY, WHEN STROKE PATIENTS CONTINUE TO EXPRESS
DISSATISFACTION WITH THE CARE THEY RECEIVE DO THEY FAIL TO
PARTICIPATE IN AN INTERVENTION WHEN IT IS OFFERED?
This chapter presents the background to the proposed studies. It presents the
epidemiological and individual problems of stroke and evidence of the lack of
satisfaction with stroke care. A literature review demonstrates the nature of
interventions examined to improve stroke outcomes and discusses their effectiveness.
The chapter then goes on to introduce a health psychology perspective of recovery
from disability, the stroke workbook study (SWOT) examining the role of perceived
control and the non-adherence behaviour to which prompted the central question to
this thesis.
CHAPTER 2: DEFINING PATIENT’S BEHAVIOUR AND EXPLAINING IT
WITHIN THE CONCEPTUAL FRAMEWORK OF THE SELF-REGULATION
MODEL
This chapter describes the concepts of adherence, compliance and concordance and
defines the behaviours observed in the SWOT study. It highlights the complexity of
the behaviours and the difficulties of measurement. From there the chapter goes onto
describe the theoretical framework of Leventhal’s Self-Regulation Model (SRM) used
in the proposed studies, its development and its applications to adherence behaviours.
CHAPTER 3: WHAT DEMOGRAPHIC, CLINICAL AND PSYCHOLOGICAL
FACTORS PREDICT PARTICIPATION AND ADHERENCE IN A STROKE
WORKBOOK INTERVENTION?
This chapter describes an experimental study where the intervention group from the
passive; b) the demographic, clinical and psychological predictors of these
behaviours; c) the application of the SRM to explaining the findings.
CHAPTER 4: AN EASIER INTERVENTION: DOES IT INCREASE
ADHERENCE?
This chapter describes an experimental study, examining adherence to an easier
intervention a) by developing measures of adherence to an easier intervention, a
stroke video; b) comparing the adherence to an easier intervention with a complex
intervention – the stroke workbook and; c) examining the predictors of adherence to
an easier intervention.
CHAPTER 5: A SIMPLE THEORETICALLY DESIGNED LETTER FROM
HEALTH PROFESSIONALS: CAN IT INFLUENCE ADHERENCE TO AN
EASIER INTERVENTION, ILLNESS REPRESENTATIONS AND OUTCOME?
This chapter describes a 2x2 trial evaluating two simple interventions, a video and a
theoretically derived letter including the letter development. It examines; a) the effects
of the letter on video adherence; b) the measure of letter adherence; and c) the effects
of either intervention on illness representations, disability and mood.
CHAPTER 6: AIMS, FINDINGS, EVIDENCE AND IMPLICATIONS
This chapter recaps the aims of the thesis, the main findings and the evidence, which
supports them. The theoretical, methodological and clinical implications are
CHAPTER 1
WHY, WHEN STROKE PATIENTS CONTINUE TO EXPRESS DISSATISFACTION WITH THE CARE THEY RECEIVE, DO THEY FAIL TO PARTICIPATE IN AN
INTERVENTION WHEN IT IS OFFERED?
SUMMARY
This introductory chapter gives the general background to this thesis examining stroke patient’s
non-participation in and non-adherence to a specially designed intervention aimed to promote
perceived control to reduce disability.
The opening section of this chapter defines stroke and describes it from an epidemiological
perspective to emphasise the incidence and the increasing prevalence of the potential residual
disability. From here, stroke is described in terms of a medical condition, its consequences and
recovery, introducing the idea that recovery from stroke determined disability not only involves
physiological but individual psychological and environmental factors.
A literature review of randomised controlled trials testing interventions designed to reduce
disability from stroke in terms of functional ability and psychological factors such as mood and
satisfaction are discussed to provide a background to a randomised controlled trial (RCT) testing
a stroke workbook intervention. This intervention aimed to increase the psychological cognition
of perceived control in stroke patients in order to reduce disability and to improve mood and
satisfaction outcomes. It was in this study that non-participation and non-adherence behaviours
were observed and promoted the overall question to the present thesis. The final section of the
chapter describes the stroke workbook study and outlines the research questions that will be
addressed in the rest of this thesis to answer the central question; why when patients continue to
express dissatisfaction with the care that they receive do they fail to participate in an effective
INTRODUCTION
DEFINITION OF STROKE
“A stroke can be broadly defined as a cerebrovascular event (either ischaemic or haemorrhagic)
with neurological deficit persisting beyond 24 hours”.
MacWalter and Shirley (2002)
A stroke is a medical condition affecting the brain. The brain is supplied with oxygen and
nutrients by a network of blood vessels. If this blood supply is restricted or cut off, the area of
nerve cells, which the blood vessels supply, will be deprived of oxygen and nutrients resulting in
tissue damage. Irreversible brain damage is caused within 5-7 minutes, resulting in loss of or
reduced function in the part of the body corresponding to the area of brain that has been damaged
(Ironside 1996). Similar to a heart attack, the blood vessels in the brain can become occluded by
a thrombosis or an embolism. This type of stroke is referred to as a cerebral infarction or
ischaemic stroke and accounts for 70 – 80% of strokes. Alternatively a blood vessel can rupture
to cause a bleed into the brain tissue, again damaging a specific area; this is referred to as a
cerebral haemorrhage or haemorrhagic stroke and accounts for approximately 20 – 30% of
strokes. A subarachnoid haemorrhage is where a ruptured blood vessel bleeds into the
subarachnoid space (between the brain and the skull) but not into the brain tissue itself. A
subarachnoid haemorrhage is not traditionally classified as a stroke as the risk factors, onset, age
group and treatment appear to be different to that of thrombotic and haemorrhagic strokes.
However a subarachnoid haemorrhage is classified as cerebrovascular disease and therefore is
included in some of the mortality statistics in the U.K. accounting for approximately 10% of
cerebro-vascular disease, having an average annual incidence of 6 per 100,000 of the population
(Clarke 1998). In the empirical work for this thesis subarachnoid haemorrhage is not to be
included but the reader needs to be aware that subarachnoid haemorrhage may be included in
some of the health statistics quoted in the following sections.
The physical manifestation of a stroke will depend on the area of the brain affected. Generally
speaking if the damage is caused in the left hemisphere of the brain, the right side of the body
will be affected and vice versa. The effects will correspond to the specific area of the brain that
has been damaged and the extent of that damage. For example if the nerve cells are damaged due
to an occlusion of the right branch of the middle cerebral artery in the internal capsule of the
brain, the patient is likely to clinically present with left limb weakness or hemiplegia. The onset
“Initially the affected limbs appear flaccid but after a variable period of time the reflexes recover
and the weakness recovers gradually over days, weeks, months or even years”. (Clarke 1998).
Clinically stroke patients can therefore experience anything from a minor disability such as
minimal facial weakness to a major disability of having complete one-sided paralysis. However
what may be considered minor to one person may be major to another, which can also be said of
the psychological consequences of stroke, which will be discussed later in this chapter. Stroke
has implications not only epidemiologically but for the individual as well.
EPIDEMIOLOGICAL PERSPECTIVE
Incidence of Stroke
Stroke is a medical condition of the brain and is the third commonest cause of death in the
Western World. It is estimated that around 1 million ischaemic strokes occur in Europe each year
causing nearly 400,000 people to die (Giroud et al 2002). The death rates from cerebrovascular
disease for England and Scotland for the year 2001 were 483 deaths per 100,000 population (ISD
Scotland 2003). Stroke is a condition associated with age and the incidence of stroke rises as the
population ages (Wolfe et al 2001). The Registrar’s General Office (RGO 2003) states that the
number of people aged 75 and over has increased by 29% from 1981. They also estimate that this
figure will rise significantly in 30 years time as a result of the 1960s baby boom. “Health in
Scotland” (1999), a government paper noted that 75% of people who have a stroke will be aged
65 years and over. These Scottish trends suggest that the incidence of stroke will increase in
future decades as the proportion of the population aged 65 years and over rises. This appears to
be similar in other western countries (Warlow et al 1996, Hankey 1999, Wolfe et al 2001). In
addition, Wolfe and Burney (1992) observed that mortality rates from stroke appeared to be
rising in younger age groups, which would have an effect on overall death rates in subsequent
decades. Although a common cause of death, rates have declined over the last decade (ISD
Scotland 2003), reflecting an improvement in survival rather than a decline in the incidence
(Giroud et al 2002). However with an increased survival there is an associated high prevalence of
Prevalence of Disability
Stroke is thought to be the main cause of disability in the UK today (Giroud et al 2002, Parahoo
et al 2003). Statistics recording the number of people disabled from a stroke are not recorded, as
many stroke survivors are in retirement and do not register themselves disabled. However health
statistics estimate that 30% of survivors will be totally independent within 21 days increasing to
50% by 6 months (NHS Scotland 2003, Parahoo et al 2003). At one year post-stroke 65% of
survivors will live independently whilst 35% remain disabled needing help from family and
health services. Around 5% of patients will be cared for in nursing homes or long stay hospitals.
Estimated stroke care accounts for 4 - 6 % of the national health expenditure in the UK of the
NHS budget (Burton 2000). In terms of numbers between March 2002 to March 2003 in Scotland
10,295 people were admitted to hospital with cerebrovascular disease, 8,313 people survived
over 30 days and 16,181 people (including patients who had a stroke before March 2002) were
discharged from hospital with a diagnosis of stroke (ISD Scotland 2003).
With the incidence of stroke and the subsequent prevalence of disability, the potential draw on
public services is enormous and has prompted the government to address the situation. The
literature exposes inequalities in the organisation and clinical care for stroke patients in the UK
(Stroke Treatment and Service Delivery Conference Consensus Statement 2000, Wolfe 2001)
and recognises an “apparent lack of understanding by health professionals of the stroke patients’
requirements to promote a positive recovery process” (Gibbon 2002). Stroke has been targeted as
an area for improvement, with the acknowledgement of the need for comprehensive care with a
range of publications from the Royal College of Physicians Intercollegiate Stroke Group (2002),
The National Framework for Older People (2001), The Royal College of Physicians Report
(2001) and Health in Scotland (1999). Throughout all these reports there has been a great deal of
emphasis on secondary care, i.e. promoting recovery from stroke and minimising the risk of
re-occurrence. To help explain stroke further the effects of a stroke from an individual perspective
are now described.
INDIVIDUAL PERSPECTIVE:
The individual perspective of stroke has been divided into three parts. The first part briefly
describes the causes of stroke. The second part describes the effects of the stroke on the
individual using the framework of the International Classification of Impairments, Disabilities
and Handicaps (ICIDH – 2; WHO, 1998). The third part focuses on the individual’s recovery and
Causes of Stroke
Stroke, as already defined is caused by an interruption in the blood supply to the brain tissue. The
risk factors predisposing to this disruption in the blood supply can be genetic, due to age,
co-morbidity, such as diabetes, hypertension, heart disease, previous stroke or lifestyle factors, such
as smoking, lack of exercise, poor diet, and excessive alcohol intake. Genetics and age are
uncontrollable risk factors whereas lifestyle factors are controllable through adopting a healthier
lifestyle (Clarke 1998). Furthermore practicing a healthier lifestyle reduces the risks of
co-morbidity. Following a stroke, survivors are encouraged to change their behaviour to live a
healthier lifestyle to minimise risk factors associated with stroke and its reoccurrence.
Effects of Stroke
“Stroke can have a catastrophic impact on the individual, with a wide range of far reaching
physical, psychological and social sequelae.” Burton (2000)
The current approach to understanding disability is derived from International Classification of
Impairments, Disabilities and Handicaps (ICIDH – 2; WHO, 1998), which is a “multi-purpose
classification”, intended to provide a standardised way of understanding and researching “the
function states associated with health conditions” from a multi-disciplinary approach (NHS
Scotland 2003). The model not only acknowledges the physiological aspects of disability, but
also the contextual factors, environment and personal characteristics. (Figure: 1.1.) The model
can be used to describe a “health condition”, such as stroke. Stroke is a result of disease (an
underlying pathology which leads to damage to the brain), leaving the body with a condition, i.e.
the functional effects of the stroke on the body. These functional effects impact on the daily
activities of living through impairment, i.e. the loss of body structure, physiological or
psychological; through activity, i.e. where the individual is limited in their activity (activity
limitation previously known as disability); and participation, i.e. “the nature and extent of a
person’s involvement with life situations in relationship to impairment, activities, health
These effects may range from minor to major depending on the extent of the brain damage but
also range from major to minor depending on the contextual factors, which take into account the
individual’s environmental and personal experiences, potentially shaping the way they think
about their health condition. For example, stroke can have a functional effect relating to
impairment, in that the patient may have a loss (or threatened loss) or abnormality of limbs or
physical responses, e.g. swallowing reflex. These impairments can be seen as temporary or
permanent and can contribute to activity limitation, such as a stroke patient who may be having
difficulty talking and eating in the early stages of their recovery, which may resolve or may not
resolve. If this difficulty persists it may limit the patient in participating at a social level and this
participation restriction will influence or be influenced by patients’ individual characteristics, i.e.
the patient not wanting to eat out socially because: the restaurant does not have the appropriate
aids to allow the patient to eat (environment) or the patient may feel embarrassed about his /her
difficulty (psychological). Activities are subsequently limited in that patients will have an
inability or difficulty in performing a task, for some it may even be impossible.
Traditionally, the performance of functional daily activities such as eating and drinking, toileting
bathing, dressing, walking, housework, and shopping have been measured to demonstrate levels
of disability. Although these activities may be limited due to the physical consequence of a
stroke, researchers are becoming increasingly aware that these activities may be further restricted
due to the individual’s environment or more specifically due to the individual’s psychological
characteristics such as the way they think about their stroke. Patients who experience minimal
disability from their stroke may feel more distressed about it than someone who has had a gross
disability. The ICDH-2 model is consistent with past research by Pollard and Johnston (2001)
Impairment Participation
Contextual factors A. Environment
B. Personal
Figure: 1.1: International Classification of Impairments, Disabilities and Handicaps (ICDH-2; WHO, 1998)
Health Condition (Disease or condition)
Fisher and Johnston (1996a) who showed that disability could be manipulated without changing
impairment. (Their work will be further discussed in relation to interventions to promote
recovery later in this chapter). In summary whilst the stroke patient may have activity limitation
(disabilities) following a stroke these will be influenced by the contextual factors, environment
and personal, as suggested by the model, which may impact on the patient’s recovery from their
stroke.
Recovery from Stroke
Stroke recovery is of great interest in that patients have a physiological deficit that once occurred
does not deteriorate unless the patient is compromised by co-morbidity or complications such as
chest infections or further strokes. Anecdotal evidence (McCrum 2000, Cant 2000) and now
empirical evidence (see review below) has shown that patients do recover or adapt following a
stroke but how this process occurs remains elusive.
Recovery from a stroke can take a variable amount of time and is influenced by clinical,
demographic, and psychological factors (the extent of the pathology, the level of impairment and
the contextual factors). It is a spontaneous process that can be influenced with the help of
rehabilitation involving a multi-disciplinary approach using the skills of doctors, nurses,
physiotherapists, occupational therapists, speech therapists and social services or by means of the
patients own coping strategies i.e. in some cases patients “rehabilitate” themselves with out
statutory help, intuitively knowing what to do to help themselves. In the acute stages of stroke,
patients are stabilised through resuscitation, monitoring of signs and symptoms, confirmation of
diagnosis and a regime of medication. Once stabilised medically, patients are referred for
rehabilitation depending on the degree of physical effects of the stroke. For example, a patient
who has had damage in their left hemisphere will present with right-sided symptoms and usually
communication problems and therefore may receive speech therapy to promote speech and
comprehension; a patient with a left-sided weakness of the leg will have physiotherapy to build
up their strength and improve their gait. Patients are therefore usually referred for rehabilitation
where they are taught new ways and supported to adapt to their new circumstances, in an attempt
to develop the patient to their “fullest physical, psychological, social, vocational and education
potential consistent with his or her physiological, and anatomic impairment and environmental
limitations” (Johnston et al 1997). The overriding goal of rehabilitation is to improve the
functional independence in every day activities (Johnston et al 1997) and does not escape the
influence of the contextual factors. The patient, an individual with his/her own psychological
have their own individual psychological characteristics. Some patients appear to respond to
rehabilitation more readily than others. This leads authors to question the constituents of
rehabilitation, as it appears to be “indistinct” (Johnston et al 1997), “non-explanatory in its
process” (Burton 2000) and further described as a “black box” (Whyte and Hart 2003). Statutory
rehabilitation appears not to take into account the opinion of the patient, i.e. health professionals
may see the patient following rehabilitation, as being fully recovered but, subjectively the patient
themselves may not feel as though they have recovered, as they would have liked.
Patient satisfaction has been used within the health services as gauge to indicate the patients
“affective” response to the services provided (Weinman 1998). Patient satisfaction not only
provides a starting point for health professionals to understand how patients respond to health
care; but it is also considered important as it is associated with patients’ cooperation with medical
advice (Ley 1996) and their recovery (Morrison et al 2000). Throughout the stroke recovery
literature over the last decade authors have acknowledged the lack of satisfaction stroke patients
perceive with their care (Ayana et al 2001, Morrison et al 2000), with the lack of information and
poor communication being the key issues (Ayana et al 2001). The Stroke Treatment and Service
Delivery Conference Consensus Statement (2000) states “the needs of stroke patients are not
being adequately met in the UK at present”.
With the current drive for evidence-based medicine, a substantial number of controlled trials
have examined the efficacy of pharmaceutical interventions used in the acute stages of stroke,
evident by the survival from stroke. Relatively recently controlled trials have been used to
examine the efficacy of rehabilitative measures used to promote recovery and in the last two
decades there has been an increase in assessing the indicators of stroke recovery (Hostenbach
2001). These indictors not only reveal patient groups who may benefit from specific
interventions but more importantly provide outcome measures for future evaluation.
Subsequently, increasing numbers of non-pharmacological interventions to maximise recovery
operationalising measures of disability usually through functional ability in terms of activities of
daily living, mood and satisfaction, including other outcome measures such as, length of stay in
hospital, survival, knowledge of stroke and distress of carers have been tested and evaluated in
RCTs. A systematic review of these RCTs was performed to see what other interventions had
been tested aiming to improve outcome from stroke and the findings are presented in the
A SYSTEMATIC REVIEW OF RCTS TESTING AND EVALUATING
NON-PHARMACOLOGICAL INTERVENTIONS
Background
The impact of stroke epidemiologically and psychologically as demonstrated in previous sections
of this chapter has given rise to an increasing body of research, which has become more
sophisticated and robust as our understanding develops. Initially research, using RCTs involved
pharmacological interventions aimed at improving recovery from stroke in its acute stages. More
recently, this methodology has been used to test and evaluate non-pharmacological interventions,
as there is a general appreciation in the literature that recovery involves more than medication
(Johnston 1996). The aim of this review is to identify RCTs testing non-pharmacological
interventions with outcome measures of functional ability, mood and satisfaction.
Methods
Using OVID and Web of Science (on-line search engines) CINHAL, EMBASE, MEDLINE,
PsycINFO, CDSR (Cochrane database Systematic Reviews) databases were accessed. Using key
words, stroke trials, stroke rehabilitation, stroke interventions, cerebrovascular accident, stroke
randomised controlled trials, psychosocial rehabilitation papers between the years of November
1993 to November 2003 were identified.
Inclusion Criteria
The trials of interest for this search were RCTs testing interventions aiming to improve recovery
from stroke. Interventions were defined as the use of specific therapies or environments to induce
a change in the patient’s recovery, which was measured in terms of three outcome variables,
functional ability, mood and satisfaction. Case studies were not included in this review.
Results
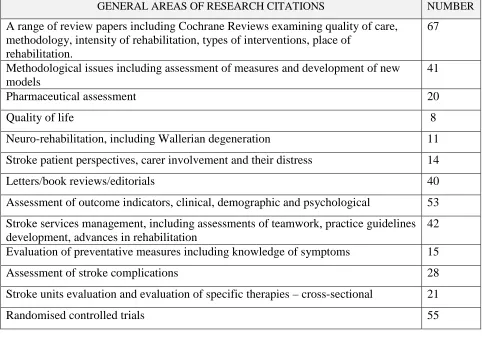
Four hundred and fourteen citations were produced excluding duplications and are broadly
summarised in table 1.1.
This summary illustrates the range of research areas being undertaken in stroke recovery over the
trials that tested pharmaceutically derived interventions, 1 trial where the effectiveness of an
intervention for patients with acquired brain impairment was tested, not explicitly stroke had
their affected limbs immobilised by splinting; 1 trial was a single case study applying a range of
interventions randomly; and 2 trials examined the cost effectiveness of home versus hospital
care.
GENERAL AREAS OF RESEARCH CITATIONS NUMBER
A range of review papers including Cochrane Reviews examining quality of care, methodology, intensity of rehabilitation, types of interventions, place of
rehabilitation.
67
Methodological issues including assessment of measures and development of new models
41
Pharmaceutical assessment 20
Quality of life 8
Neuro-rehabilitation, including Wallerian degeneration 11
Stroke patient perspectives, carer involvement and their distress 14
Letters/book reviews/editorials 40
Assessment of outcome indicators, clinical, demographic and psychological 53
Stroke services management, including assessments of teamwork, practice guidelines development, advances in rehabilitation
42
Evaluation of preventative measures including knowledge of symptoms 15
Assessment of stroke complications 28
Stroke units evaluation and evaluation of specific therapies – cross-sectional 21
[image:29.595.84.566.161.499.2]Randomised controlled trials 55
Table 1.1: Summary of Citations from the Literature Review
In this review 49 RCTs testing non-pharmacological interventions to promote recovery from
stroke were included taking into account the contextual factors as highlighted in the ICDH-2
model. They were sub divided into 4 groups:
1. Interventions examining the effectiveness of the patient’s environment (n = 25)
2. Interventions examining specific therapies involving a programme of training including
physiotherapy, psychotherapy and alternative therapies (n = 14).
3. Interventions examining social support from health, social and voluntary services with no
specified programme of training (including occupational therapy) (n = 8).
4. Interventions examining the effectiveness of information and education (n= 2).
These sub divisions will be presented individually followed by individual discussions
1. Environmental Interventions
The tables 1.2a and b show a set of RCTs (n = 25) obtained from the literature search examining
the effectiveness of different environments in which stroke patients receive care/rehabilitation.
AUTHOR INTERVENTION SURVIVAL FUNCTIONAL ABILITY
MOOD SATISFACTION
Aitken P.D. et al
1993
General medical v.
geriatric care Not reported Earlier improvement Not reported No difference
Hui, E. et al 1995 Geriatric day hospital v.
conventional care Not reported Earlier improvement No difference No difference
Kaste, M. et al 1995 Neurology ward v. general
medical ward No difference in neurology ward in neurology ward in neurology ward
Kalra, L. & Eade, J.
1995
Stroke unit v. general
wards
in
stroke unit
in stroke
unit but n. s.
Not
reported
Not reported
Indredavik, B. et al
1997
Stroke unit v. general
wards
in
stroke unit
in stroke
unit
Not
reported
Not reported
Rudd, A. et al 1997 Early discharge scheme v.
conventional care
No
difference
No difference No
difference
in early
discharge
Widen-Holmqvist,
L. et al 1997
Early discharge scheme v.
conventional care
No
difference
No difference No
difference
No difference
Indredavik, B. et al
1998
Stroke unit v. general
wards 5 years on
in
stroke unit
in stroke
unit
in stroke
unit
Not reported
Ronning, O. &
Guldevog, B. 1998
Hospital rehab. (HR) v.
municipal rehab. (MR)
in HR
but n. s.
No difference No
difference
Not reported
Duncan, P. et al
1998
Home based exercise v.
conventional care Not reported with exercise Not reported Not reported
Indredavik, B. et al
1999
Stroke unit v. general
wards 10 years on
in
stroke unit
in stroke
unit
Not
reported
Not reported
Mayo, N. et al 2000 Early supported discharge
(ESD) v. conventional care Not reported with exercise No difference
with ESD
(Key: v. = versus;= increased;= decreased; rehab = rehabilitation; n. s. = non-significant.)
AUTHOR INTERVENTION SURVIVAL FUNCTIONAL ABILITY
MOOD SATISFACTION
Anderson, C. et al
2000
Home-based rehab. v.
in-patient care
No
difference
No difference No
difference
No difference
Indredavik, B. et
al 2000
Extended stroke unit
care v. conventional care
–short term effects
No
difference
in stroke
unit
Not
reported
Not reported
Lincoln, N. et al
2000
Stroke unit v.
conventional care 5
years on
in stroke
unit
in stroke
unit
Not
reported
Not reported
Kalra, L. et al
2000
Stroke unit v. specialist
stroke team v. specialist
domicillary care
in stroke
unit.
in stroke
unit.
Not
reported
Not reported
Sulch, D. et al
2000
Integrated care pathway
(ICP) for stroke rehab v.
conventional care
No
difference
in ICP No
difference
Not reported
Ronning, O. et al
2001
Stroke unit. v.
conventional care
in stroke
unit
Not reported Not
reported
Not reported
Evans, A. et al
2001
Stroke unit v. stroke
team care
Not
reported
Not reported No
difference
Not reported
Ozdemir, F. et al
2001
Stroke unit v. home care Not
reported
in in-patient
care
Not
reported
Not reported
Roderick, P. et al
2001
Domicillary care v. day
hospital
Not
reported
No difference No
difference
No difference
Steiner, A. et al
2001
Nurse-led unit v.
conventional care
No
difference
No difference Not
reported
Not reported
Sulch, D. et al
2002
Evaluation of integrated
pathways
Not
reported
Not reported No
difference
Not reported
Bautz-Holter, E.
et al 2002
Early supported
discharge (ESD) v.
conventional care
in ESD
but n. s.
in early
discharge
No
difference
in ESD but n. s.
Fjaertoft, H. et al
2003
Extended stroke unit
care v. conventional care
–long term effects
in stroke
unit
in stroke
unit
Not
reported
Not reported
(Key: v. = versus;= increased;= decreased; rehab = rehabilitation; n. s. = non-significant.)
Table: 1.2b: RCTs Examining Environments in Which Stroke Patients Were Cared For
The main outcome variables in these studies were survival, functional ability, mood and
(Aitken et al 1993, Hui et al 1998, Duncan et al 1998, Mayo et al 2000, Evans et al 2001,
Ozdemir et al 2001, Roderick et al 2001 and Sulch et al 2002). Ten studies reported increased
survival, of these 8 studies examined the efficacy of designated stroke units and demonstrated
significant increases in survival (Kalra and Eade 1995, Indredavik et al 1997, 1998 and 1999,
Lincoln et al 2000, Kalra et al 2000, Ronning and Guldevog 2001, Fjaertoft et al 2003), whilst 2
studies, one investigating hospital based rehabilitation (Ronning et al 2001) and the other
investigating early supported discharge (Bautz-Holter 2002) showed non-significant trends in
increased survival. Seven studies found no difference in survival rates when a examining range
of different settings, such as, general medical ward versus neurological ward (Kaste et al 1995),
early discharge schemes (Rudd et al 1997, Widen-Holmqvist et al 1997, Indredavik et al 2000),
home based rehabilitation (Anderson et al 2000), integrated care pathways (Sulch et al 2000) and
a nurse lead unit (Steiner et al 2002). Lincoln et al (2000) suggested in their 5 year follow-up
study of patients who had been treated in a stroke unit, patients treated in the stroke unit were
more likely to survive than those treated in a conventional ward because of reduced disability,
which was an outcome of being cared for in a stroke unit. Less mobile patients are at less risk of
medical complications such as chest infections, deep vein thrombosis (Clarke 1998).
Functional ability has not only been assessed by various measures but at different time points,
which may account for the variation in results of the reviewed studies. Three papers did not use
functional ability as an outcome measure (Ronning et al 2001, Evans et al 2001, Sulch et al
2000). Twenty two papers used functional ability as an outcome with 14 studies showing
significant improvements in patients’ functioning (Aitken et al 1993, Hui et al 1998, Kaste et al
1995, Indredavik et al 1997, 1998, 1999 and 2000, Duncan et al 1998, Mayo, et al 2000, Lincoln
et al 2000, Kalra et al 2000, Ozdemir et al 2001, Bautz-Holter et al 2002, Fjaertoft et al 2003).
Whilst Kalra and Eade (1995) showed a non-significant improvement in functional ability in
patients treated in a stroke unit. Six papers showed no difference in functional ability at all (Rudd
et al 1997, Widen-Holmqvist et al 1997, Ronning and Guldevog 1998, Anderson et al 2000,
Roderick et al 2001, Steiner et al 2002). These studies examined environments other than stroke
units therefore the patients assessed were more likely to be less acute than those in the stroke
units. Sulch et al (2000) in their study of integrated care pathways actually showed decreased
functioning ability in their experimental group.
Thirteen studies used mood as an outcome measure again measured differently in the studies in
the review. Of these, 2 studies reported improved mood in the experimental group as well as
increased functioning (Kaste et al 1995, Indredavik et al 1998) whereas 11 studies showed no
1997, Widen-Holmqvist et al 1997, Ronning and Guldevog 1998, Mayo et al 2000, Anderson et
al 2000, Sulch et al 2000, Roderick et al 2001, Evans et al 2001, Sulch et al 2000, Bautz-Holter et
al 2002). Mayo et al (2000) reported increased functional ability but no improvement in mood,
whereas Sulch et al (2000) reported lower functional ability and no difference in mood.
Nine studies used satisfaction as an outcome measure with 3 studies recording significant
improvements in satisfaction (Kaste et al 1995, Rudd et al 1997, Mayo et al 2000), 1 study
showing a non-significant improvement (Bautz-Holter et al 2002) and 5 studies showing no
differences in satisfaction between the experimental and control groups (Aitken et al 1993, Hui et
al 1995, Widen-Holmqvist et al 1997, Anderson et al 2000, Roderick et al 2001). The improved
satisfaction was replicated in studies examining the effectiveness of early discharge schemes.
Two studies (Rudd et al 1997, Widen-Holmqvist et al 1997) showed greater satisfaction but no
change in functional ability whereas Mayo et al (2000) showed both improved satisfaction as
well as improved functional outcome. These findings possibly indicate that patients express
greater satisfaction when they are cared for in their own home rather than being an in-patient but
greater satisfaction was not associated with improved function.
Discussion of Environmental Interventions
The main issues in this review were the definition of the environments and the various measures
used to assess survival, functional ability, mood and satisfaction. Survival is a dichotomous
variable but the reported rates of survival are misleading due to the descriptions of the
environments. Survival as an outcome measure of being treated in a stroke unit appears logical,
as stroke units traditionally tend to take acute patients and stabilize the medical condition
whereas the other environments tested would involve patients who are further on in their
recovery. This may offer an explanation as to why stroke unit care result in higher survival than
care in other environments. The stroke units in this review (n = 11) differed from each other in
the care that they offered. Seven studies were carried out in units incorporating acute care and
rehabilitation (Indredavik et al 1997, 1998, 1999, 2000, Kalra et al 2000, Evans 2001, Fjaertoft et
al 2003), whereas 1 study was carried out in an acute stroke unit where patients were discharged
within a week to home or further rehabilitation (Ronning et al 2001) and 3 studies were carried
out in units that specialised in rehabilitation (Kalra and Eade 1995, Lincoln et al 2000, Ozdemir
et al 2001). Furthermore stroke units potentially differ from each other in the plans of care used
to maximise recovery, the resources available within the unit and the team offering the care.
There appears to be no standard rehabilitation process addressing the needs of stroke patients
considered to be effective are unable to cope with the high incidence of stroke. This is possibly
one reason as to why stroke patients are selected for rehabilitation in a stroke unit (Kalra 1995,
Ronning and Guldevog 1998), which may have a biasing effect on the results of studies
evaluating the effectiveness of stroke units.
Environments that were not designated as stroke units revealed differing outcomes, for instance
Hui et al (1995) showed better outcomes in a geriatric day hospital than a neurology unit whereas
Kaste et al (1995) showed better outcomes in a neurology unit rather than a general medical
ward. On closer examination Hui et al (1995) was comparing the out patient care under a
neurologist with the patients receiving out patient care under a geriatric day hospital. Whereas
Kaste et al (1995) compared a neurology ward with a general medical ward with the neurology
ward being described as having a physician interested in stroke, with a multidisciplinary
approach to care including standardised procedures for stroke rehabilitation from acute stages
through to longer term care which possibly included the same components as some of the stroke
units.
Ozdemir et al (2001) showed that in-patient care improved functional ability compared with
home care whereas Duncan et al (1998) in their pilot study showed the reverse. Furthermore
Anderson et al (2000) showed no difference in functional ability whether the patient was cared
for in the home or as an outpatient. These three studies were all very different. Ozdemir et al
(2001) used an intensive program of exercise in the hospital and compared it with minimal input
in the home based setting, whereas Duncan et al (1998) used an intensive programme of exercise
in the home setting and compared it with conventional care in the home setting; Anderson et al
(2000) compared community based rehabilitation with hospital out-patient rehabilitation.
Therefore it is very difficult to compare these studies with each other as they are examining
different aspects of home-based care.
This brings into question as already mooted by Johnston et al (1997), Burton (2000) and Whyte
and Hart (2003), what are the components of these environments that induce improvement in
survival, functional ability, mood and satisfaction? Furthermore Vitolins et al (2000) questions
how the outcomes are being measured, given that the scales of impairment, activity and
participation only partially reflect the recovery process, which additionally tends to be physician
orientated. Wade (2003) conducted a review of rehabilitation suggesting that rehabilitation is
more effective in the patient’s own environment, but improvement appeared to be short-lived and
the contents of that rehabilitation was “neither multidisciplinary nor expert”. Evans et al (2000)
stroke unit care remains poorly defined” possibly due to the variations in practice. By using the
data from an RCT, Evans et al (2000) compared stroke unit, specialist stroke team and specialist
domicillary care (the domicillary care group were not used in this study). They prospectively
identified factors using a structured format that could be related to better outcomes in the unit. In
the stroke units, patients were more closely monitored and themes of multi-disciplinary
teamwork, involvement of patients and relatives and education of staff emerged. Patients in the
unit were more likely to have social work assessment, carer skills assessment, and secondary
prevention needs addressed. In the stroke unit “patients had clearly defined goals”, but who had
determined these goals were not explicit. However Evans et al (2000) concluded that no causal
relationship between these variables and outcome could be inferred and the individual elements
of care still need to be examined more closely. In a review by the Cochrane Stroke group, it
concluded that specialist units significantly maximise stroke survivor’s independence a year from
their stroke but the components of care need to be further examined. Duffy et al (2003) argued
that the use of interventions within stroke units not only varies but also are not completely
implemented. The current literature appears to be acknowledging a need for the individual
components of the care patients receive in stroke units to be more closely examined.
2. Specific Therapy Interventions
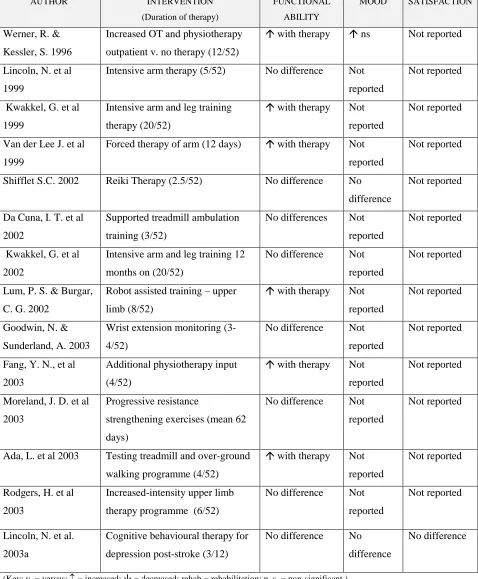
From the systematic literature search, 14 RCTs examined the effectiveness of specific therapies,
which involved training over a specified period of time (table: 1.3.). These studies did not use
survival as an outcome measure and mainly concentrated on functional outcome with a small
number of studies (n = 2) reporting mood and satisfaction outcomes. Six studies reported
increased functional ability (Werner and Kessler 1996, Kwakkel et al 1999, Van der Lee et al
1999, Lum et al 2002, Fang et al 2003, Ada et al 2003) whereas 8 studies reported no differences
in functional ability between the experimental and the control groups (Lincoln et al 1999, 2003a,
Shiflet, 2002, Da Cuna et al 2002, Kwakkel et al 2002, Goodwin et al 2003, Moreland et al 2003,
Rodgers et al 2003).
In 2 studies patients’ physical input was not involved in the intervention. These included Shiflet
(2002) who tested the efficacy of Reiki therapy on stroke recovery. She concluded that Reiki
therapy did not have an effect on functional ability nor mood. Lincoln et al (2003a) used
cognitive behaviour therapy as an intervention in their study where they also found no benefits in
Ten studies concentrated specifically on improving function of the upper and/or lower limb using
a specified programme of exercise.
[image:36.595.87.565.95.674.2](Key: v. = versus;= increased;= decreased; rehab = rehabilitation; n. s. = non-significant.)
Table 1.3: RCTs Testing the Effectiveness of Specific Therapies in Stroke Patients AUTHOR INTERVENTION
(Duration of therapy)
FUNCTIONAL ABILITY
MOOD SATISFACTION
Werner, R. &
Kessler, S. 1996
Increased OT and physiotherapy
outpatient v. no therapy (12/52)
with therapy ns Not reported
Lincoln, N. et al
1999
Intensive arm therapy (5/52) No difference Not
reported
Not reported
Kwakkel, G. et al
1999
Intensive arm and leg training
therapy (20/52)
with therapy Not
reported
Not reported
Van der Lee J. et al
1999
Forced therapy of arm (12 days) with therapy Not
reported
Not reported
Shifflet S.C. 2002 Reiki Therapy (2.5/52) No difference No
difference
Not reported
Da Cuna, I. T. et al
2002
Supported treadmill ambulation
training (3/52)
No differences Not
reported
Not reported
Kwakkel, G. et al
2002
Intensive arm and leg training 12
months on (20/52)
No difference Not
reported
Not reported
Lum, P. S. & Burgar,
C. G. 2002
Robot assisted training – upper
limb (8/52)
with therapy Not
reported
Not reported
Goodwin, N. &
Sunderland, A. 2003
Wrist extension monitoring
(3-4/52)
No difference Not
reported
Not reported
Fang, Y. N., et al
2003
Additional physiotherapy input
(4/52)
with therapy Not
reported
Not reported
Moreland, J. D. et al
2003
Progressive resistance
strengthening exercises (mean 62
days)
No difference Not
reported
Not reported
Ada, L. et al 2003 Testing treadmill and over-ground
walking programme (4/52)
with therapy Not
reported
Not reported
Rodgers, H. et al
2003
Increased-intensity upper limb
therapy programme (6/52)
No difference Not
reported
Not reported
Lincoln, N. et al.
2003a
Cognitive behavioural therapy for
depression post-stroke (3/12)
No difference No
difference