*Corresponding author Sayed Hasan Hashemabadi Email: [email protected] Tel:+98 21 7724 0496
Fax: +98 21 7724 0495
Article history
Received: March 1, 2012
Received in revised form: October 14, 2012 Accepted: October 24, 2012
Available online: April 30, 2013
Journal of Petroleum Science and Technology 2013, 3(1), 21-30 http://jpst.ripi.ir
DEVELOPMENT OF A PELLET SCALE MODEL FOR TRICKLE BED
REACTOR USING CFD TECHNIQUES
Mansoor Bazmi1, Sayed Hasan Hashemabadi2*, and Mahmood Bayat1
1
Research Institute of Petroleum Industry (RIPI)
2
Computational Fluid Dynamics (CFD) Research Laboratory, School of Chemical Engineering, Iran University of Science and Technology, Tehran, 16846, Iran
ABSTRACT
In this study, a pellet scale model was developed for trickle bed reactor utilizing CFD techniques. Drag coefficients were calculated numerically at different velocities and bulk porosities in the case of single phase flow through the dry bed. The simulation results were then compared with the prediction of Kozeny-Carman (K-C) equation. The results indicated that drag coefficients calculated from the square arrangement of cylindrical particles in the pellet scale model were in good agreement with Kozeny-Carman equation prediction; however, triangular arrangement had over prediction comparing with Kozeny-Carman equation. Afterward, the pellet scale model with square arrangement was developed for fully pre-wetted particles which were enveloped with a liquid film. The VOF model was used to investigate the boundary condition on the surface of the static liquid layer. The results of CFD simulation in various gas velocities indicated that, at the adjacent of the particle walls, the no-slip boundary condition was acceptable. This pellet scale model was also in good agreement with the Kozeny-Carman equation.
Keywords
: Trickle Bed Reactor, Cylindrical Particle, Drag Coefficient, Pressure Drop, Particles Arrangement, CFD Simulation.INTRODUCTION
Trickle bed reactors (TBR’s) are three phase reactors in which gas and liquid phases simultaneously flow downward to a fixed bed of catalyst particles; they are widely used in various petroleum industries such as hydro-cracking, hydro-desulphurization, hydridenitro-genation, catalytic de-waxing as well as chemical industries including reactive amination, liquid phase oxidation, and wastewater treatment.
Due to the importance of pressure drop and
Journal of Petroleum Science and Technology 2013, 3(1), 21-30 http://jpst.ripi.ir are commonly used in the simulation of trickle
bed reactors. Furthermore, during the last decade, the pressure drop and flow drag coefficient through the TBR’s were estimated by using CFD techniques [13-15]. Various parameters such as the size and shape of particles, operating conditions, fluid properties, and bed tortuosity affect the drag force applied on the particles and on the hydrodynamics of TBR. Unfortunately, although during the last decade many authors have investigated the hydrodynamic behavior of trickle bed rectors, the studies on particle shape and bed tortuosity are scarce and the previous calculations are usually based on particles with a spherical shape. Similarly, for other particle shapes, the equivalent diameter is considered in the litera-ture as a shape effect. Lakoda et al. [7] studied the effect of particle shape (spherical, cylindri-cal, and rings) on pressure drop values and found that particle shape affected the relative permeability constant. Also, Nemec and Levec [16] investigated the effect of particle shape on the pressure drop of a single phase flow through the TBR’s. Based on their experimental results, the original Ergun constants can accurately predict the pressure drop for only single phase flow over spherical particles, but these con-stants should be modified for other particle shapes. In another study, Nemec and Levec [8] concluded that particle shape did not have any effect on the liquid hold up values. Trivizadakis et al. [17] studied the effects of spherical and cylindrical particles on the hydrodynamics of a two-phase flow through a TBR and it was found out that particle shape had a significant effect on pressure drop and liquid holdup. On the other hand, the pressure drop and liquid hold up values of a packed bed loaded with cylindrical particles were greater than those of a bed with spherical particles of the same size.
The tortuosity of the bed is another parameter that characterizes the packing structure. It depends on the factors such as particle
arrangement, media homogeneity, and channel shape. Investigations on tortuosity are usually restricted to beds with spherical particles. Lanfreg et al. [18] presented a theoretical model for particles which was indicated with a parking structure factor the tortuosity of a fixed bed randomly packed with identical particles. They found that tortuosity depended on bed voidage andthesphericityofthe particles.
Hellstrom and Lundstrom [19] developed a micromechanical model with the square arrangement of cylindrical particles to study the real mechanisms of flow in a porous media using a CFD approach. Also, Lopes et al. [20] used triangular arrangement of spherical particles to model TBR’s using a CFD approach. In their computational domain, the catalyst particles did not contact each other. To facilitate the grid generation, they considered 3% of the sphere diameter as a distance between two particles. Gunjal et al. [21] investigated the fluid flow through a bed packed with different arrange-ments of sphere particles (simple cubical, 1-D rhombohedra, 3-D rhombohedra, and face-centered cubical geometries) using a CFD approach.
In this study, a pellet scale model is proposed to calculate the drag force of dry and wet particles with cylindrical shape. The effect of particle arrangement on the drag force is also investi-gated based on the slit model and CFD tech-niques. The proposed model can be used for a regime in which liquid film flows over the particles.
MATHEMATICAL FORMULATION
Modeling Single Gas Phase Flow Using CFD Techniques
Journal of Petroleum Science and Technology 2013, 3(1), 21-30 http://jpst.ripi.ir
(
)
.
0
g g gd
u
dt
ρ
ρ
+ ∇
=
(1)(
)
(
)
(
)
2
.
g
g g g
g g g
g
d
u
P
dt
y
u
g
ρ
ρ
µ
ρ
+ ∇
= ∇
+
∇
∇
+
(2)These two above equations are solved simultaneously to calculate velocity and pressure field. According to Newtonian viscosity law, for incompressible fluid, the stress tensor is related to velocity gradient tensor as follows [22]:
(
t)
u
u
τ
= −
µ
∇ + ∇
(3)2 1 2 w D C v
τ
ρ
= (4)On the other hand, the drag coefficient can be obtained from the two-fluid model.
(
)
(
)
2 1 3 2 2 2 31
1
g g D p g g pE
U
F
d
E
U
d
ε µ
ε
ε ρ
ε
−
=
+
−
(5)2 1 2 D D F C A U
ρ
= (6)Thus, these two results are compared with each other. The two-fluid model [11, 12] is based on this assumption that trickle flow can be idealized as a stratified flow in which the gas and liquid phases are completely separated by a smooth interface. Therefore, according to Kozeny-Carman (K-C) equation, each fluid behaves like as continuous phase. Accordingly, the particle-gas drag force per unit volume of space and drag coefficient can be calculated respectively as follows [1]:(5) and (6) where, E1 and E2 are Ergun constants that might be changed due to trickle bed parameters (such as particle size and shape, operating conditions, fluids properties,
particles arrangement, and bed tortuosity). The original Ergun constants E1 and E2 were proposed to be 150 and 1.75 respectively; but, Macdonald et al. [23] recommended 180 and 1.8 for these constants. Similarly, in this study the same values are considered to implement in the proposed model.
In case of a fully wetted bed with the static liquid hold-up, due to the presence of a thin layer of liquid on the surface of particles and consequently the reduction of porosity, the drag force values are higher than when the bed is loaded with dry particles. In this case, the K-C equation is modified as follows [1]:
(
)
(
)
2 2
3
1 3 3
1 2
2
3
2 3 3
1
1
1
1
1
1
g p g D g g pU
F
E
d
U
E
d
αε µ
ε
α
α ε
αε
αε ρ
ε
α ε
αε
−
−
=
+
−
−
−
−
(7)Using CFD techniques, the governing equations on flow field (Equations 1 and 2) can be solved in the proposed geometries. Therefore, the drag force imposed on particles can be calculated from Equation 4 if their arrangement is specified. The appropriate representative geometry for the bed can be determined by a suitable pellet scale model. Afterward, the obtained results are compared with those of K-C equations (5-7).
Pellet Scale Modeling Using CFD
Journal of Petroleum Science and Technology 2013, 3(1), 21-30 http://jpst.ripi.ir
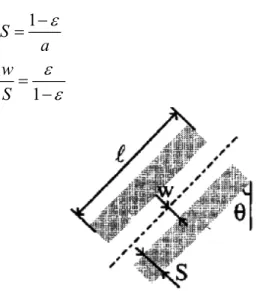
1
S a
ε
−
= (8)
1
w S
ε
ε
=
− (9)
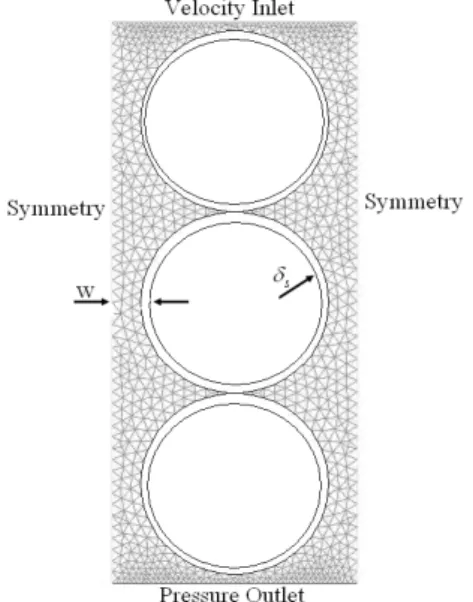
Figure 1: Geometrical configuration of the slit model Figure 2 shows the proposed pellet scale models with square and triangular configurations.
Figure 2: Proposed pellet scale model for two different cylindrical particle arrangements: A)
Square; B) Triangular
Since cylindrical particles are symmetric along the axis, the proposed model is considered in a 2D space, in which the effects of cylinder ends are assumed to be negligible. Although this assumption, which is in agreement with other studies of flow over circular cylinders [17, 24], is more applicable to flow regimes with low Reynolds numbers, the 2D and 3D simulations are preformed and the obtained results are then compared. It is concluded that the errors of measurement in a 2D model compared to a 3D one are less than 4% (Figure3).Therefore, due to the reduction in the number of calculations, the 2D model is selected and cylindrical particle arrangement is considered in a horizontal state due to higher mechanical stability.
Figure 3: Comparison of pellet scale model drag coefficient for 2D and 3D CFD simulations The particle arrangement in the pellet scale model should exhibit the tortuosity of the bed. Thus, two particle arrangements (square and triangular) are considered. A simplified symmet-rical model for both square and triangular configurations is also presented in Figure 4.
equa-Journal of Petroleum Science and Technology 2013, 3(1), 21-30 http://jpst.ripi.ir tions. Also, the SIMPLE algorithm was used for
pressure velocity coupling [22].
The results show that the number of catalyst particles does not affect the drag force values. Therefore, the pellet scale model containing three particles with the drag force imposed on the middle one was considered. The proposed method can also be used to study the wetting effect of catalyst particle on the drag coefficient values. According to the slit model, when catalyst particles are wetted, it is surrounded by a layer of liquid with a thickness of which is calculated as follows:
ls s
s s
h a
δ
η
= (10)
where, ηs is the static wetting efficiency that equals to 1 for full wetted particles. In this case, the static liquid holdup hls is calculated as follows:
(
)
1(
2)
32
20 0.9 ;
1
l ls
l
gd
h EO EO
ρ
ε
σ
ε
−
= + =
−
ɺɺ ɺɺ (11)
Figure 5 shows three catalyst particles surrounded by a layer of static liquid.
Figure 5: Square arrangements of wetted particles
Evaluation of Slip Condition on Wetted Particles
Studying the boundary conditions on the surface
of the wetted catalyst particles is of great importance. Accordingly, the boundary condi-tion of the particle which is surrounded by a layer of liquid has been investigated in the present work using Volume of Fluid (VOF) model. This model was used to evaluate the slip boundary condition at gas-liquid interface on the wetted particles. The VOF model enables the computation of multiphase flows in which gas-liquid interfaces are clearly identified. In the VOF model, the variables such as pressure and velocity are shared by both phases and correspond to volume-averaged values. The volume-averaged conservation equations for mass and momentum describing the two immiscible incompressible fluid hydrodynamics are respectively given by Equations 12 and 13:
( )
. u 0
t
ρ
ρ
∂ + ∇ =
∂ (12)
( )
j(
i j)
i
j i
i
j i j i
u
u u
t
x
u
u
P
g
f
x
x
x
x
σρ
ρ
µ
ρ
∂
+
∂
∂
∂
∂
∂
∂
∂
= −
+
+
+
+
∂
∂
∂
∂
(13)
Where, mixture density and dynamic viscosity are determined by volume fraction averaging equation 14.
(
1
)
(1
)
g l
g l
ρ αρ
α ρ
µ αµ
α µ
=
+ −
=
+ −
(14)In VOF model, tracking the interface between gas and liquid phases is accomplished by the solution of a continuity equation for the gas volume fraction (α) as follows (Equation 15):
. 0
u t
α
α
∂ + ∇ =
∂ (15)
Journal of Petroleum Science and Technology 2013, 3(1), 21-30 http://jpst.ripi.ir
RESULTS AND DISCUSSION
Validation of Pellet Scale Model Predictions
At first, in order to study the predictability of the model developed by CFD techniques, the drag coefficient for a single cylindrical particle under different air flow rates conditions were calculated and the results were compared with obtained values from Haider and Levenspiel equation [25].
As shown in Figure 6 the average error of the model based on CFD techniques is less than 6%. This good agreement indicates that our CFD model can accurately predict the drag coefficients for cylindrical particles.
Dry Particles Drag Coefficient
According to the pellet scale model, a single-phase flow of air (constant density) was passed through a bed loaded with the cylindrical particles (d=1.5 mm and L=3.11 mm).
Figure 6: Drag coefficients of cylindrical particle obtained from CFD model and Haider and
Levenspiel equation [25]
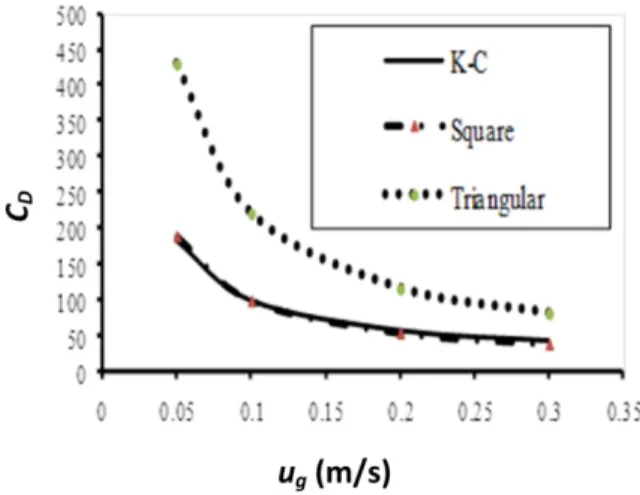
The drag coefficient was calculated using the related equations and CFD techniques, and the results were then compared to those of the K-C equation. Figure 7 shows the influence of gas phase velocity on drag coefficient values in a medium with constant porosity (i.e. 0.4) for both triangular and square configurations alongside K-C equation results.
Figure 7: Influence of gas velocity on CFD drag coefficient of triangular and square configurations
alongside K-C equation (Porosity= 0.4) As it can be seen in Figure 7, good agreement between the square configuration and K-C equation (Equations 5 and 6) results is observed, while the predicted triangular values are higher. It must be noted that the two configurations, namely square and triangular, have the same porosity but different tortuosity. Figure 8 shows drag coefficients versus porosity for both triangular and square configurations alongside K-C equation results (gas velocity= 0.1 m.s-1).
Figure 8: Influence of bed porosity on CFD drag coefficients for triangular and square configurations alongside K-C equation results (gas velocity=0.1 m.s-1)
Journal of Petroleum Science and Technology 2013, 3(1), 21-30 http://jpst.ripi.ir configuration is imposed on the walls around
cylindrical particles, while in the triangular configuration it is mainly imposed on the upper zone of cylindrical particles. Since drag force is defined as the imposed force on the particle along the direction of the flow, the triangular results are higher than the square configuration. The square and triangular arrangements are considered as the upper and lower limits of tortuosity and represent the lowest and highest drag force applied torespectively. As mentioned earlier, K-C equation and the square configure-tion are in very good agreement.
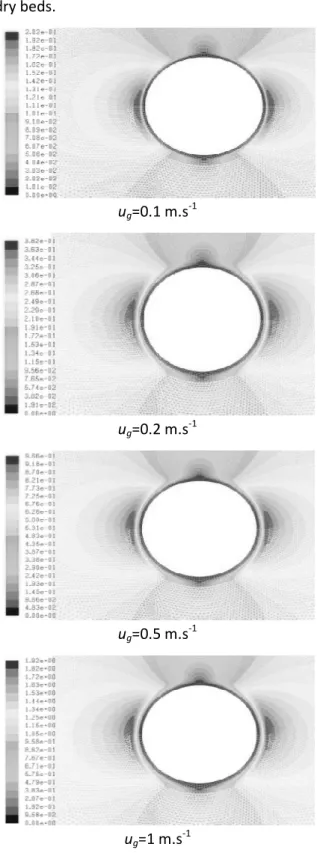
The Effects of No-slip Boundary Condition on the Simulation of Wetted Particles
In order to study the validity of the no-slip boundary condition for wetted particles, a thin liquid film with 0.02 mm in thickness is patched around a particle with a diameter of 1 mm and a length of 4 mm. Afterwards, the simulations were done by use of VOF governing equations (Equations 12-15) at different gas velocities. The velocity contours for these conditions are shown in Figure 9. As it can be seen, the gas velocity at gas-liquid interface is zero for the different velocities of inlet gas. Based on these results, it is confirmed that the no-slip condition for a wetted particle is an appropriate assumption for the CFD simulation.
Drag Coefficient for Fully-wetted Particles
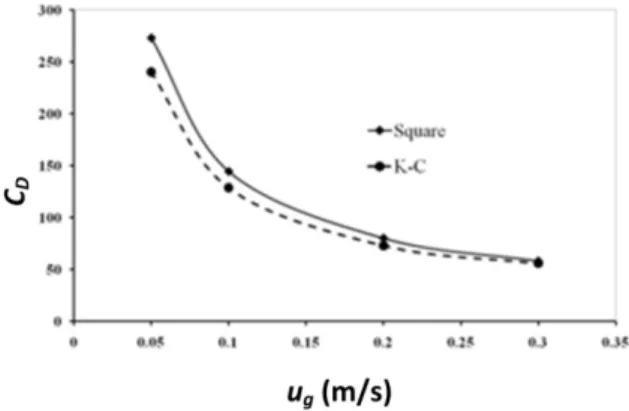
A single-phase flow of air (constant density) was passed through wetted cylindrical particles (d=1.5 mm and L=3.11 mm) in a porous medium (Figure 4) and drag force values were calculated. Figures 10 and 11 show the drag force values for the square configuration and K-C results at different velocity and porosity values. It can be seen similar to dry particles, good agreement is observed between K-C equation results and the square configuration for wetted particles. Figures 12 and 13 show the drag coefficient of dry and wetted particles with the square
configuration. As it can be seen, the difference between dry and wet curves decreases at higher gas velocity and bed porosity values. It can be seen that in pre-wetted beds drag coefficient has a higher value and pressure drop relative to dry beds.
ug=0.1 m.s-1
ug=0.2 m.s -1
ug=0.5 m.s -1
ug=1 m.s-1
Journal of Petroleum Science and Technology 2013, 3(1), 21-30 http://jpst.ripi.ir Figure 10: Comparison of drag force coefficient of
wetted particles vs. gas velocities in the square configuration with K-C equation (porosity= 0.4)
Figure 11: Drag coefficient of wetted particles vs. porosity in the square configuration and K-C
equation (gas velocity= 0.1 m.s-1)
CONCLUSIONS
The drag coefficient of a trickle bed reactor loaded with cylindrical particles is investigated by a pellet scale model which is developed with a CFD approach. The arrangement of Particles is one of the most effective parameters influencing drag force in TBR’s this is studied in the current work and compared with the empirical equations. The model presented here is also used to find out the effect of the triangular and square configurations of particles. Furthermore, the no-slip boundary condition for wetted particles is investigated herein. Good agreement is show between the proposed CFD model and predictions of empirical equations. The model presented here is also used to find out the effect of the triangular and square equations. It is concluded that the pellet scale
model with the square configuration makes a better prediction of drag force in the bed compared to the triangular one.
Figure 12: Drag coefficient of dry and wet particles vs. gas velocities in the square configuration
(porosity= 0.4)
Figure 13: Drag force coefficient of dry and wet particles vs. porosity in the square configuration
(gas velocity= 0.1 m.s-1)
NOMENCLATURE
A : Particle surface area (m2) CD : Drag coefficient (-)
dP : Equivalent Diameter (mm)
E1, E2 : Ergun Constants (-)
FD : Drag force between gas and solid phases
G : Gravity acceleration (m.s-2) he : External liquid holdup
P : Pressure (Pa)
S : Slit half-wall thickness (mm) t : Time(s)
u : Velocity (m.s-1)
uk : Velocity of k phase (m.s -1
Journal of Petroleum Science and Technology 2013, 3(1), 21-30 http://jpst.ripi.ir w : Slit half-void thickness (mm)
Subscripts
G : Gas
L : Liquid S : Solid
Greek Symbol
α : Mean fraction of gas phase δ : Wet thickness (m)
ρ : Density (kg.m-3)
µ : Viscosity (kg.m-1s-1)
ε : Porosity
τ : Stress tensor (N.m-2)
REFERENCES
[1] Attou A., Boyer C., Ferschneider G., “Modelling of the Hydrodynamics of the Cocurrent Gas-liquid Trickle Flow through a Trickle-bed Reactor”, Chem. Eng. Science.
1999, 54, 785-802.
[2] Boyer C., Volpi C., Ferschneider G., “Hydrodynamics of Trickle Bed Reactors at High Pressure: Two-phase Flow Model for Pressure Drop and Liquid Holdup, Formulation and Experimental Validation”,
Chem. Eng. Science. 2007, 62, 7026-7032.
[3] Lopes R. J. G., Quinta-Ferreira R. M., “Three-Dimensional Numerical Simulation of Pressure Drop and Liquid Holdup for High-pressure Trickle-bed Reactor”, Chem. Eng.
Journal.2008, 145, 112-120.
[4] Bazmi, M., Hashemabadi, S. H., Bayat M., “Modification of Ergun Equation for Application in Trickle Bed Reactors Randomly Packed with Trilobe Particles Using Computational Fluid Dynamics Technique”, Korean J. Chem. Eng. 2011, 28(6), 1340-1346.
[5] Bazmi, M., Hashemabadi, S. H., Bayat, “CFD Simulation and Experimental Study for two-Phase Flow through the Trickle Bed Re-actors, Sock and Dense Loaded by Trilobe Catalysts”, International Communications in
Heat and Mass Transfer, 2011. 38, 391-397.
[6] Carbonell R. G., “Multiphase Flow Models in Packed Beds”, Oil & Gas Science and
Technology2000, 55(4) 417-425.
[7] Lakota A., Levec J., Carbonell R. G., “Hydrodynamics of Trickling Flow in Packed Beds: Relative Permeability Concept”, AIChE Journal. 2002, 48(4), 731-738.
[8] Nemec D., Levec J., “Flow through Packed Bed Reactors: 2. Two-phase Concurrent Downflow”, Chem. Eng. Science, 2005, 60, 6958-6970.
[9] IliutaI., Larachi F., “Modeling the Hydrodynamics of Gas-liquid Packed Beds Via Slit Models: Review” .2005, The Brekeley Electronic Press, 3.
[10] IliutaI., Larachi F., Al-Dahhan M. H., “Multiple-zone Model for Partially Wetted Trickle Flow Hydrodynamics”, Chem. Eng. Res. Des. (Trans IChemE part A) 2000, 78, 982-990.
[11] Attou A., Ferschneider G., “A Two-fluid Hydrodynamic Model for the Transition between Trickle and Pulse Flow in a Cocurrent Gas-liquid Packed-bed Reactor”,
Chem. Eng. Science. 2000, 55, 491-511.
[12] Attou, A., Ferschneider, G., “A. Two-fluid Model for Flow Regime Transition in Gas-Liquid Trickle-bed Reactors”. Chemical
Engineering Science. 1999, 54, 5031-5037.
[13] Gunjal P. R., Kashid M. N., Ranade V. V., Chaudhari R. V., “Hydrodynamics of Trickle-Bed Reactors: Experiments and CFD Modeling”, Ind. Eng. Chem. Res. 2005, 44, 6278-6294.
[14] Lopes R. J. G., Quinta-Ferreira R. M., “Evaluation of Multiphase CFD Models in Gas-liquid Packed-bed Reactors for Water Pollution Abatement”, Chem. Eng. Science,
2010, 65, 291-297.
[15] Souadnia A., Latifi M. A., “Analysis of Two-phase Flow Distribution in Trickle-bed Reactors”, Chem. Eng. Science. 2001, 56, 5977-5985.
[16] Nemec D.,Levec J., “Flowthrough packed bed reactors: 1. Single-phase flow”, Chem.
Eng. Science.2005, (60), 6947–6957.
[17] Trivizadakis M. E., Giakoumakis D., Karabelas A. J., “A Study of Particle Shape and Size Effects on Hydrodynamic Parameters Of Trickle Beds”, Chem. Eng.
Journal of Petroleum Science and Technology 2013, 3(1), 21-30 http://jpst.ripi.ir [18] Lanfrey P. Y., Kuzeljevic Z. V., Dudukovic
M.P., “Tortuosity Model for Fixed Beds Randomly Packed with Identical Particles”,
Chem. Eng. Science. 2010, 65, 1891-1896.
[19] Hellstrom, J. G., Lundstorm T. S., “Flow through Porous Media at Moderate Reynolds Number”, International Science
Colloquium, Modeling for Material
Processing. 2006, Riga, June 8-9.
[20] Lopes R. J. G., Quinta-Ferreira R. M., “Numerical Simulation of Trickle-Bed Reactor Hydrodynamics with RANS-Based Models Using a Volume of Fluid Technique”, Ind. Eng. Chem. Res. 2009, 48, 1740-1748,.
[21] Gunjal P. R., Ranade V. V., Chaudhari R. V., “Computational Study of a Single-phase Flow in Packed Beds of Spheres”, AIChE
Journal. 2005, 51 (2), 365-378.
[22] Patankar S. V., “Numerical Heat Transfer and Fluid Flow”, Taylor and Francis1980. [23] Macdonald I. F., El-Sayed M. S., Mow K.,
Dulllen F. A. L., “Flow through Porous Media: the Ergun Equation Revisited”, Ind.
and Eng. Chem. Fundamentals. 1979, 18,
199-208.
[24] M. Rahman, Karim, Md. M., Alim, Md. A., “Numerical investigation of unsteady flow past a circular cylinder using 2D finite volume method” Journal of Naval
Architecture and Marine Engineering. 2007,
4, 27-42.