OXFORD
UNIVERSITY PRESSOxford University Press is a department of the University of Oxford. It furthers the University's objective of excellence in research,
scholarship, and education by publishing worldvvide. Oxford is a registered trademark of Oxford University Press in the UK and in certain other countries.
Published in Australia by Oxford University Press
253 Normanby Road, South Melbourne, Victoria 3205, Australia
© Petra Buttner and Reinhold Muller 2011
The moral rights of the author have been asserted
First published 2011
All rights reserved. No part of this publication may be reproduced, stored in a retrieval system, or transmitted, in any form or by any means, without the prior permission in writing of Oxford University Press, or as expressly permitted by law, by licence, or under terms agreed with the
appropriate reprographics rights organisation. Enquiries concerning reproduction outside the scope of the above should be sent to the Rights Depaltment, Oxford University Press. at the address above.
You must not circulate this work in any other form and you must impose this same condition on any acquirer.
National Library of Australia Cataloguing-in-Publication data
Author: Buttner. Petra.
Title: Epidemiology / Petra Buttner, Reinhold Muller. ISBN: 9780195573893 (pbk.)
Notes: Includes bibliographical references and index. Subjects: Epidemiology.
Other Authors/Contributors: Muller. Reinhold,
1958-Dewey Number: 614.4
Reproduction and communication for educational purposes
The Australian CopyJightAct 1968 (the Act) allows a maximum of one chapter or 10% of the pages of this work, whichever is the greater. to be reproduced and/or communicated by any educational institution for its educational purposes provided that the educational institution (or the body that administers it) has given a remuneration notice to Copyright Agency Limited (CAL) under the Act.
For details of the CAL licence for educational institutions contact:
Copyright Agency Limited Level 15, 233 Castlereagh Street Sydney NSW 2000
Telephone: (02)9394 7600 Facsimile: (02) 9394 7601 Email: [email protected]
Edited by Carolyn Pike
Text design by eggplant communications 1)rpeset by diacriTech. Chennai. India Proofread by Anne Mulvaney Indexed by Russell Brooks
Printed by Sheck Wah Tong Printing Press Ltd
Links to third party websites are provided by Oxford in good faith and for infonnation only. Oxford disclaims any responsibility for the matelials contained jn any third pmty website
Contents
List of Figures List ofT abies Preface
[image:4.540.70.505.47.662.2]Acknowledgments
Table: Find your level: From Introduction to Beyond the basics
Chapter 1 What is Epidemiology?
Key learning objectives Key terms
Introduction
Defining epidemiology Classification of epidemiology The epidemiological process A brief history of epidemiology
Examples of major achievements in public health through epidemiology Eliminating smallpox
Rheumatic fever and rheumatic heart disease Iodine deficiency
Smoking and lung cancer Summary
Further reading Websites Bibliography
Answers to critical thinking exercises
Chapter 2 Disease Concepts in Epidemiology
Key learning objectives Key terms
Introduction
xii
xv xviii
XXI
XXII
01
01 01 02 02 07 13 18
25
25
25
26
27
28
28
29
29
32
35
35 35
36
iv Contents
The natural history of disease Aetiology of disease
An epidemiological approach to causality Infectious disease concepts
The epidemiological triangle: Agent-host-environment Agent
Host Environment
Some basic concepts used in infectious disease epidemiology Transmission routes
Infectious period and latent period
Investigation of an infectious disease outbreak The epidemic curve
Modelling infectious diseases A simple infectious disease model Summary
Further reading Websites Bibliography
Answers to critical thinking exercises
Chapter 3 Identification of Disease: Diagnostic Tests and Screening
Key learning objectives Key terms
Introduction
Quality measures of diagnostic tests Assessing reliability of diagnostic tests Assessing validity of diagnostic tests
How to calculate predictive values from sensitivity and specificity Dependence of predictive values on prevalence
Receiver operating characteristics: Optimising cut-off points Screening for disease
Important issues to be considered when screening Screening programs
Evaluation of a screening program Summary
Further reading Websites Bibliography
Answers to critical thinking exercises
Contents v
Chapter 4 Measures of Disease Frequency 112 Key learning objectives 112
Key terms 112
Introduction 113
Prevalence 115
Characteristics of prevalence 117
Incidence 119
Cumulative incidence 120
Incidence rate 123
The concept of 'risk' 128 Relationship between prevalence and incidence 129 Standardisation of rates 132
Crude rates and specific rates 133
Direct standardisation of rates 135 Indirect standardisation of rates 136 Facts about standardisation and standardised rates 138
Summary 140
Further reading 141
Websites 141
Bibliography 141
Answers to critical thinking exercises 142 Appendix 4.1: Age structure of standard populations 147
Chapter 5 From Research Topic to Research Hypothesis 148 Key learning objectives 148
Key terms 148
How do you choose a research topic? 149 The literature review 154 Where to look for literature 7 154
The hierarchy of evidence 155 Some practical tips on conducting a literature review 156
Information seeking 157
Critical appraisal 158
Writing 160
The operational research hypothesis 161
Summary 165
Further reading 165
Websites 166
Bibliography 166
vi Contents
Chapter 6 Quantitative Descriptive Study Designs
Key learning objectives Key terms
What are quantitative descriptive studies?
Descriptive epidemiology by person, place, and time Characteristics of 'person'
Characteristics of 'place' Characteristics of 'time'
Routine health statistics: An initial source of descriptive data Sources of routine health data
Use of routine sources of health data Limitations of routinely collected health data
Accuracy Completeness Timeliness Appropriateness Vital statistics
Gaining access to routinely collected data Ecological (correlation) studies
Limitations of ecological studies
Can ecological studies be relevant for disease aetiology? Case report and case series
Descriptive cross-sectional stUdies
General comments on cross-sectional studies Summary
Further reading Websites Bibliography
Answers to critical thinking exercises
Chapter 7 Experimental Designs
Key learning objectives Key terms
What defines an experimental study? Design options for experimental studies
Historic controls (non-concurrent controls)
Volunteer control group or researcher-decided control group Before-and-after controls
Randomised controlled trial
Placebo controls in randomised trials
Blinding in randomised controlled trials Cross-over trial
N-of-l trial Zelen's design
Multiple baseline design
Technical aspects of experimental studies Compliance and non-compliance Analysis of experimental studies The study protocol
How to report an RCT Summary
Further reading Websites Bibliography
Answers to critical thinking exercises
Chapter 8 Observational Designs
Key learning objectives Key terms
What defines an observational study?
Directionality, timing, and the three basic observational designs Directionality and timing
The three basic observational study designs Cohort stUdies
Case - control stUdies
Comparative cross-sectional study Measures of association
The relative risk: closed cohort studies The exposure odds-ratio: case-control stUdies The prevalence odds-ratio: cross-sectional studies The relative risk for dynamic and fixed cohorts Difference measures for cohort stUdies
Comparison between relative risk and difference measures Difference measures in case-control studies
other observational study designs Summary
Further reading Bibliography
Answers to critical thinking exercises
Contents vi!
viii Contents
Chapter 9 Sources of Bias
Key leaming objectives Key terms
The concept of bias Selection bias
Volunteer bias Berkson's fallacy Detection bias
Self-selection bias and selective survival Selection bias in different study designs Information bias
Misclassification of disease status Detection bias
The Will Rogers phenomenon Confounding bias
Intermediate variable Potential confounding
Confounding and effect modification Control of bias
Control of bias during design phase of study Control of bias during statistical analysis Direction of bias
Summary Further reading Bibliography
Answers to critical thinking exercises
Chapter 10 Sampling Strategy and Sample Size Calculation
Key leaming objectives Key terms
Introduction Sampling strategy
Simple random sampling StratiFied random sampling Systematic sampling Cluster sampling Non-probability sampling Sample size calculation
Sample size calculation for prevalence estimated by a cross-sectional study
Summary Further reading Websites Bibliography
Answers to critical thinking exercises
Chapter 11
Quantitative Methods of Data Collection
Key learning objectives Key terms
Observations Interviews
Types of interviews
Face-to-face interviews versus distance interviews Recording interview information
Questionnaires
Questionnaire design: the process The structure of a questionnaire The format of responses
Visual analogue scale (VAS) and numerical rating scales (NRS) Adjectival scale
Likert scale
Semantic differential scale Vignettes
Validated instruments
What can go wrong with data collection? The 'don't know' problem
The effect of wording on responses Recall loss and telescoping error Summary
Further reading Websites Bibliography
Answers to critical thinking exercises
Chapter 12 Statistics with Confidence
Key learning objectives Key terms
Why statistics?
Types of quantitative data
Contents ix
x Contents
Descriptive statistics Inferential statistics Confidence interval
Confidence interval for the relative risk Confidence interval for the odds-ratio Statistical hypothesis testing
Errors in statistical testing and the problem of multiple testing Selecting an appropriate bivariate statistical test
Survival analysis
The pitfalls of agreement and equivalence Multivariable statistical analysis
Data preparations for multivariable analysis: correlation matrix Data preparations for multivariable analysis: coding
Selecting an appropriate multivariable model Presenting results from multivariable modelling The use of computer programs for data analysis Summary
Further reading Websites Bibliography
Answers to critical thinking exercises
Appendix 12.1: Mathematical signs, symbols, and abbreviations
Chapter 13 Ethical Considerations
Key learning objectives Key terms
What is ethics?
An historical perspective of ethics in health research Principles of biomedical ethics
Respect for autonomy
Beneficence and non-malfeasance Justice
Veracity and fidelity Privacy and confidentiality
Further ethical issues in health research Responsibility
Quality research Debriefing
Ethical concerns in clinical research
Health research conducted in Aboriginal and Torres Strait Islander peoples Coercion and deception
Ethical theory and public health Utilitarianism
Liberalism Communitarianism
Which point of view is correct 7
Summary Further reading Websites Bibliography
Answers to critical thinking exercises
Chapter 14 How to Read and Write Scientific Publications
Key learning objectives Key terms
Introduction
The structure of a scientific publication The introduction
The methodology The results The discussion The abstract The references The title page The acknowledgments
Guidelines for writing scientific articles
Technical aspects of publishing a scientific article Formatting the manuscript
The peer-review process The impact factor
How to read a scientific publication Critical appraisal of published articles Summary Further reading Websites Bibliography Glossary Bibliography Index
Contents xi
List of Figures
[image:13.547.89.463.212.671.2]" C " " '
Figure 11 A disease may be endemic within a population, with a relatively constant number of cases, but an outbreak of the disease, causing
a spike in the number of cases, is an epidemic 4
Figure 12 The 10 leading causes of death in the United States, (a) 1900 and
(b) 2006 5
Figure 13 Classification of epidemiological studies 7
Figure 14 The scientific method 15
Figure 15 An idealised concept of the epidemiological process 16
Figure 16 Hippocrates-engraving by Peter Paul Rubens, 1638 19
Figure 17 John Graunt (1620-74) 20
Figure 18 Or John Snow (1813-58), British physician 22
Figure 2"1 Timeline of the natural history of disease 38
Figure
n
Example of visualisation of sufficient cause according to Kenneth Rothman" Factors A, B, C, D, and E create three different combinations for a sufficient cause each" Factor A is assumed tobe a necessary cause" Factors B, C, D, and E are contributory factors 43
Figure 2J Macro, intermediate, and micro factors 44 Figure 2A Types of possible dose-response relationships: (a) ideal linear form,
(b) threshold, and (c) saturation 47
Figure 25 The epidemiological triangle 52
Figure 2"6 Methods of developing immunity to biological agents 55
Figure
n
The life cycle of schistosomiasis 57Figure 2"8 Infectious period and latent period of an infectious disease 58
Figure 2"9 Original map made by John Snow in 1854, with locations of cholera
cases highlighted in black 60
Figure 2"10 Epidemic curve of a point source outbreak 61
Figure 2J1 Epidemic curve of an outbreak of Legionnaires' disease in 1976 in
Pennsylvania (Garrett 1994), an example of a typical point source outbreak 62
Figure 2J2 An epidemic curve of a continuous source outbreak 63
Figure 2J3 An epidemic curve of a person-to-person outbreak 63
Figure 2"14 Epidemic curve of a nosocomial outbreak of hepatitis B virus among
List of Figures xiii
Figure 2.15 Schematic spread of an infection in a population: the darker blue index case (upper left corner) introduced the infectious disease into a susceptible population (pale blue dots) and the spread of the infection through
the population can be traced by the medium blue dots 65
Figure 2.16 Hypothetical epidemic in a population of 1000 people 70
Figure 3.1 Reliability of the neuropsychological diagnostic test for Alzheimer's
disease (hypothetical example) 84
Figure 3.2 Hypothetical results of ELISA testing for HIV seropositivity 97
Figure 3.3 Receiver operating characteristics curve (in pale blue) from example given in
Box 3.7 99
Figure 4.1 Closed, fixed, and dynamic cohorts over a study period 123
Figure 4.2 The relationship between incidence and prevalence 130
Figure 4.3 Incidence rates of syphilis in the United States (1981-90): (a) crude rates;
(b) gender-specific rates; (c) gender- and ethnicity-specific rates 133
Figure 4.4 Age-specific incidence rates in two populations 139
Figure 6.1 Age-specific incidence rates per 100000 population for cancer of the
trachea, bronchus, and lung stratified by gender, Australia 2005 174
Figure 6.2 A global view of active trachoma, 2005 175
Figure 6.3 Age-standardised incidence rate for cutaneous melanoma (per 100 000 inhabitants) by state and territory within Australia,
1999-2003 176
Figure 6.4 Age-standardised (world standard population) incidence rate for
lung cancer per 100000 inhabitants in Australia, 1982-2005 178
Figure 6.5 Census day in the Netherlands, 1925 180
Figure 6.6 Mortality rates per 100000 population for diphtheria and measles
in the United States between 1900 and 1970 184
Figure 6.7 Age-standardised mortality rates per 100000 inhabitants for Indigenous and non-Indigenous residents of Western Australia
between 1991 and 2005 185
Figure 6.8 Life expectancy at birth for different countries for 2005-2010 191
Figure 6.9 Correlation between per capita dietary fat intake and age-adjusted
mortality from breast cancer in different countries 193
Figure 6.10 Solar UV radiation index and age-standardised incidence of cutaneous
melanoma per 100 000 inhabitants 194
Figure 6.11 Hypothetical example of an ecological study investigating the relationship between per capita income and suicide rate in
three populations* 198
Figure 7.1 Before-and-after control design in its simplest form 227
Figure 7.2 Table of simple random numbers 230
Figure 7.3 Process of simple randomisation (R) 232
Figure 7.4 Process of stratified randomisation (R) 233
xiv List of Figures
Figure 7.6 The process of a cross-over trial 238
Figure 7.7 Timeline for intervention and multiple baseline study
in three communities 242
Figure 8.1 Prospective versus retrospective timing 264
Figure 8.2 The three basic observational study designs 265
Figure 8.3 Relationship between type of job in the rubber industry and
occurrence of respiratory symptoms 284
Figure 9.1 The hierarchy of populations 319
Figure 9.2 Schematic representation of random and systematic errors 322
Figure 9.3 An example selection process: from the target population to the sample 329
Figure 9.4 Relationship between skin cancer 1
=
outcome), hypertension1
=
study factor), and accidental bone fractures 1=
controls)in the target population 333
Figure 9.5 Relationship between skin cancer 1
=
outcome), hypertension1
=
study factor), and accidental bone fractures 1=
controls)restricted to 'diseased' people in the hospital 334
Figure 9.6 Schematic representation of potential confounding 345
Figure 9.7 Intermediate variable: three scenarios 346
Figure 9.8 Checking for potential confounders 348
Figure 9.9 Direction of bias using relative risk as the effect measure 361
Figure 111 A framework for questionnaires 402
Figure 112 The visual analogue scale 416
Figure 11.3 The numerical rating scale 417
Figure 114 Sir Francis Galton 11822 -1911) 420
Figure 12.1 The use of statistics in epidemiology: descriptive and inferential statistics 434
Figure 12.2 Mean and median of two series of observations 440
Figure 12.3 Population and sample means 443
Figure 12.4 Classification of bivariate statistical tests 455
List of Tables
Table 11 Causes of death according to John Graunt 20 Table 12 Water supply and death from Cholera (adapted from Snow 1855) 23
Table 13 Age-standardised lung cancer death rates per 100 000 population
stratified by smoking habits and exposure to asbestos 27
Table 2.1 Incubation periods for selected infectious diseases 39 Table 2.2 Biological agents of infectious diseases 53 Table 2.3 Average times for incubation, latent, and infectious periods of common
infectious diseases 58
Table 3.1 Reliability of CT scans for spinal fractures- hypothetical results 85 Table 3.2 Tabulating sensitivity and specificity 87 Table 3.3 Hypothetical results of diagnostic tests for malaria: reference laboratory
light microscope versus CyScope fluorescence microscope 88 Table 3.4 Hypothetical results of the fasting blood glucose test for diabetes testing
1000 people 92
Table 3.5 Diagnostic test with sensitivity 80%, specificity 90%, and prevalence
30%; assume a total number of 1000 94 Table 3.6 Diagnostic test with sensitivity 80%, specificity 90%, and prevalence
10%; assume a total number of 1000 94 Table 3.7 Diagnostic test with sensitivity 80%, specificity 90%, and prevalence
1%; assume a total number of 1000 95 Table 3.8 Hypothetical results of ELISA testing for HIV seropositivity 97 Table 3.9 Sensitivity and specificity using a cut-off value of 1 98 Table 3.10 Sensitivity and specificity for different cut-off values of ELISA test 98 Table 3.11 Sensitivity and specificity using a cut-off value of 5 98 Table 4.1 Hypothetical frequencies of chlamydia in two communities 114 Table 4.2 Chlamydia prevalences in perceived high-risk groups 118 Table 4.3 Results of an hypothetical follow-up study on HIV / AIDS in intravenous
drug users 125
Table 4.4 Crude and age-specific death rates for two communities: Mayhemberg
and Lazyacres 134
Table 4.5 Direct standardisation of rates 135
xvi List of Tables
Table 4.6 Indirect standardisation of rates 137
Table 5.1 Hierarchy of evidence 155 Table 5.2 Example of two entries from a table created for a literature review on
nutritional women's health in refugee situations 160 Table 6.1 Definitions of some vital statistics 188 Table 6.2 Life expectancy at birth in Australia 1996-2001 and 2005-2007 191 Table 6.3 Cancer mortality rates and fluoridated water supply in 46 US cities 196 Table 7.1 Unbalanced random allocation list 231 Table 7.2 Example of a balanced randomisation 232 Table 8.1 Distribution of lung cancer cases and controls according to the
average number of cigarettes smoked regularly per day before the
onset of the current illness 275 Table 82 A 2
x
2 cross-tabulation of the study factor and the outcome ina cohort study 287
Table 8.3 Retrospective cohort study: exposure to kindergarten (study factor)
and uptake of smoking in adulthood (outcome)* 289 Table 8.4 Retrospective cohort study: exposure to not having attended kindergarten
(study factor) and uptake of smoking in adulthood (outcome): switching
the baseline category 289 Table 85 A 2
x
2 cross-tabulation of the study factor and the outcome in acase-control study 290
Table 8.6 Case-control study: sk',n cancer and previous dietary fat intake 292 Table 8.7 Hypothetical case-control studies with ratio of cases to
controls
=
1:1 and 1:5 294 Table 8.8 A 2x
2 cross-tabulation of study factor and outcome in across-sectional study 295 Table 8.9 Cross-sectional study of parenting style and mental health
outcome for children 296 Table 8.10 A 2
x
2 cross-tabulation of results from a fixed or a dynamic cohort 297 Table 8.11 Frequently used difference measures for closed, fixed, anddynamic cohorts 298
Table 8.12 Mortality rates per 100000 person-years for lung cancer and coronary artery disease stratified for smokers and non-smokers and
the resulting relative risk and attributable rate 301 Table 9.1 Results of the Salk poliomyel'ltis vaccine field trial conducted in 1954 330 Table 92 Association between hypertension (study factor) and skin cancer
(outcome) in the target population of 50 000 people 332 Table 9.3 Result of case-control study in the entire 'diseased' population from
[image:17.544.73.439.64.664.2]List ofT abies xvii
Table 9.7 Disease status in cohort study 341 Table 9.8 Six-month survival probabilities of patients with lung cancer stratified
by TNN stage 343
Table 9.9 Percentage of patients with lung cancer stratified by TNN stages 344 Table 9.10 Case-control study of alcohol consumption during pregnancy and
birthweight of child 350 Table 9.11 Case-control study of alcohol consumption during pregnancy and
birthweight of child stratified by smoking status of mother 350 Table 9.12 Confounding and effect modification 352 Table 9.13 Overall results of a hypothetical cross-sectional study on ergonomically
designed chairs and chronic low back pain in office workers 353 Table 9.14 Results of a hypothetical cross-sectional study on ergonomically
designed chairs and chronic low back pain in office workers
stratified by age 353
Table 9.15 Cross-sectional study: sexual orientation and sexual violence among
Australian male prisoners 362 Table 10.1 Relationship between prevalence p and p (1 - p) 390 Table 10.2 Relationship between precision, d, and sample size, assuming p
=
0.5and z
=
196 391Table 111 Percentage of respondents answering 'yes' by age 422 Table 12.1 Overview descriptive statistics 440 Table 12.2 2
x
2 cross-tabulation of study factor and outcome in a closedand in a dynamic cohort study: Relative risk, rate ratio and their
confidence intervals (Rothman, K. J, and Greenland, S., 1998) 447 Table 123 Types of errors in statistical hypothesis testing 453 Table 12.4 Overall alpha error and number of statistical tests conducted 454 Table 12.5 Examples of study questions and suitable statistical tests 456 Table 12.6 Dummy and stepwise coding 463 Table 127 Overview of multivariable models most frequently used in the
health sciences 464
Table 12.8 Descriptive and multivariable log-binomial regression results of a
[image:18.539.86.458.56.545.2]xviii
Preface
Epidemiology is a fairly young discipline which is highlighted by the fact that the first ever epidemiology textbook, written by Brian 1v1ac1\;1ahon and Thomas Pugh, was published just about 50 years ago in 1960. The core business of'c1assical epidemiology' was, and still is, the identification of occurences and distributions of diseases in populations and the detection and evaluation of causes of diseases. Hmvever, epidemiology has been a very dynamic discipline with new focus areas being added constantly-molecular, social, spatial, and cognitive epidemiology are just a few examples of more recent specialisations.
In the early 2000s some geneticists predicted the end of epidemiology as we know it, suggesting that genetics \vould soon be proven as the ultimate cause for most if not all diseases. This rather simplistic vie\v may still be hampering serious genetics research but in the meantime genetic epidemiology, assessing the interplay between environmental and genetic factors and their role for health events, is thriving.
WHY ANOTHER EPIDEMIOLOGY BOOK?
Epidemiology belongs to the health sciences and medical scientists have traditionally dominated the discipline, bringing a disease centred approach to epidemiology. Our backgrounds, however, are in general research methodology, including biostatistics, and we hope to be able to contribute with our book a somewhat different point of view to further promote and progress modern epidemiology towards its full potential: a methodologically well grounded and versatile tool-kit to conduct evidence-based research in all health sciences.
This 'methods based' approach finds its expression already in the overall structure of this introductory level book that follows the logic of the epidemiological research 'cycle', which is probably better described as an upward spiral in the sense that each research study contributes novel evidence to the knowledge base of the respective discipline. We hope that this structure and our methods based approach as well as the plethora of examples from a broad spectrum of health related disciplines render this textbook to be a practical guide for conducting quantitative research in the broad field of the health sciences.
Preface xix
methods have become a very large discipline in its own right, including such varied concepts and techniques that only a separate book could do it justice.
This introductory textbook to epidemiology is largely based on our lecture notes for both postgraduate students of epidemiology for public health, and under-graduate students of public health and other health sciences (including medicine, nursing, physiotherapy, sports and exercise sciences, and occupational therapy). As with our lecture notes, we have opted for a two-level approach differentiating between 'introductory' knowledge that all students of epidemiology should be familiar with and 'beyond the basics' information for the interested or more advanced reader. The levels of the different sections are indicated in an overview
table starting on page xxvi.
The first four chapters of the book introduce the reader to epidemiology, its historical roots and some basic concepts. The remaining chapters 5 to 14 follow the logic of the
epidemiological research spiral.
Chapter 5 clarifies the concepts of a literature reVIew, the first step of every epidemiological research study. This is followed by the formulation of an operational research hypothesis, a complete and quantitative precise statement of the question the research will aim to confirm or reject. Since the study design and the development of the research hypothesis are closely interlinked, different types of studies, their applications, advantages and disadvantages are subsequently discussed in some detail in Chapters 6, 7,
and 8.
Chapter 9 discusses 'bias', systematic error in the conduct of epidemiological studies, and how bias can be avoided or at least controlled to achieve valid conclusions. Chapter 10 introduces basic sampling strategies and sample size considerations necessary to achieve an 'optimal' sample size for a planned study.
The logically follmving steps in the research spiral are then to develop measurement
tools, such as questionnaires, collecting the data, entering the collected information into a data base (Chapter 11), and analysing the data statistically in order to reject or confirm the stated research hypothesis (Chapter 12). The chapter on statistical analyses is kept very concise and in non-technical language where possible; it is not intended to be a text for general statistical analysis but an introduction to the main concepts and techniques relevant in statistical hypothesis testing.
Chapter 13 deals with the important issues of ethics in human research. Finally, to achieve an 'up\vard' momentum in the research spiral, the results have to be published (Chapter 14)
to be accessible to other scientists and to contribute novel evidence to the area-specific knowledge base.
Each chapter is accompanied by numerous critical thinking exercises (some conceptual, but more often practical also necessitating some calculations) with answers given in the back of the chapter.
xx Preface
Throughout the book we apply examples of recent epidemiological research conducted in Australia and New Zealand. These examples are drawn from a wide range of disciplines demonstrating that epidemiological methodologies are essential research tools across the health sciences. We aimed at presenting as much original research as possible, though sometimes the actual figures had to be adjusted for ease of calculations or other pedagogical purposes. We hope that the examples showcase ongoing research in Australia and New Zealand and provide some inspiration to students of epidemiology.
Acknowledgments
Naturally this textbook would not have been written without the support of many people. First and foremost we would like to thank our friend and mentor at the Free University in Berlin, Germany, the late Professor Irene Guggenmoos-Holzmann (1948-1997), We would like to thank also in particular all our epidemiology students who helped us improve our lecture notes over the last decades. We gratefully acknowledge the contributions of Robert MacLennan, Professor Emeritus of Epidemiology, Queensland Institute of iYledical Research,
to an earlier version of our lecture notes. \Ve also thank numerous friends and colleagues who supported and informed this book project over the last two years.
We would like to express our gratitude to Dr Madeleine Nowak and Dr Clive Wilkinson who helped us tirelessly in revie\ving a first version of the manuscript and to all our colleagues \vho were happy enough to showcase their research in our book and to confide to us some of the intricacies of their epidemiological research.
xxii
Table: Find your level: From Introduction
to Beyond the basics
Chapter
Chapter 1 WHAT IS EPIDEMIOLOGY?
Chapter 2 DISEASE CONCEPTS IN EPIDEMIOLOGY
Chapter 3 IDENTIFICATION OF DISEASE DIAGNOSTIC TESTS AND SCREENING
Chapter 4 MEASURES OF DISEASE FREQUENCY
Chapter 5 FROM RESEARCH TOPIC TO RESEARCH HYPOTHESIS
Introductory level
Introduction
Defining epidemiology
Classification of epidemiology
The epidemiological process
Introduction
The natural history of disease
Aetiology of disease
An epidemiological approach to causality
Introduction
Quality measures of diagnostic tests
Assessing reliability of diagnostic tests
Assessing validity of diagnostic tests
How to calculate predictive values from sensitivity and specificity
Introduction
Prevalence
Incidence
Relationship between prevalence and
incidence
How do you choose a research topic7
The literature review
The operational research hypothesis
Page no
2 2 7 13 36 37 41 45 82 83 84 86 90 113 115 119 129 149 154 161
Beyond the basics Page no
A brief history of epidemiology 18
Examples of major achievements in
public health through epidemiology 25
Infectious disease concepts 50
Dependence of predictive values on
prevalence 93
Receiver operating characteristics:
Optimising cut-off points 96
Screening for disease 100
Standardisation of rates 132
Direct standardisation of rates 135
Indired standardisation of rates 136
Appendix 4.1: Age structure of
[image:23.539.50.514.221.632.2]Table: Find your level: From Introduction to Beyond the basics xxiii
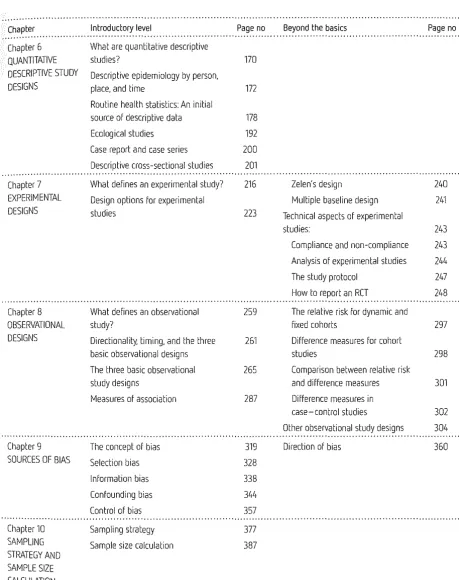
Chapter Introductory level Page no Beyond the basics Page no
... , ... . Chapter 6 What are quantitative descriptive
QUANTITATIVE studies? 170
DESCRIPTIVE STUDY Descriptive epidemiology by person,
DESIGNS place, and time 172
Chapter 7 EXPERIMENTAL DESIGNS Chapter 8 OBSERVATIONAL DESIGNS Chapter 9 SOURCES OF BIAS
Chapter 10 SAMPLING STRATEGY AND SAMPLE SIZE CALCULATION
Routine health statistics: An initial
sourCe of descriptive data 178
Ecological studies 192
Case report and case series 200
Descriptive cross-sectional studies 201
What defines an experimental study'
Design options for experimental studies
What defines an observational study'
Directionality, timing, and the three basic observational designs
The three basic observational study designs
Measures of association
The concept of bias
Selection bias
Information bias
Confounding bias
Control of bias
Sampling strategy
Sample size calculation
216 223 259 261 265 287 319 328 338 344 357 377 387
Zelen's design
Multiple baseline design
Technical aspects of experimental
240
241
studies: 243
Compliance and non-compliance 243
Analysis of experimental studies 244
The study protocol 247
How to report an RCT 248
The relative risk for dynamic and
fixed cohorts 297
Difference measures for cohort
studies 298
Comparison between relative risk
and difference measures 301
Difference measures in
case-control studies 302
other observational study designs 304
Direction of bias 360
[image:24.541.42.501.51.630.2]xxiv Table: Find your level: From Introduction to Beyond the basics
Chapter
Chapter 11 QUANTITATIVE METHODS OF DATA COLLECTION
Chapter 12 STATISTICS WITH CONFIDENCE
Chapter 13 ETHICAL CONSIDERATIONS
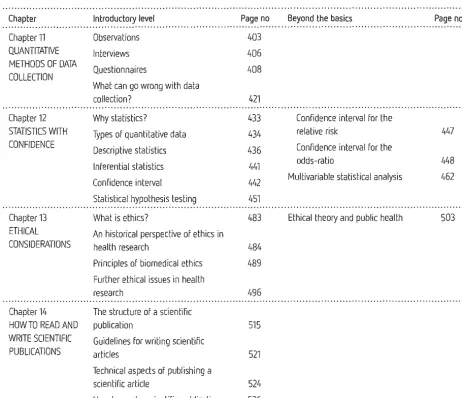
Chapter 14 HOW TO READ AND WRITE SCIENTIFIC PUBLICATIONS
Introductory level
Observations
Interviews
Questionnaires
What can go wrong with data collection?
Why statistics?
Types of quantitative data
Descriptive statistics
Inferential statistics
Confidence interval
Statistical hypothesis testing
What is ethics?
An historical perspective of ethics in health research
Page no 403
406
408
421
433
434
436
441
442
451
483
484
Principles of biomedical ethics 489
Further ethical issues in health
research
The structure of a scientific publication
Guidelines for writing scientific articles
Technical aspects of publishing a
496
515
521
scientific article 524
How to read a scientific publication 526
Beyond the basics Page no
Confidence interval for the
relative risk 447
Confidence interval for the
odds-ratio 448
Multivariable statistical analysis 462
[image:25.547.43.505.67.464.2]