This is a repository copy of
Feature space analysis for human activity recognition in smart
environments
.
White Rose Research Online URL for this paper:
http://eprints.whiterose.ac.uk/116769/
Version: Accepted Version
Proceedings Paper:
Chinellato, E, Hogg, DC orcid.org/0000-0002-6125-9564 and Cohn, AG
orcid.org/0000-0002-7652-8907 (2016) Feature space analysis for human activity
recognition in smart environments. In: 12th International Conference on Intelligent
Environments (IE 2016). 12th International Conference on Intelligent Environments (IE
2016), 14-16 Sep 2016, London, UK. IEEE , pp. 194-197. ISBN 978-1-5090-4056-8
https://doi.org/10.1109/IE.2016.43
© 2016 IEEE. Personal use of this material is permitted. Permission from IEEE must be
obtained for all other uses, in any current or future media, including reprinting/republishing
this material for advertising or promotional purposes, creating new collective works, for
resale or redistribution to servers or lists, or reuse of any copyrighted component of this
work in other works.
[email protected] https://eprints.whiterose.ac.uk/
Reuse
Unless indicated otherwise, fulltext items are protected by copyright with all rights reserved. The copyright exception in section 29 of the Copyright, Designs and Patents Act 1988 allows the making of a single copy solely for the purpose of non-commercial research or private study within the limits of fair dealing. The publisher or other rights-holder may allow further reproduction and re-use of this version - refer to the White Rose Research Online record for this item. Where records identify the publisher as the copyright holder, users can verify any specific terms of use on the publisher’s website.
Takedown
If you consider content in White Rose Research Online to be in breach of UK law, please notify us by
Feature space analysis for human activity
recognition in smart environments
Eris Chinellato
School of Science and Technology Middlesex University London
D.C.Hogg
School of Computing University of Leeds [email protected]
Anthony G. Cohn
School of Computing University of Leeds [email protected]
Abstract—Activity classification from smart environment data is typically done employing ad hoc solutions customised to the particular dataset at hand. In this work we introduce a general purpose collection of features for recognising human activities across datasets of different type, size and nature. The first experimental test of our feature collection achieves state of the art results on well known datasets, and we provide a feature importance analysis in order to compare the potential relevance of features for activity classification in different datasets.
I. INTRODUCTION
Activity identification is one of the fundamental problems in the field of smart environments. New, information rich datasets regarding human activities at different space and time scales are produced daily. Various approaches to activity recognition and characterisation are available in the literature, but there seem to be no comprehensive descriptions of the types of fea-tures that can be extracted from smart environment data. This work aims at covering such a gap by collecting and applying a number of measures and analysis techniques suitable for different datasets in intelligent environments research.
Smart environment datasets are gathered for different pur-poses and using a variety of methods. They can be composed of activities of similar duration and characteristics, or be quite varied, as will be shown in the next section. Keeping in mind all of the above, we wish to provide a new contribution to the problem of activity recognition by building a collection of features able to cover many different types of sensors, activities, and spatio-temporal ranges.
Selecting the set of measures most suitable for a certain datasets allows us to identify and recognise activities, or predict their time and place of occurrence. This offers a number of practical applications such as: identification of dangerous or risky behaviours in schools or care centres; security surveillance; pro-active behaviour in human robot interaction and smart environments. In this exploratory re-search we describe various such measures, and we analyse them critically according to their potential relevance in activity recognition.
II. BACKGROUND AND DATASETS
There is no single standard definition of the concept of human activities. Taxonomies have been proposed for example for human robot interaction [8], whilst healthcare studies typi-cally refer to the concept of Activities of Daily Living (ADL).
Starting from a biological point of view, a very exhaustive compendium of physical activities has been compiled which takes into account a physiological index such as themetabolic ratefor assessing the intensity of typical human tasks [2].
Many works in the literature use purposely collected datasets, and define their own set of activities [11], [4], [10], [5] and features. Our collection of features is instead aimed at being applied to multiple different datasets, assuming that, even when some quantities will be not available or not computable, there will still be a sufficient number of features for activity classification.
A number of different techniques have been proposed for activity recognition or classification [1], based for examples on Hidden Markov Models, Conditional Random Fields [9], Support Vector Machines [4], ontologies [10] or attribute se-lection [7]. We aim here at provide state of the art recognition performance [3] focusing on the feature space rather than on a specific classification methodology. Some of the presented features have been used before in similar ways, but our work is, to the best of our knowledge, the first explicitly aimed at collecting various types of features and analyse them in different conditions and datasets.
For our experimental validation we have been using two col-lections of activity of daily living (ADL) datasets containing sensor streams, mostly from fixed motion sensors for detecting people presence in a specific position at a certain time: CASAS and CHAD.
The Center for Advanced Studies in Adaptive Systems (CASAS)1is developing a Smart Home project, for improving home life, particularly of people with disabilities or specific requirements. CASAS gathers multiple datasets containing a wealth of information regarding the state of the physical environment and of the residents of a house by using multi-ple sensors which generate frequent readings while residents perform their daily routines. Different activity recognition approaches have been successfully applied to the CASAS datasets [5], [3].
The Consolidated Human Activity Database (CHAD)2 of
the US Environmental Protection Agency contains an up to date registry of activities principally aimed at health research,
1http://casas.wsu.edu
and more specifically at detecting the effects of potentially harmful exposure to carbon monoxide. The dataset provide streams of multiple sensor activations for a specifically defined ontology of tens of activities subdivided into 9 main categories.
III. ACTIVITY CHARACTERISATION
We describe in this section our collection of measures for activity characterisation. For clarity, we have organised the measures in four main groups: 1) time related measures, for describing temporal aspects of activities; 2) space or location measures, for the analysis of spatial aspects; 3) complexity measures, which merge temporal and spatial aspects taking also into account possible additional information available on detected events, sub-activities, objects, people; and finally 4) inter-activity (as opposed to intra-activity), relational measures which consider sets and sequences of activities.
A. Time related measures
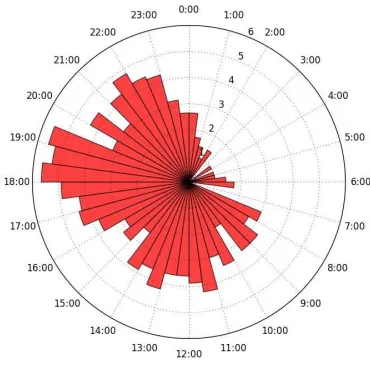
Time of occurrence: Datasets usually provide the time of the day (possibly with more than one daily occurrence) at which a certain activity begins. When representing the daily times of occurrence it should be taken into account that the events to analyse are cyclic, i.e., considering a period of one day, there is no reason to split the data at a certain time (e.g. midnight, as conventionally done, or any other time). The polar plot in Fig. 1 illustrates this concept, by showing the frequency of the time of occurrence of a certain activity registered over several days, in bins of 30 minutes. To preserve the proportion between frequencies and plot bar surface, bar height in the polar plot is proportional to the square of the frequency. It can observed how the activity frequency distribution covers substantially the 24 hours, without any significant time gaps. The polar plot is especially convenient to appreciate the cyclic property of an activity, and suggests an easy way of taking into account such aspects. Considering a certain time point as its angle α in the polar plot, it can be represented by the pair (sinα,cosα), so that all points close in time (including those across midnight) will assume similar values in a 2D space.
Duration: The duration of an activity, when not given, is computed as the difference, in time units, between the activity begin and end points. It may be analysed with basic statistical indexes, such as average and standard deviation.
Repetitions: This feature counts the number of times a certain activity is performed during the chosen period (e.g. a day or a week). In many cases this measure is subject to periodic variations and it thus assumes special interest to compute it separately for sub-periods (e.g. hours of a day or days of week).
B. Space related measures
[image:3.595.345.530.98.281.2]Depending on how the dataset was recorded, the activity place of occurrence, if available, can refer to one or more of various levels of spatial description of the environment. Typical smarthome datasets represent location with sensors which identify specific spatial coordinates and possibly a distance range. Frequently, such coordinates can be associated
Fig. 1. Polar histogram showing activity frequency vs. time of occurrence. Example of data requiring a cyclic fitting.
to a certain room (e.g. living room), or even an area of a room (e.g. sofa). It is thus possible to study with a certain precision where an activity usually takes place.
Location of occurrence: Provided that people movements, or static proximity sensor firing patterns and their location, are available, it is possible to compute two fundamental measures for describing the typical place of occurrence of an activity. These are the average location in Cartesian coordinates (with the associated two dimensional standard deviation), and the lo-cation distribution, i.e. the percentage of presence in different rooms or areas of the building. In the worst case (e.g. when house locations are not named), location distribution can be expressed at least in terms of sensors. In the best case, room and specific areas within a room are also available.
Movements: Sensors and their location offer the possibility of computing additional measures of spatial displacement, such as thedistancecovered during the activity, or the average ground speed of the activity (distance / duration). These features can be useful in distinguishing activities, as we will show in Sec. IV.
C. Complexity related measures
We call complexity measures those features describing elements that are internal to the activity, and that can be used to infer how complex or elaborate an activity is. The availability of such elements depends on the type of data. Examples of complexity measures are: how many objects or people it involves, or how many events, event repetitions, number and type of sensors activated.
Person analysis: Event though most available datasets only present either one or two people, the number of people involved in an activity is an aspect worth taking into account. This information can be extracted with relative ease from visual streams, but is typically not available in smarthome data, as those used in this work.
Object analysis: When available, e.g. in video data or by using RFID tags, the number and identity of objects employed or simply touched by a person during the course of a certain activity can be highly characteristic of that activity.
D. Inter-activity related measures
Activities are characterised not only by intrinsic describing factors, but also by their relations to other activities. Datasets provided with timestamps allow the study of the temporal relations between different activities.
It is possible to estimate the probability of the next activity or even of a given sequence of activities, for example by building a transition matrix representing the frequency with which one activity followed another. A simple version of the study of activity transitions consists of taking the previous activityas an activity feature . For even more precise analyses, temporal and spatial distances from previous and following activities can also be computed.
IV. ACTIVITY RECOGNITION
Descriptive features permit to classify activities, after [3] or even during their occurrence [6]. We have applied different subsets of our feature set to the two groups of datasets presented in Sec. II, in order to evaluate their suitability for activity characterisation in classification tasks.
In order to simulate the situation that might be encountered in real time data processing, we have employed each dataset as a time series, without changing the order in which activities have been recorded. We have employed four different classi-fiers (see Tab. I), training them with a gradually increasing number of data points, and testing on a fixed size interval of new points. The testing sample was fixed at 128 for CASAS and 256 for CHAD, values which provide reasonable cover-age of activity types while avoiding substantial overlapping between testing points, i.e. testing twice on the same data. Basic dataset properties and achieved average performance for all classifiers are summarised in Tab. I, while the features employed in each case are described below.
A. CASAS datasets
From CASAS datasets we were able to extract three tem-poral features (time of occurrence, durationanddaily repeti-tions), two spatial features (locationanddistance), one com-plexity feature (event number) and one inter-activity feature (previous activity). Here, an event (the most basic element of an activity) is any signal received from a sensor in the house. Fig. 2 shows the performance of the Random Forest (RF) classifier on CASAS datasets. Since the datasets present very different numbers of instances, we have employed a logarith-mic scale for the training points in thexaxis. The red circles
TABLE I
DATASET DESCRIPTION AND GENERAL CLASSIFICATION PERFORMANCE.
Index CASAS CHAD
Datasets 8 20
Classes 14.8 48.8
Instances 4319 44501
Average Accuracy
Naive Bayes 69.3 45.8
Linear Discrim. Analysis 65.3 34.2 Support Vector Machine 59.1 44.2 Random Forest 72.9 44.1 Random Forest (initial) 65.1 35.1 Random Forest (final) 74.9 46.2
Fig. 2. CASAS datasets classification trend.
represent the appearance of new activities, the x positions being the training point at which they first appear, and the circle size the amount of activities introduced at that point. Uneven accuracy trends are caused by the irregular distribution of activities in the dataset, and by the relatively small testing sample employed. Significant introductions of new categories (see point 1024 in dataset Tulum 1) is typically matched by a drop in performance. Nevertheless, a general learning trend with the availability of more datapoints can be appreciated for most datasets. This is confirmed by the accuracy obtained by RF at the initial and final test points, shown in Tab. II.
Since our analysis does not allow a direct comparison with the original classification results achieved by the CASAS centre [3], we have performed a second analysis trying to reproduce as precisely as possible the protocol of the original work. To this purpose, we have reduced the activities in all datasets to ten standard activities mentioned in [3], and have performed classification following a three-fold validation procedure. It can be observed that our classifier improves the original results for all datasets. We believe this is not due to the specific classifier, which was probably superior in the original work, but to the richness of our features.
B. CHAD datasets
TABLE II
CLASSIFICATION PERFORMANCE ONCASASDATASETS.
Dataset classes tsfinal tsmean 3-fold from [3]
Cairo 13 87.4 79.2 98.3 82.8
Kyoto 2 16 77.2 76.4 91.0 66.2 Kyoto 3 12 85.8 72.1 90.2 87.3 Kyoto 4 25 47.2 51.1 89.1 63.3
Milan 15 72.4 75.9 88.4 77.4
Tulum 1 10 71.7 78.1 92.1 79.5 Tulum 2 16 59.1 54.4 89.2 66.9
Aruba 11 98.4 96.1 99.1
Fig. 3. CHAD datasets classification trend.
than in CASAS, and CHAD datasets also have typically more categories. The performance of the RF classifier is shown in Fig. 3. It can be seen that the gradual improvement observed for CASAS is in this case attenuated. While there is in fact a clear initial increase in accuracy, this seems to remain substantially constant (averaging across the many fluctuations), toward the end of the datasets. This can be confirmed by comparing the initial, average and final overall performance of the RF classifier in the results summary presented in Tab. I. The complexity of the problem (number of classes) and the larger amount of data available suggest that for many datasets in CHAD we are close to the maximum accuracy attainable with our feature space.
C. Feature importance
RF was the reference classifier in our experiments since it can easily provide an index of the importance of each employed feature. Feature importance for both the CASAS and CHAD datasets are summarised in Tab. III. It can be observed how CASAS classification relies very much on its detailed spatial features, but even in CHAD the single spatial feature available is very important (20%). Not surprisingly, time and duration are always important, while the number of occurrences of an activity in a day is much more useful in CHAD than in CASAS (probably because CHAD datasets typically present more daily repetitions of the same activity).
V. CONCLUSIONS
We have presented in this work a collection of features that can be used for human activity classification from smart
en-TABLE III
FEATURE IMPORTANCE IN ACTIVITY CLASSIFICATION.
Feature CASAS importance CHAD importance
begin time (cos) 8.5 12.6
begin time (sin) 9.5 11.3
duration 8.6 16.0
day of the week 3.7 7.0
location (area) 20.0
mean location (x) 21.3 mean location (y) 17.5 distance covered 6.9 number of events 7.0
day count 9.0 21.3
previous activity 8.1 11.6
vironment data. We have shown that collecting different types of features provides state of the art classification performance, and that some features are always important, while others seem to be more relevant for some datasets. We are currently working on a more detailed analysis of feature importance, and on extending our feature collection approach to additional, different types of datasets.
ACKNOWLEDGMENT
This work was supported by the EU-FP7 grant agreement 600623 (STRANDS project).
REFERENCES
[1] J.K. Aggarwal and M.S. Ryoo. Human activity analysis. ACM Computing Surveys, 43(3):16:1–43, Apr 2011.
[2] B. E. Ainsworth, W. L. Haskell, M. C. Whitt, M. L. Irwin, A. M. Swartz, S. J. Strath, W. L. O’Brien, DR Bassett, Jr, K. H. Schmitz, P. O. Emplaincourt, DR Jacobs, Jr, and A. S. Leon. Compendium of physical activities: an update of activity codes and met intensities.Med Sci Sports Exerc, 32(9 Suppl):S498–S504, Sep 2000.
[3] D.J. Cook. Learning setting-generalized activity models for smart spaces. IEEE intelligent systems, 99(1), 2010.
[4] A. Fleury, M. Vacher, and N. Noury. SVM-based multimodal classifi-cation of activities of daily living in health smart homes: Sensors, algo-rithms, and first experimental results.IEEE Transactions on Information Technology in Biomedicine, 14(2):274–283, March 2010.
[5] N. Krishnan and D. Cook. Activity recognition on streaming sensor data. Pervasive and Mobile Computing, 20:138–154, 2014.
[6] B. Minor, D. Cook, and J. Doppa. Data-driven activity prediction: Algorithms, evaluation methodology, and applications. InACM SIGKDD Conference on Knowledge Discovery and Data Mining, 2015. [7] Franois Portet, Anthony Fleury, Michel Vacher, and Norbert Noury.
Determining useful sensors for automatic recognition of activities of daily living in health smart home. In in Intelligent Data Analysis in Biomedicine and Pharmacology, pages 63–64, 2009.
[8] S. Vacek, S. Knoop, and R. Dillmann. Classifying human activities in household environments. InInternational Joint Conference on Artificial Intelligence (IJCAI), 2005.
[9] Tim van Kasteren, Athanasios Noulas, Gwenn Englebienne, and Ben Kr¨ose. Accurate activity recognition in a home setting. InProceedings of the 10th International Conference on Ubiquitous Computing, UbiComp ’08, pages 1–9, New York, NY, USA, 2008. ACM.
[10] K. Wongpatikaseree, M. Ikeda, M. Buranarach, T. Supnithi, A. O. Lim, and Yasuo Tan. Activity recognition using context-aware infrastructure ontology in smart home domain. InKnowledge, Information and Cre-ativity Support Systems (KICSS), 2012 Seventh International Conference on, pages 50–57, Nov 2012.