JHEP03(2017)156
Published for SISSA by SpringerReceived: September 17, 2016
Revised: February 4, 2017
Accepted: March 13, 2017
Published: March 29, 2017
Measurement and QCD analysis of double-differential
inclusive jet cross sections in pp collisions at
√
s
= 8
TeV and cross section ratios to 2.76 and
7 TeV
The CMS collaboration
E-mail: [email protected]
Abstract:A measurement of the double-differential inclusive jet cross section as a
func-tion of the jet transverse momentum pT and the absolute jet rapidity |y| is presented.
Data from LHC proton-proton collisions at √s = 8 TeV, corresponding to an integrated luminosity of 19.7 fb−1, have been collected with the CMS detector. Jets are reconstructed using the anti-kT clustering algorithm with a size parameter of 0.7 in a phase space region
covering jet pT from 74 GeV up to 2.5 TeV and jet absolute rapidity up to |y|= 3.0. The
low-pT jet range between 21 and 74 GeV is also studied up to |y| = 4.7, using a
dedi-cated data sample corresponding to an integrated luminosity of 5.6 pb−1. The measured jet cross section is corrected for detector effects and compared with the predictions from perturbative QCD at next-to-leading order (NLO) using various sets of parton distribution functions (PDF). Cross section ratios to the corresponding measurements performed at 2.76 and 7 TeV are presented. From the measured double-differential jet cross section, the value of the strong coupling constant evaluated at the Z mass is αS(MZ) = 0.1164+0−0..00600043,
where the errors include the PDF, scale, nonperturbative effects and experimental uncer-tainties, using the CT10 NLO PDFs. Improved constraints on PDFs based on the inclusive jet cross section measurement are presented.
Keywords: Hadron-Hadron scattering (experiments), Jet physics, QCD, Jets,
proton-proton scattering
JHEP03(2017)156
Contents1 Introduction 1
2 The CMS detector 2
3 Jet reconstruction and event selection 3
4 Measurement of the jet differential cross section 5
5 Theoretical predictions 6
6 Comparison of theory and data 8
7 Ratios of cross sections measured at different √s values 12
8 Determination of αS 13
9 The QCD analysis of the inclusive jet measurements 21
10 Summary 26
The CMS collaboration 33
1 Introduction
Measurement of the cross sections for inclusive jet production in proton-proton collisions is an ultimate test of quantum chromodynamics (QCD). The process p + p → jet + X probes the parton-parton interaction as described in perturbative QCD (pQCD), and is sensitive to the value of the strong coupling constant, αS. Furthermore, it provides
important constraints on the description of the proton structure, expressed by the parton distribution functions (PDFs).
In this analysis, the double-differential inclusive jet cross section is measured at the centre-of-mass energy √s= 8 TeV as a function of jet transverse momentum pT and
abso-lute jet rapidity |y|. Similar measurements have been carried out at the CERN LHC by the ATLAS and CMS Collaborations at 2.76 [1,2] and 7 TeV [3–6], and by experiments at other hadron colliders [7–11].
JHEP03(2017)156
the investigations to yet unexplored kinematic regions. In addition, the ratios ofdifferen-tial cross sections at different centre-of-mass energies can be determined. In ref. [12] an increased sensitivity of such ratios to PDFs was suggested.
The data were collected with the CMS detector at the LHC during 2012 and correspond to an integrated luminosity of 19.7 fb−1. The average number of multiple collisions within the same bunch crossing (known as pileup) is 21. A low-pileup data sample corresponding to an integrated luminosity of 5.6 pb−1 is collected with an average of four interactions per bunch crossing; this is used for a low-pTjet cross section measurement. The measured cross
sections are corrected for detector effects and compared to the QCD prediction at NLO. The high-pTpart of the differential cross section, where the sensitivity to the value of αS is
maximal, is measured more accurately than before. Also, the kinematic region of small pT
and largeyis probed. The measured cross section is used to extract the value of the strong coupling constant at the Z boson mass scale, αS(MZ), and to study the scale dependence
of αS in a wider kinematic range than is accessible at √
s = 7 TeV. Further, the impact of the present measurements on PDFs is illustrated in a QCD analysis using the present measurements and the cross sections of deep-inelastic scattering (DIS) at HERA [13].
2 The CMS detector
The central feature of the CMS apparatus is a superconducting solenoid of 6 m internal diameter, providing a magnetic field of 3.8 T. Within the solenoid volume are a silicon pixel and strip tracker, a lead tungstate crystal electromagnetic calorimeter (ECAL), and a brass and scintillator hadron calorimeter (HCAL), each composed of a barrel and two endcap sections. Forward calorimeters extend the pseudorapidity (η) coverage [14] provided by the barrel and endcap detectors. Muons are measured in gas-ionization detectors embedded in the steel flux-return yoke outside the solenoid.
The silicon tracker measures charged particles within the pseudorapidity range |η|< 2.5. It consists of 1440 silicon pixel and 15 148 silicon strip detector modules. For non-isolated particles of 1< pT<10 GeV and|η|<1.4, the track resolutions are typically 1.5%
inpT and 25–90 (45–150)µm in the transverse (longitudinal) impact parameter [15]. The
ECAL consists of 75 848 lead tungstate crystals, which provide coverage in|η|<1.479 in a barrel region (EB) and 1.479<|η|<3.0 in two endcap regions (EE). A preshower detector consisting of two planes of silicon sensors interleaved with a total of 3X0 of lead is located
JHEP03(2017)156
TriggerpT
threshold (GeV) 40 80 140 200 260 320
Offline analysis
pT range (GeV)
74–133 133–220 220–300 300–395 395–507 507–2500
Effective integrated
luminosity (pb−1) 7.9×10
−2 2.12 55.7 2.61×10² 1.06×10³ 1.97×10⁴
Table 1. HLT trigger ranges and effective integrated luminosities used in the jet cross section
measurement. The luminosity is known with a 2.6% uncertainty.
between electromagnetic and hadronic showers. The η–φ tower segmentation of the HF calorimeters is 0.175×0.175, except forηabove 4.7, where the segmentation is 0.175×0.35. The first level of the CMS trigger system, composed of custom hardware processors, uses information from the calorimeters and muon detectors to select events in a fixed time interval of less than 4 µs. The high-level trigger (HLT) processor farm further decreases the event rate from 100 kHz to around 400 Hz, before data storage. A more detailed description of the CMS detector, together with a definition of the coordinate system used and the relevant kinematic variables, can be found in ref. [14].
3 Jet reconstruction and event selection
The high-pT jet measurement is based on data sets collected with six single-jet triggers
in the HLT system that require at least one jet in the event with jet pT > 40, 80, 140,
200, 260, and 320 GeV, respectively. All triggers were prescaled during the 2012 data-taking period except the highest threshold trigger. The efficiency of each trigger is estimated using triggers with lower pT thresholds, and each is found to exceed 99% above the nominal pT
threshold. The pT thresholds of each trigger and the corresponding effective integrated
luminosity are listed in table 1. The jet pT range, reconstructed in the offline analysis,
where the trigger with the lowest pT threshold becomes fully efficient is also shown. This
analysis includes jets with 74< pT<2500 GeV.
Events for the low-pTjet analysis are collected with a trigger that requires at least two
charged tracks reconstructed in the pixel detector in coincidence with the nominal bunch crossing time. This selection is highly efficient for finding jets ('100%) and also rejects noncollision background. ThepT range considered in the low-pT jet analysis is 21–74 GeV.
JHEP03(2017)156
of the corresponding ECAL cluster, and the energy sum of all bremsstrahlung photonsspatially compatible with originating from the electron track. The transverse momentum of muons is obtained from the curvature of the corresponding track. The energy of charged hadrons is determined from a combination of their momentum measured in the tracker and the matching ECAL and HCAL energy deposits, corrected for zero-suppression effects and for the response function of the calorimeters to hadronic showers. Finally, the energy of neutral hadrons is obtained from the corresponding corrected ECAL and HCAL energies. In the forward region, the energies are measured in the HF detector.
For each event, hadronic jets are clustered from the reconstructed particles with the infrared and collinear safe anti-kT algorithm [18], as implemented in the FastJet
pack-age [19], with a size parameter R of 0.7. Jet momentum is determined as the vector sum of the momenta of all particles in the jet, and is found from simulation to be within 5% to 10% of the true momentum over the whole pT spectrum and detector acceptance, before
corrections are applied. In order to suppress the contamination from pileup, only recon-structed charged particles associated to the PV are used in jet clustering. Jet energy scale (JES) corrections are derived from simulation, by using events generated withpythia6and
processed through the CMS detector simulation that is based on thegeant4 [20] package,
and from in situ measurements by exploiting the energy balance in dijet, photon+jet, and Z+jet events [21, 22]. The pythia6 version 4.22 [23] is used, with the Z2∗ tune. The
Z2∗ tune is derived from the Z1 tune [24] but uses the CTEQ6L [25] parton distribtion set whereas the Z1 tune uses the CTEQ5L set. The Z2∗ tune is the result of retuning the
pythia6parameters PARP(82) and PARP(90) by means of the automated PROFESSOR
tool [26], yielding PARP(82)=1.921 and PARP(90)=0.227. The JES corrections account for residual nonuniformities and nonlinearities in the detector response. An offset correc-tion is required to account for the extra energy clustered into jets due to pileup. The JES correction, applied as a multiplicative factor to the jet four momentum vector, depends on the values of jet η and pT. For a jet with apT of 100 GeV the typical correction is about
10%, and decreases with increasingpT. The jet energy resolution (JER) is approximately
15% at 10 GeV, 8% at 100 GeV, and 4% at 1 TeV.
The missing transverse momentum vector, ~pmiss
T , is defined as the projection on the
plane perpendicular to the beams of the negative vector sum of the momenta of all recon-structed particles in an event. Its magnitude is referred to asETmiss. A requirement is made that the ratio ofEmiss
T and the sum of the transverse energy of the PF particles is smaller
than 0.3, which removes background events and leaves a negligible residual contamination. Additional selection criteria are applied to each event to remove spurious jet-like signatures originating from isolated noise patterns in certain HCAL regions. To suppress the noise patterns, tight identification criteria are applied: each jet should contain at least two PF particles, one of which is a charged hadron, and the jet energy fraction carried by neutral hadrons and photons should be less than 90%. These criteria have an efficiency greater than 99% for genuine jets. Events are selected that contain at least one jet with apThigher
JHEP03(2017)156
4 Measurement of the jet differential cross sectionThe double-differential inclusive jet cross section is defined as
d2σ
dpTdy
= 1
Lint,eff
Njets
∆pT(2∆|y|)
, (4.1)
where Njets is the number of jets in a kinematic interval (bin) of transverse momentum
and rapidity, ∆pT and ∆|y|, respectively; Lint,eff is the effective integrated luminosity
contributing to the bin; is the product of the trigger and jet selection efficiencies, and is greater than 99%. The widths of the pT bins increase with pT and are proportional
to the pT resolution. The phase space in absolute rapidity |y| is subdivided into six bins
starting from y = 0 up to |y| = 3.0 with ∆|y| = 0.5. In the low-pT jet measurement an
additional rapidity bin 3.2 < |y| < 4.7 is included. The statistical uncertainty for each bin is computed according to the number of events contributing to at least one entry per event [6], corrected for possible multiple entries per event. This correction is small, since at least 90% of the observed jets in each ∆pT and ∆|y|bin originate from different events.
In order to compare the measured cross section with theoretical predictions at particle level, the steeply falling jet pT spectra must be corrected for experimental pT resolution.
An unfolding procedure, based on the iterative D’Agostini method [27], implemented in the
RooUnfoldpackage [28], is used to correct the measured spectra for detector effects. The
response matrix is created by the convolution of theoretically predicted spectra, discussed in section 5, with the JER effects. These effects are evaluated as a function of pT with
the CMS detector simulation, after correcting for the residual differences from data [21]. The unfolding procedure induces statistical correlations among the bins. The sizes of these correlations typically vary between 10% and 20%.
The dominant contribution to the experimental systematic uncertainty in the measured cross section is from the JES corrections, determined as in ref. [21,22]. For the high-pTjet
data set, this uncertainty is decomposed into 24 independent sources, corresponding to the different components of the corrections: pileup effects, relative calibration of JES versus η, absolute JES including pT dependence, and differences in quark- and gluon-initiated
jets. The set of components, used here, is discussed in detail in ref. [22], and represents an evolution of the decomposition presented in ref. [29]. The low-pileup data set uses a reduced number of components, since the pileup-related corrections are negligible, and there is no JES time dependence. Moreover, the central values of the corrections, for the components common between the two data sets, are not the same; the low-pT jet analysis
uses corrections computed only on the initial part of the 2012 data sample. The impact of the uncertainty induced by each correction component on the measured cross section is evaluated separately. The JES-induced uncertainty in the cross section depends on pT
and y. For the high-pT data, this ranges from 2% to 4% in the sub-TeV region at central
rapidity to about 20% in the highest pT bins for rapidities 1.0 < |y| < 2.0. Due to the
different set of corrections used, the low-pT jet cross section has a larger JES uncertainty
than the contiguous bins of the high-pT part, and this effect becomes more pronounced as
JHEP03(2017)156
PDF set Refs. Order Nf Mt (GeV) MZ (GeV) αS(MZ) αS(MZ) range
ABM11 [41] NLO 5 180 91.174 0.1180 0.110–0.130
CT10 [36] NLO ≤5 172 91.188 0.1180 0.112–0.127
HERAPDF1.5 [40] NLO ≤5 180 91.187 0.1176 0.114–0.122
MSTW2008 [37] NLO ≤5 1010 91.1876 0.1202 0.110–0.130
NNPDF2.1 [38] NLO ≤6 175 91.2 0.1190 0.114–0.124
NNPDF3.0 [39] NLO ≤5 175 91.2 0.1180 0.115–0.121
Table 2. The PDF sets used in comparisons to the data together with the corresponding number
of active flavoursNf, the assumed massesMt and MZ of the top quark and Z boson, the default
values of the strong coupling constant αS(MZ), and the ranges in αS(MZ) available for fits. For CT10 the updated versions of 2012 are used.
To account for the residual effects of small inefficiencies of less than 1% in the trigger performances and jet identification, an uncertainty of 1%, uncorrelated across all jet pT
and y bins, is assigned to each bin.
The unfolding procedure is affected by the uncertainties in the JER parameterization, which are derived from the simulation. The JER parameters are varied by one standard deviation up and down, and the corresponding response matrices are used to unfold the measured spectra. The JER-induced uncertainty amounts to 1–5% in the high-pT jet
region, but can exceed 30% in the low-pT jet region.
The uncertainties in the integrated luminosity, which propagate directly to the cross section, are 2.6% [30] and 4.4% [31] for normal and low-pileup data samples, respectively. Other sources of uncertainty, such as the jet angular resolution and the model dependence of the unfolding, arise from the theoretical pT spectrum used to calculate the response
matrix and have less than 1% effect on the cross section. The total experimental systematic uncertainty in the measured cross section is obtained as a quadratic sum of contributions due to uncertainties in JES, JER, and integrated luminosity.
5 Theoretical predictions
Theoretical predictions for the jet cross section are known at NLO accuracy in pQCD [32,
33], and the NLO electroweak corrections have been computed in ref. [34]. The pQCD NLO calculations are performed by using theNLOJet++(version 4.1.3) program [32,33]
as implemented in thefastNLO(version 2.1) package [35]. The renormalization (µR) and
factorization (µF) scales are both set to the leading jetpT. The calculations are performed
by using six PDF sets determined at NLO: CT10 [36], MSTW2008 [37], NNPDF2.1 [38], NNPDF3.0 [39], HERAPDF1.5 [40], and ABM11 [41]. Each PDF set is available for a range ofαS(MZ) values. The number of active (massless) flavours chosen in NLOJet++
JHEP03(2017)156
(GeV)
T
Jet p
30 40 100 200 300 1000 2000
Non-perturbative correction
0.8 1 1.2 1.4 1.6 1.8 2 2.2
2.4CMS 8 TeV
Simulation
NP correction value NP correction uncertainty NP correction value NP correction uncertainty
[image:8.595.102.488.85.222.2]21
|y| < 0.5 (R = 0.7)
t
anti-k
(GeV) T Jet p
30 40 50 60 100 200 300 400
Non-perturbative correction
0.8 1 1.2 1.4 1.6 1.8 2 2.2
2.4CMS 8 TeV
Simulation
NP correction value NP correction uncertainty NP correction value NP correction uncertainty
21
2.5 < |y| < 3.0 (R = 0.7)
t
anti-k
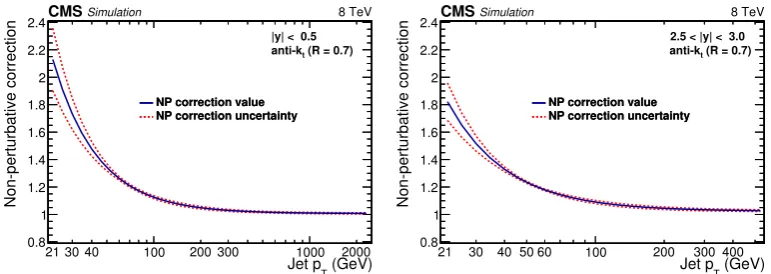
Figure 1. The nonperturbative correction factor shown for the central (left) and outermost (right)
absolute rapidity bins as a function of jet pT. The correction is obtained by averaging LO- and NLO-based predictions, and the envelope of these predictions is used as the uncertainty band.
The parton-level calculation at NLO has to be supplemented with corrections due to nonperturbative (NP) effects, i.e. hadronization and multiparton interactions (MPI). The nonperturbative effects are estimated using both leading order (LO) and NLO event generators. In the former case, the correction is evaluated by averaging those provided by
pythia6[23] (version 4.26), using tune Z2∗, andherwig++(version 2.4.2) [42], using tune
UE [43]. The size of these corrections ranges from 20% at lowpTto 1% at the highestpT of
2.5 TeV. The NLO nonperturbative correction is derived usingpowheg [44–47], interfaced
withpythia6for parton shower, MPI, and hadronization. The nonperturbative correction
factors are derived in this case by averaging the results for two different tunes of pythia6,
Z2∗ and P11 [48]. Hadronization models have been tuned by using LO calculations for the hard scattering, and applying these tunes to NLO-based calculations is not expected to provide optimal results. On the other hand, the application of nonperturbative corrections based on LO calculations to NLO predictions implicitly assumes that the behaviour of nonperturbative effects is independent of the hard scattering description. To take into account both facts, the final number used for the nonperturbative correction, CNP, is an
arithmetic average of the LO- and NLO-based estimates. Half the width of the envelope of these predictions is used as the uncertainty due to the nonperturbative correction. Figure1
shows the nonperturbative correction factors derived by combining both LO- and NLO-based calculations.
The uncertainty in the NLO pQCD calculation arising from missing higher-order cor-rections is estimated by varying the renormalization and factorization scales in the following six combinations of scale factors: (µR/µ, µF/µ) = (0.5,0.5), (2,2), (1,0.5), (1,2), (0.5,1),
(2,1), whereµis the default choice equal to the jetpT, and considering the largest variation
in the prediction as the uncertainty. The uncertainty related to the choice of scale ranges from 5% to 10% for |y|<1.5 and increases to 40% for the outer |y|bins and for high pT.
JHEP03(2017)156
(GeV) T Jet p
80 100 200 300 1000 2000
Electroweak correction factor 1 1.05 1.1
[image:9.595.103.490.86.222.2]1.15CMSSimulation 8 TeV
|y| < 0.5 (R = 0.7) t anti-k
(GeV) T Jet p
80 90100 200 300 400 500
Electroweak correction factor
0.985 0.99 0.995 1
8 TeV
CMSSimulation
2.5 < |y| < 3.0 (R = 0.7)
t
anti-k
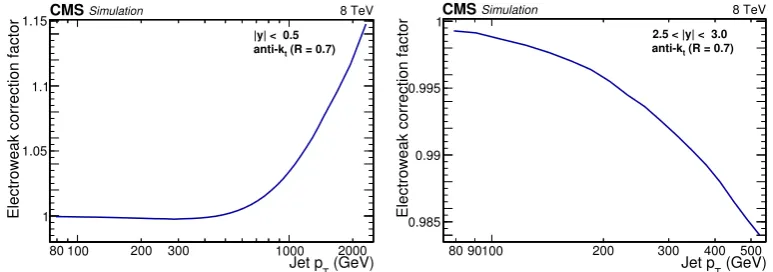
Figure 2. Electroweak correction factor for the central (left) and outermost (right) rapidity bins
as a function of jetpT.
large as 50% at high pT and even increase up to 100% for the CT10 and HERAPDF1.5
sets. The nonperturbative correction induces an additional uncertainty, which is estimated in the central rapidity bin to range between 1.4% atpT∼100 GeV to 0.06% at∼2.5 TeV.
Overall, the PDF uncertainty is dominant.
Electroweak effects, which arise from the virtual exchange of the massive W and Z gauge bosons, induce corrections with magnitudes given by the Sudakov logarithmic factor αWln2(Q2/MW2 ), where αW is the weak coupling constant, MW is the mass of the W
boson, and Q is the energy scale of the interaction. For high-pT jets, the values of the
logarithm, and therefore the correction, become large. The derivation of the electroweak correction factor, applied to the NLO pQCD spectrum corrected for nonperturbative effects, is provided in ref. [34]. Figure 2 shows the electroweak correction for the two extreme rapidity regions as a function of jet pT. In the most central rapidity bin for the high-pT
region, the correction factor is as large as 14%. Electroweak corrections are not applied to the low-pT results, where they are negligible.
6 Comparison of theory and data
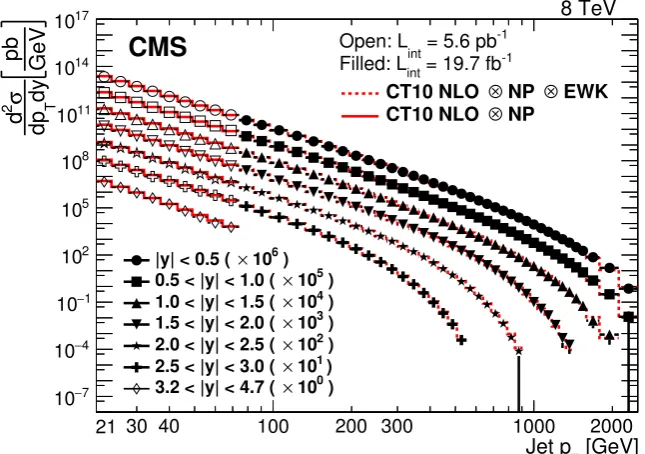
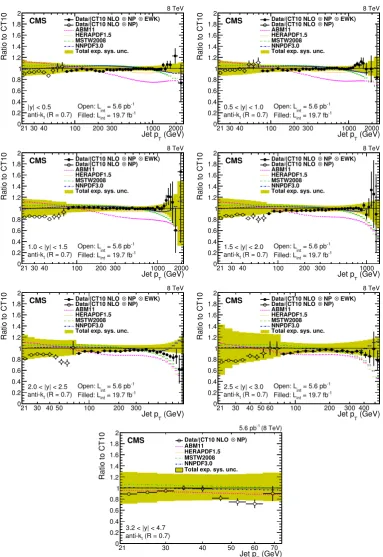
The measured double-differential cross sections for inclusive jet production are shown in figure 3 as a function of pT in the various |y| ranges after unfolding the detector effects.
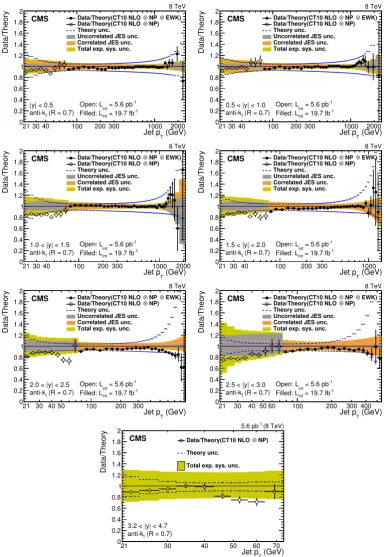
This measurement is compared with the theoretical prediction discussed in section5 using the CT10 PDF set. The ratios of the data to the theoretical predictions in the various |y|
ranges are shown for the CT10 PDF set in figure 4. Good agreement is observed for the entire kinematic range with some exceptions in the low-pT region.
Figure 5 presents the ratios of the measurements and a number of theoretical predic-tions based on alternative PDF sets to the CT10 based prediction. Aχ2 value is computed based on the measurements, their covariance matrices, and the theoretical predictions, as described in detail in section 8. The values for χ2 for the comparison between data and theory based on different PDF sets for the high-pT region are summarized in table 3.
JHEP03(2017)156
[GeV]
T
Jet p
30 40 100 200 300 1000 2000
GeV pb dy T dp σ 2 d 7 − 10 4 − 10 1 − 10 2 10 5 10 8 10 11 10 14 10 17
10 8 TeV
CMS
21
-1 = 5.6 pb int
Open: L
[image:10.595.137.460.86.313.2] [image:10.595.92.503.406.502.2]-1 = 19.7 fb int Filled: L EWK ⊗ NP ⊗ CT10 NLO NP ⊗ CT10 NLO ) 6 10 × |y| < 0.5 (
)
5
10 × 0.5 < |y| < 1.0 (
)
4
10 × 1.0 < |y| < 1.5 (
)
3
10 × 1.5 < |y| < 2.0 (
)
2
10 × 2.0 < |y| < 2.5 (
)
1
10 × 2.5 < |y| < 3.0 (
)
0
10 × 3.2 < |y| < 4.7 (
Figure 3. Double-differential inclusive jet cross sections as function of jetpT. Data (open points for
the low-pTanalysis, filled points for the high-pTone) and NLO predictions based on the CT10 PDF set corrected for the nonperturbative factor for the low-pTdata (solid line) and the nonperturbative and electroweak correction factors for the high-pT data (dashed line). The comparison is carried
out for six different|y|bins at an interval of ∆|y|= 0.5.
|y| Nbins CT10 HERAPDF1.5 MSTW2008 NNPDF2.1 ABM11 NNPDF3.0
0.0–0.5 37 49.2 66.3 68.0 58.3 136.6 62.5
0.5–1.0 37 28.7 47.2 39.0 35.4 155.5 42.2
1.0–1.5 36 19.3 28.6 27.4 20.2 111.8 25.9
1.5–2.0 32 65.7 49.0 55.3 54.5 168.1 64.7
2.0–2.5 25 38.7 32.0 53.1 34.6 80.2 36.0
2.5–3.0 18 14.5 19.1 18.2 15.4 43.8 16.3
Table 3. Summary of theχ2 values for the comparison of data and theoretical predictions based
on different PDF sets in each |y| range, where cross sections are measured for a number of pT
binsNbins.
between the theoretical predictions obtained by using different PDF sets are observed in the high-pT range. The predictions based on CT10 PDF show the best agreement with
data, quantified by the lowestχ2 for most rapidity ranges, while predictions using MSTW,
ABM11, and HERAPDF1.5 exhibit differences compared to data and to the prediction based on CT10, exceeding 100% in the highest pT range.
In the transition between the low- and high-pT jet regions, some discontinuity can
be observed in the measured values, although they are generally compatible within the total experimental uncertainties. The highest pT bins of the low-pT jet range suffer from a
JHEP03(2017)156
(GeV) T Jet p
30 40 100 200 300 1000 2000
Data/Theory 0 0.2 0.4 0.6 0.8 1 1.2 1.4 1.6 1.8
2 8 TeV
CMS Data/Theory(CT10 NLO ⊗ NP ⊗ EWK)
[image:11.595.102.489.91.649.2]NP) ⊗ Data/Theory(CT10 NLO Theory unc. Uncorrelated JES unc. Correlated JES unc. Total exp. sys. unc.
|y| < 0.5
21
-1
= 5.6 pb
int
Open: L
-1
= 19.7 fb
int
Filled: L (R = 0.7)
t
anti-k
(GeV) T Jet p
30 40 100 200 300 1000 2000
Data/Theory 0 0.2 0.4 0.6 0.8 1 1.2 1.4 1.6 1.8
2 8 TeV
CMS Data/Theory(CT10 NLO ⊗ NP ⊗ EWK)
NP) ⊗ Data/Theory(CT10 NLO Theory unc. Uncorrelated JES unc. Correlated JES unc. Total exp. sys. unc.
0.5 < |y| < 1.0
21
-1
= 5.6 pb
int
Open: L
-1
= 19.7 fb
int
Filled: L (R = 0.7)
t
anti-k
(GeV) T Jet p
30 40 100 200 300 1000 2000
Data/Theory 0 0.2 0.4 0.6 0.8 1 1.2 1.4 1.6 1.8
2 8 TeV
CMS Data/Theory(CT10 NLO ⊗ NP ⊗ EWK)
NP) ⊗ Data/Theory(CT10 NLO Theory unc. Uncorrelated JES unc. Correlated JES unc. Total exp. sys. unc.
1.0 < |y| < 1.5
21
-1
= 5.6 pb
int
Open: L
-1
= 19.7 fb
int
Filled: L (R = 0.7)
t
anti-k
(GeV) T Jet p
30 40 100 200 300 1000
Data/Theory 0 0.2 0.4 0.6 0.8 1 1.2 1.4 1.6 1.8
2 8 TeV
CMS Data/Theory(CT10 NLO ⊗ NP ⊗ EWK)
NP) ⊗ Data/Theory(CT10 NLO Theory unc. Uncorrelated JES unc. Correlated JES unc. Total exp. sys. unc.
1.5 < |y| < 2.0
21
-1
= 5.6 pb
int
Open: L
-1
= 19.7 fb
int
Filled: L (R = 0.7)
t
anti-k
(GeV) T Jet p
30 40 50 100 200 300
Data/Theory 0 0.2 0.4 0.6 0.8 1 1.2 1.4 1.6 1.8
2 8 TeV
CMS Data/Theory(CT10 NLO ⊗ NP ⊗ EWK)
NP) ⊗ Data/Theory(CT10 NLO Theory unc. Uncorrelated JES unc. Correlated JES unc. Total exp. sys. unc.
2.0 < |y| < 2.5
21
-1
= 5.6 pb
int
Open: L
-1
= 19.7 fb
int
Filled: L (R = 0.7)
t
anti-k
(GeV) T Jet p
30 40 50 60 100 200 300 400
Data/Theory 0 0.2 0.4 0.6 0.8 1 1.2 1.4 1.6 1.8
2 8 TeV
CMS Data/Theory(CT10 NLO ⊗ NP ⊗ EWK)
NP)
⊗
Data/Theory(CT10 NLO Theory unc. Uncorrelated JES unc. Correlated JES unc. Total exp. sys. unc.
2.5 < |y| < 3.0
21
-1
= 5.6 pb
int
Open: L
-1
= 19.7 fb
int
Filled: L (R = 0.7)
t
anti-k
(GeV)
T
Jet p
30 40 50 60 70
Data/Theory 0 0.2 0.4 0.6 0.8 1 1.2 1.4 1.6 1.8
2 (8 TeV)
-1 5.6 pb
CMS Data/Theory(CT10 NLO ⊗ NP)
Theory unc.
Total exp. sys. unc.
3.2 < |y| < 4.7
21
(R = 0.7) t anti-k
Figure 4. Ratios of data to the theory prediction using the CT10 PDF set. For comparison, the
JHEP03(2017)156
(GeV) T Jet p 30 40 100 200 300 1000 2000
Ratio to CT10
0 0.2 0.4 0.6 0.8 1 1.2 1.4 1.6 1.8
2 8 TeV
[image:12.595.104.488.89.647.2]CMS
|y| < 0.5
21 EWK) ⊗ NP ⊗ Data/(CT10 NLO NP) ⊗ Data/(CT10 NLO ABM11 HERAPDF1.5 MSTW2008 NNPDF3.0 Total exp. sys. unc.
-1 = 5.6 pb int Open: L
-1 = 19.7 fb int Filled: L (R = 0.7) t anti-k
(GeV) T Jet p 30 40 100 200 300 1000 2000
Ratio to CT10
0 0.2 0.4 0.6 0.8 1 1.2 1.4 1.6 1.8
2 8 TeV
CMS
0.5 < |y| < 1.0
21 EWK) ⊗ NP ⊗ Data/(CT10 NLO NP) ⊗ Data/(CT10 NLO ABM11 HERAPDF1.5 MSTW2008 NNPDF3.0 Total exp. sys. unc.
-1 = 5.6 pb int Open: L
-1 = 19.7 fb int Filled: L (R = 0.7) t anti-k
(GeV) T Jet p 30 40 100 200 300 1000 2000
Ratio to CT10
0 0.2 0.4 0.6 0.8 1 1.2 1.4 1.6 1.8
2 8 TeV
CMS
1.0 < |y| < 1.5
21 EWK) ⊗ NP ⊗ Data/(CT10 NLO NP) ⊗ Data/(CT10 NLO ABM11 HERAPDF1.5 MSTW2008 NNPDF3.0 Total exp. sys. unc.
-1 = 5.6 pb int Open: L
-1 = 19.7 fb int Filled: L (R = 0.7) t anti-k
(GeV) T Jet p
30 40 100 200 300 1000
Ratio to CT10
0 0.2 0.4 0.6 0.8 1 1.2 1.4 1.6 1.8
2 8 TeV
CMS
1.5 < |y| < 2.0
21 EWK) ⊗ NP ⊗ Data/(CT10 NLO NP) ⊗ Data/(CT10 NLO ABM11 HERAPDF1.5 MSTW2008 NNPDF3.0 Total exp. sys. unc.
-1 = 5.6 pb int Open: L
-1 = 19.7 fb int Filled: L (R = 0.7) t anti-k
(GeV) T Jet p 30 40 50 100 200 300
Ratio to CT10
0 0.2 0.4 0.6 0.8 1 1.2 1.4 1.6 1.8
2 8 TeV
CMS
2.0 < |y| < 2.5
21 EWK) ⊗ NP ⊗ Data/(CT10 NLO NP) ⊗ Data/(CT10 NLO ABM11 HERAPDF1.5 MSTW2008 NNPDF3.0 Total exp. sys. unc.
-1 = 5.6 pb int Open: L
-1 = 19.7 fb int Filled: L (R = 0.7) t anti-k
(GeV) T Jet p 30 40 50 60 100 200 300 400
Ratio to CT10
0 0.2 0.4 0.6 0.8 1 1.2 1.4 1.6 1.8
2 8 TeV
CMS
2.5 < |y| < 3.0
21 EWK) ⊗ NP ⊗ Data/(CT10 NLO NP) ⊗ Data/(CT10 NLO ABM11 HERAPDF1.5 MSTW2008 NNPDF3.0 Total exp. sys. unc.
-1 = 5.6 pb int Open: L
-1 = 19.7 fb int Filled: L (R = 0.7) t anti-k
(GeV)
T
Jet p
30 40 50 60 70
Ratio to CT10
0 0.2 0.4 0.6 0.8 1 1.2 1.4 1.6 1.8
2 (8 TeV)
-1
5.6 pb
CMS
3.2 < |y| < 4.7
21 NP) ⊗ Data/(CT10 NLO ABM11 HERAPDF1.5 MSTW2008 NNPDF3.0 Total exp. sys. unc.
(R = 0.7)
t
anti-k
Figure 5. Ratios of data and alternative predictions to the theory prediction using the CT10 PDF
JHEP03(2017)156
are different, in particular in thepT-dependent components, and this also contributes to theobserved fluctuations in the matching region. The corresponding uncertainties are treated as uncorrelated between the low- and high-pT regions. The overall estimated systematic
uncertainties account for these residual effects. The transition region between the low-and high-pT jet measurements has limited sensitivity toαS and no impact in constraining
PDFs, since it probes the x-range where the PDFs are well constrained by more precise DIS data.
7 Ratios of cross sections measured at different √s values
Ratios of cross sections measured at different energies may show a better sensitivity to PDFs than cross sections at a single energy, provided that the contributions to the theoretical and experimental uncertainties from sources other than the PDFs themselves are reduced. A calculation of the ratio of cross sections measured at 7 and 8 TeV presented in ref. [12], for instance, suggests a larger sensitivity to PDFs in the jetpTrange between 1 and 2 TeV.
Therefore, it is interesting to study such cross section ratios.
Differential cross sections for the inclusive jet production have been measured by the CMS Collaboration at √s = 2.76 [2] and 7 TeV [6]. Ratios are computed of the double-differential cross section presented in this paper at 8 TeV to the corresponding measure-ments at different energies. For pT > 74 GeV, the choice of jet pT and rapidity bins is
identical for the various measurements, thus allowing an easy computation of the ratio. Only the high-pT jet data set at 8 TeV is used, since no counterpart of the low-pT jet
analysis is available for the other centre-of-mass energies.
As a result of partial cancellation of the systematic uncertainties, the relative preci-sion of the ratios is improved compared with the cross section. Experimental correlations between the measurements at different centre-of-mass energies are taken into account in the computation of the total experimental uncertainty. As a consequence of the unfolding procedure, the results of the cross section measurements at each energy are statistically correlated between different bins, while the measurements at different energies are not statistically correlated with each other. The statistical uncertainties in the ratio measure-ment are calculated by using linear error propagation, taking into account the bin-to-bin correlations in the unfolded data. Correlations between the components of the jet energy corrections at different energies are included, as well as correlations in JER. Uncertainties related to the determination of luminosity are assumed to be uncorrelated.
The theoretical uncertainties are approached in a similar manner: the uncertainties in nonperturbative corrections, PDFs, and those arising due to scale variations are assumed to be fully correlated.
The ratios of the cross sections measured at√s= 7 and 8 TeV are shown in figures6–7
for the various rapidity bins and they are compared with theoretical predictions obtained using different PDF sets. A general agreement between data and theoretical predictions is observed. Some discrepancies are visible at high pT, in particular in the 1.0 <|y|< 1.5
JHEP03(2017)156
(GeV) T Jet p
200 300 400 1000 2000
(8TeV) dyT dp σ 2d (7TeV) / dyT dp σ 2d 0 0.2 0.4 0.6 0.8 1 EWK) ⊗ Data/(NP CT10 Theo. prediction CT10 PDF uncertainty CT10 NNPDF3.0 ABM11 HERAPDF1.5 MMHT14
|y| < 0.5 CMS
(GeV) T Jet p
200 300 400 500 1000
(8TeV) dyT dp σ 2d (7TeV) / dyT dp σ 2d 0 0.2 0.4 0.6 0.8 1 EWK) ⊗ Data/(NP CT10 Theo. prediction CT10 PDF uncertainty CT10 NNPDF3.0 ABM11 HERAPDF1.5 MMHT14
0.5 < |y| < 1.0 CMS
(GeV) T Jet p
200 300 400 1000 2000
Data/Theory
0 0.5 1
1.5 |y| < 0.5
CMS
EWK)
⊗
Data/(NP
CT10 Theo. prediction
CT10 PDF uncertainty NNPDF3.0 ABM11 HERAPDF1.5 MMHT14 (GeV) T Jet p
200 300 400 500 1000
Data/Theory
0 0.5 1
1.5 0.5 < |y| < 1.0
CMS
EWK)
⊗
Data/(NP
CT10 Theo. prediction
CT10 PDF uncertainty NNPDF3.0 ABM11 HERAPDF1.5 MMHT14
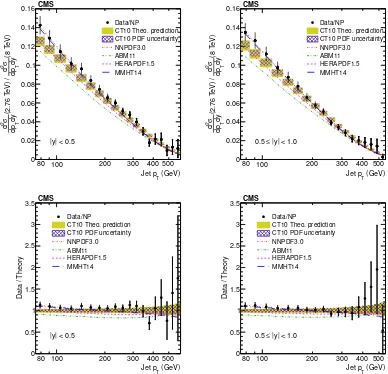
Figure 6. The ratios (top panels) of the inclusive jet production cross sections at √s = 7 and
8 TeV, shown as a function of jet pT for the absolute rapidity |y| <0.5 (left) and 0.5 <|y|<1.0 (right). The data (closed symbols) are shown with total uncertainties (vertical error bars). The NLO pQCD prediction using the CT10 PDF is shown with its total uncertainty (shaded band) and the contribution of the PDF uncertainty (hatched band). Predictions obtained using alternative PDF sets are shown by lines of different styles without uncertainties. The data to theory ratios (bottom panels) are shown by using the same notations for the respective rapidities. The last bin for the|y|<0.5 region is wider than the others in order to reduce the statistical uncertainty.
uncertainties, which are represented here for CT10. The experimental uncertainty in the ratio is considerably larger than the theoretical uncertainty. Consequently, no significant constraints on PDFs can be expected from the inclusive jet cross section ratio of 7 to 8 TeV. The ratios of the cross sections measured at 2.76 TeV to those measured at 8 TeV are determined in a similar way. Results are presented in figures 8–10, and compared to theoretical predictions that use different PDF sets. In general, the predictions describe the data well. The central value of the theoretical prediction and its uncertainty are completely dominated by the choice of and the uncertainty in the PDFs, demonstrating the strong sensitivity of the 2.76 to 8 TeV cross section ratio to the description of the proton structure.
8 Determination of αS
Measurements of jet production at hadron colliders can be used to determine the strong coupling constant αS, as has been previously from the CMS 7 TeV inclusive jet
measure-ment [29], and from Tevatron measurements [49–51]. The procedure to extract αS in
ref. [29] is adopted here. Only the high-pT jet data are used, since the sensitivity of the
αS predictions increases with jetpT. The determination ofαS is performed by minimizing
JHEP03(2017)156
(GeV) T Jet p
200 300 400 500 1000
[image:15.595.92.504.79.542.2](8TeV) dy T dp σ 2d (7TeV) / dy T dp σ 2d 0 0.2 0.4 0.6 0.8 1 EWK) ⊗ Data/(NP CT10 Theo. prediction CT10 PDF uncertainty CT10 NNPDF3.0 ABM11 HERAPDF1.5 MMHT14
1.0 < |y| < 1.5 CMS
(GeV) T Jet p 200 300 400 500 600
(8TeV) dyT dp σ 2d (7TeV) / dyT dp σ 2d 0 0.2 0.4 0.6 0.8 1 EWK) ⊗ Data/(NP CT10 Theo. prediction CT10 PDF uncertainty CT10 NNPDF3.0 ABM11 HERAPDF1.5 MMHT14
1.5 < |y| < 2.0 CMS
(GeV) T Jet p
200 300 400 500 1000
Data/Theory
0 0.5 1
1.5 1.0 < |y| < 1.5
CMS
EWK) ⊗ Data/(NP
CT10 Theo. prediction
CT10 PDF uncertainty NNPDF3.0 ABM11 HERAPDF1.5 MMHT14 (GeV) T Jet p
200 300 400 500 600
Data/Theory
0 0.5 1
1.5 1.5 < |y| < 2.0 CMS
EWK)
⊗
Data/(NP
CT10 Theo. prediction
CT10 PDF uncertainty NNPDF3.0 ABM11 HERAPDF1.5 MMHT14 (GeV) T Jet p
200 300 400 500 600
(8TeV) dyT dp σ 2d (7TeV) / dyT dp σ 2 d 0 0.2 0.4 0.6 0.8 1 EWK) ⊗ Data/(NP CT10 Theo. prediction CT10 PDF uncertainty CT10 NNPDF3.0 ABM11 HERAPDF1.5 MMHT14
2.0 < |y| < 2.5 CMS
(GeV)
T
Jet p
200 300 400 500 600
Data/Theory
0 0.5 1
1.5 2.0 < |y| < 2.5
CMS
EWK)
⊗
Data/(NP
CT10 Theo. prediction
CT10 PDF uncertainty NNPDF3.0 ABM11 HERAPDF1.5 MMHT14
Figure 7. The ratios of the inclusive jet production cross sections at√s= 7 and 8 TeV shown as
a function of jet pT for the absolute rapidity 1.0<|y|<1.5 (top left), 1.5<|y|<2.0 (top right)
and 2.0<|y|<2.5 (bottom).
the differential inclusive jet production cross section dσ/dpT onαS is given by:
dσ dpT
=α2S(µR) ˆX(0)(µF, pT)[1 +αS(µR)K1(µR, µF, pT)], (8.1)
where αS is the strong coupling, ˆX(0)(µF, pT) represents the LO contribution to the cross
section and K1(µR, µF, pT) is an NLO correction term. A comparison with the measured
spectrum gives an estimate of the input value ofαS for which the cross section, predicted
JHEP03(2017)156
(GeV)
T
Jet p 80 100 200 300 400 500
(8 T e V ) dy T dp σ 2 d (2 .7 6 T e V ) / dy T dp σ 2 d 0 0.02 0.04 0.06 0.08 0.1 0.12 0.14 0.16 Data/NP
[image:16.595.95.483.89.463.2]CT10 Theo. prediction CT10 PDF uncertainty NNPDF3.0 ABM11 HERAPDF1.5 MMHT14
|y| < 0.5
CMS
(GeV)
T
Jet p 80 100 200 300 400 500
(8 T e V ) dy T dp σ 2 d (2 .7 6 T e V ) / dy T dp σ 2 d 0 0.02 0.04 0.06 0.08 0.1 0.12 0.14 0.16 Data/NP
CT10 Theo. prediction CT10 PDF uncertainty NNPDF3.0 ABM11 HERAPDF1.5 MMHT14
|y| < 1.0
≤ 0.5 CMS (GeV) T Jet p
80 100 200 300 400 500
D a ta / T h e o ry 0 0.5 1 1.5 2 2.5 3 3.5
|y| < 0.5
CMS
Data/NP
CT10 Theo. prediction CT10 PDF uncertainty NNPDF3.0 ABM11 HERAPDF1.5 MMHT14 (GeV) T Jet p
80 100 200 300 400 500
D a ta / T h e o ry 0 0.5 1 1.5 2 2.5 3 3.5
|y| < 1.0
≤
0.5
CMS
Data/NP
CT10 Theo. prediction CT10 PDF uncertainty NNPDF3.0 ABM11 HERAPDF1.5 MMHT14
Figure 8. The ratios (top panels) of the inclusive jet production cross sections at √s = 2.76
and 8 TeV are shown as a function of jet pT for the absolute rapidity range |y| <0.5 (left) and 0.5<|y|<1.0 (right). The data (closed symbols) are shown with their statistical (inner error bar) and total (outer error bar) uncertainties. For comparison, the NLO pQCD prediction by using the CT10 PDF is shown with its total uncertainty (light shaded band), while the contribution of the PDF uncertainty is presented by the hatched band. Predictions that use alternative PDF sets are shown by lines of different styles without uncertainties. The data to theory ratios (bottom panels) are shown using the same notations for the respective absolute rapidity ranges.
The extraction of αS is performed by a least squares minimization of the function
χ2(αS(MZ)) =
D−T(αS(MZ))
T
C−1D−T(αS(MZ))
, (8.2)
whereDis the array of measured values of the double-differential inclusive jet cross section for the different bins in pT and |y|, T(αS(MZ)) is the corresponding set of theoretical
cross sections for a given value of αS(MZ), and C is the covariance matrix including all
JHEP03(2017)156
(GeV)
T
Jet p 80 100 200 300 400
(8 T e V ) dy T dp σ 2 d (2 .7 6 T e V ) / dy T dp σ 2 d 0 0.02 0.04 0.06 0.08 0.1 0.12 0.14 Data/NP
CT10 Theo. prediction CT10 PDF uncertainty NNPDF3.0 ABM11 HERAPDF1.5 MMHT14
|y| < 1.5
≤ 1.0 CMS (GeV) T Jet p
80 90100 200 300
(8 T e V ) dyT dp σ 2 d (2 .7 6 T e V ) / dyT dp σ 2 d 0 0.02 0.04 0.06 0.08 0.1 0.12 0.14 Data/NP
CT10 Theo. prediction CT10 PDF uncertainty NNPDF3.0 ABM11 HERAPDF1.5 MMHT14
|y| < 2.0 ≤ 1.5 CMS (GeV) T Jet p
80 100 200 300 400
D a ta / T h e o ry 0 0.5 1 1.5 2 2.5 3 3.5
|y| < 1.5
≤
1.0
CMS
Data/NP
CT10 Theo. prediction CT10 PDF uncertainty NNPDF3.0 ABM11 HERAPDF1.5 MMHT14 (GeV) T Jet p
80 90100 200 300
D a ta / T h e o ry 0 0.5 1 1.5 2 2.5 3 3.5
|y| < 2.0
≤
1.5
CMS
Data/NP
CT10 Theo. prediction CT10 PDF uncertainty NNPDF3.0 ABM11 HERAPDF1.5 MMHT14
Figure 9. The ratios of the inclusive jet production cross sections at √s= 2.76 and 8 TeV shown
as a function of jetpTfor the absolute rapidity ranges 1.0<|y|<1.5 and 1.5<|y|<2.0.
covariance matrixC is built from the individual components as follows:
C=Cstat+Cunfolding+XCJES+Cuncor+Clumi+CPDF+CNP, (8.3)
where:
• Cstat is the statistical covariance matrix, taking into account the correlation between different pT bins of the same rapidity range due to unfolding. Different rapidity
ranges are considered as uncorrelated among themselves;
• Cunfolding includes the uncertainty induced by the JER parameterization in the un-folding procedure;
• CJES includes the uncertainty due to JES uncertainties, obtained as the sum of 24
independent matrices, one for each source of uncertainty;
JHEP03(2017)156
(GeV)
T
Jet p
80 90 100 200
(8 T e V ) dy T dp σ 2 d (2 .7 6 T e V ) / dy T dp σ 2 d 0 0.02 0.04 0.06 0.08 0.1 Data/NP
CT10 Theo. prediction CT10 PDF uncertainty NNPDF3.0 ABM11 HERAPDF1.5 MMHT14
|y| < 2.5 ≤ 2.0 CMS (GeV) T Jet p
80 90 100
(8 T e V ) dyT dp σ 2 d (2 .7 6 T e V ) / dyT dp σ 2 d 0 0.01 0.02 0.03 0.04 150 Data/NP
CT10 Theo. prediction CT10 PDF uncertainty NNPDF3.0 ABM11 HERAPDF1.5 MMHT14
|y| < 3.0 ≤ 2.5 CMS (GeV) T Jet p
80 90 100 200
D a ta / T h e o ry 0 0.5 1 1.5 2 2.5 3 3.5
|y| < 2.5
≤
2.0
CMS
Data/NP
CT10 Theo. prediction CT10 PDF uncertainty NNPDF3.0 ABM11 HERAPDF1.5 MMHT14 (GeV) T Jet p 80 90 100
D a ta / T h e o ry 0 0.5 1 1.5 2 2.5 3 3.5 150
|y| < 3.0
≤
2.5
CMS
Data/NP
CT10 Theo. prediction CT10 PDF uncertainty NNPDF3.0 ABM11 HERAPDF1.5 MMHT14
Figure 10. The ratios of the inclusive jet production cross sections at√s= 2.76 and 8 TeV shown
as a function of jetpTfor the absolute rapidity ranges 2.0<|y|<2.5 and 2.5<|y|<3.0.
• Clumi includes the 2.6% luminosity uncertainty;
• CPDF is related to uncertainties in the PDF used in the theoretical prediction;
• CNP includes the uncertainty due to nonperturbative corrections in the theoretical prediction.
The unfolding, JES, lumi, PDF, and NP systematic uncertainties are considered as 100% correlated among all pT and|y|bins.
The extraction ofαS uses the CT10 NLO PDF set in the theoretical calculation, since
it provides the best agreement with measured cross sections, as shown in section 6. This PDF set provides variants corresponding to 16 differentαS(MZ) values in the range 0.112–
0.127 in steps of 0.001. The sensitivity of the theory prediction to the αS choice in the
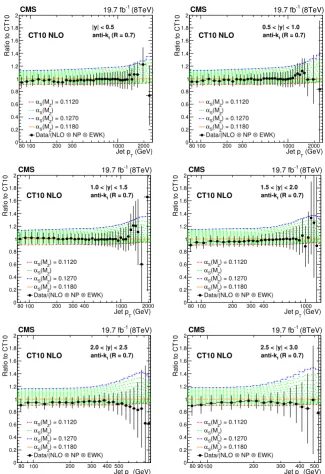
PDF is illustrated in figure 11.
The χ2 in eq. (8.2) is computed, combining all pT and |y| intervals, for each of the
JHEP03(2017)156
(GeV)
T
Jet p
80 100 200 300 1000 2000
Ratio to CT10
[image:19.595.128.454.85.560.2]0 0.2 0.4 0.6 0.8 1 1.2 1.4 1.6 1.8 2
|y| < 0.5
CT10 NLO anti-kt (R = 0.7)
(8TeV) -1 19.7 fb
CMS
) = 0.1120 Z (M S α ) Z (M S α
) = 0.1270 Z (M S α
) = 0.1180 Z (M S α EWK) ⊗ NP ⊗ Data/(NLO (GeV) T Jet p
80 100 200 300 1000 2000
Ratio to CT10
0 0.2 0.4 0.6 0.8 1 1.2 1.4 1.6 1.8 2
0.5 < |y| < 1.0
CT10 NLO anti-kt (R = 0.7)
(8TeV) -1 19.7 fb
CMS
) = 0.1120 Z (M S α ) Z (M S α
) = 0.1270 Z (M S α
) = 0.1180 Z (M S α EWK) ⊗ NP ⊗ Data/(NLO (GeV) T Jet p
80 100 200 300 400 1000 2000
Ratio to CT10
0 0.2 0.4 0.6 0.8 1 1.2 1.4 1.6 1.8 2
1.0 < |y| < 1.5
CT10 NLO anti-kt (R = 0.7)
(8TeV) -1 19.7 fb
CMS
) = 0.1120 Z (M S α ) Z (M S α
) = 0.1270 Z (M S α
) = 0.1180 Z (M S α EWK) ⊗ NP ⊗ Data/(NLO (GeV) T Jet p
80 100 200 300 400 1000
Ratio to CT10
0 0.2 0.4 0.6 0.8 1 1.2 1.4 1.6 1.8 2
1.5 < |y| < 2.0
CT10 NLO anti-kt (R = 0.7)
(8TeV) -1 19.7 fb
CMS
) = 0.1120 Z (M S α ) Z (M S α
) = 0.1270 Z (M S α
) = 0.1180 Z (M S α EWK) ⊗ NP ⊗ Data/(NLO (GeV) T Jet p
80 100 200 300 400 500
Ratio to CT10
0 0.2 0.4 0.6 0.8 1 1.2 1.4 1.6 1.8 2
2.0 < |y| < 2.5
CT10 NLO anti-kt (R = 0.7) (8TeV)
-1
19.7 fb
CMS
) = 0.1120 Z (M S α ) Z (M S α
) = 0.1270 Z (M S
α
) = 0.1180 Z (M S α EWK) ⊗ NP ⊗ Data/(NLO (GeV) T Jet p
80 90100 200 300 400 500
Ratio to CT10
0 0.2 0.4 0.6 0.8 1 1.2 1.4 1.6 1.8 2
2.5 < |y| < 3.0
CT10 NLO anti-kt (R = 0.7)
(8TeV)
-1
19.7 fb
CMS
) = 0.1120 Z (M S α ) Z (M S α
) = 0.1270 Z (M S
α
) = 0.1180 Z (M S α EWK) ⊗ NP ⊗ Data/(NLO
Figure 11. Ratio of data over theory prediction (closed circles) using the CT10 NLO PDF set, with
the default αS(MZ) value of 0.118. Dashed lines represent the ratios of the predictions obtained
with the CT10 PDF set evaluated with differentαS(MZ) values, to the central one. The error bars
correspond to the total uncertainty of the data.
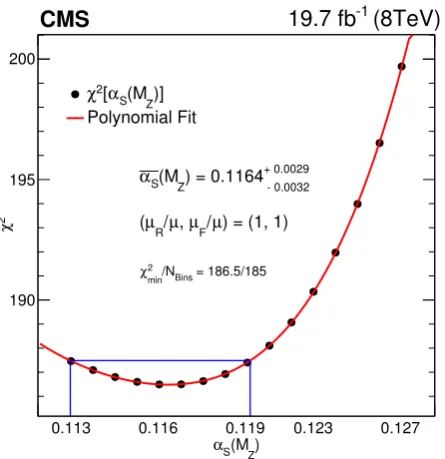
withαS is fitted with a fourth-order polynomial, and the minimum (χ2min) corresponds to
the best αS(MZ) value. Uncertainties are determined using the ∆χ2 = 1 criterion. The
JHEP03(2017)156
)
Z
(M
S
α
0.113 0.116 0.119 0.123 0.127
2
χ
190 195 200
- 0.0032 + 0.0029
) = 0.1164
Z
(M
S α
) = (1, 1)
µ
/
F µ
,
µ
/
R µ
(
= 186.5/185
Bins
/N
min 2
χ
CMS 19.7 fb-1 (8TeV)
)]
Z
(M
S α
[
2 χ
[image:20.595.181.404.85.315.2]Polynomial Fit
Figure 12. The χ2 minimization with respect toαS(MZ) by using the CT10 NLO PDF set and
data from all rapidity bins. The uncertainty is obtained from the αS(MZ) values for which χ2 is increased by one with respect to the minimum value, indicated by the box. The curve corresponds to a fourth-degree polynomial fit through the available χ2 points.
The uncertainties due to the choice of the renormalization and factorization scales are evaluated by variations of the default µR, µF values, set to jet pT, in the following six
combinations: (µR/pT,µF/pT) = (0.5,0.5), (0.5,1), (1,0.5), (1,2), (2,1), and (2,2). The χ2
minimization with respect to αS(MZ) is repeated in each case, and the maximal upwards
and downwards deviations ofαS(MZ) from the central result are taken as the corresponding
uncertainties.
In table 4, the fitted values of αS are presented for each rapidity bin, separately,
and for the whole range. The contribution to the uncertainty due to each individual source is also given, together with the best χ2min value for each separate fit. The largest source of uncertainty in the determination of αS is due to the choice of renormalization
and factorization scales, pointing to the need for including higher order corrections in the theoretical calculations.
The best value obtained, by using the CT10 NLO PDF set, is
αS(MZ)(NLO) = 0.1164+0−0..00250029(PDF) +0.0053
−0.0028(scale)±0.0001(NP) +0.0014
−0.0015(exp)
= 0.1164+0−0..00600043.
Alternatively, the value of αS(MZ) is also determined using the NNPDF3.0 NLO PDF,
resulting in αS(MZ) = 0.1172+0−0..00830075. These values of αS(MZ) are compatible with the
current world average αS(MZ) = 0.1181±0.0011 [52].
The value of αS depends on the scale Q at which it is evaluated, decreasing as Q
increases. The measured pT interval 74–2500 GeV is divided into nine different ranges as
JHEP03(2017)156
|y|bin Fitted αS(MZ) PDF unc. scale unc. NP unc. exp unc. χ2min/NBins
0.0–0.5 0.1155 +0−0..00270027 +0−0..00700026 +0−0..00030003 +0−0..00250025 48.6/37
0.5–1.0 0.1156 +0−0..00250026 +0−0..00690026 +0−0..00030003 +0−0..00260025 28.4/37
1.0–1.5 0.1177 +0−0..00240026 +0−0..00620027 +0−0..00020002 +0−0..00240026 19.3/36
1.5–2.0 0.1163 +0−0..00250029 +0−0..00400019 +0−0..00020002 +0−0..00230027 65.6/32
2.0–2.5 0.1164 +0−0..00200022 +0−0..00460024 +0−0..00020002 +0−0..00190022 38.3/25
2.5–3.0 0.1158 +0−0..00290030 +0−0..00490025 +0−0..00060006 +0−0..00360038 14.3/18
[image:21.595.91.505.103.273.2]Combined 0.1164 +0−0..00250029 +0−0..00530028 +0−0..00010001 +0−0..00140015 186.5/185
Table 4. Results forαS(MZ) extracted using the CT10 NLO PDF set. The fitted value for each|y|
bin; the corresponding uncertainty components due to PDF, scale, and nonperturbative corrections; and the total experimental uncertainty is shown. The last row of the table shows the results of combined fitting of all the|y|bins simultaneously.
Q (GeV)
5 6 7 8 10 20 30 40 100 200 300 1000 2000
(Q)
S
α
0.08 0.1 0.12 0.14 0.16 0.18 0.2 0.22 0.24
-0.0043 +0.0060
) = 0.1164
z
(M
S
α
= 8TeV, s CMS Incl.Jet,
= 8TeV s CMS Incl.Jet,
= 7TeV s ,
32
CMS R
= 7TeV s CMS Incl.Jet ,
= 7TeV s , t CMS t
= 7TeV s CMS 3-Jet Mass , D0 Incl.Jet
D0 Angular Correlation H1
ZEUS
0.0011
±
) = 0.1181
z
(M
S
α
World Avg
CMS
Figure 13. The running αS(Q) as a function of the scale Q is shown, as obtained by using
the CT10 NLO PDF set. The solid line and the uncertainty band are obtained by evolving the extractedαS(MZ) values by using the 2-loop 5-flavour renormalization group equations. The dashed
line represents the evolution of the world average value. The black dots in the figure show the numbers obtained from the √s= 8 TeV inclusive jet measurement. Results from other CMS [53–
[image:21.595.112.461.388.609.2]JHEP03(2017)156
pT range (GeV) Q (GeV) αS(MZ) αS(Q) χ2min/NBins74–133 86.86 0.1171 +0−0..00390060 0.1180 +0−0..00610040 26.04/24
133–220 156.52 0.1159 +0−0..00370061 0.1073 +0−0..00520032 19.47/24
220–300 247.10 0.1161 +0−0..00360062 0.1012 +0−0..00470027 12.39/18
300–395 333.27 0.1163 +0−0..00390064 0.0976 +0−0..00450027 19.48/18
395–507 434.72 0.1167 +0−0..00360061 0.0947 +0−0..00390024 17.12/18
507–686 563.77 0.1170 +0−0..00390064 0.0921 +0−0..00380024 23.25/21
686–905 755.97 0.1171 +0−0..00400070 0.0891 +0−0..00390023 24.76/20
905–1410 1011.02 0.1160 +0−0..00500070 0.0857 +0−0..00370027 24.68/28
[image:22.595.121.477.84.310.2]1410–2500 1508.04 0.1162 +0−0..00620070 0.0822 +0−0..00340031 18.79/14
Table 5. The extractedαS(MZ) values, the correspondingαS(Q) values at theQscale for eachpT
range, andχ2
min/NBins are shown. Uncertainties are given for both αSvalues.
The Qscale corresponding to eachpT range is evaluated as the cross section weighted
average pT for that range. The extracted αS(MZ) values are evolved to the Q scale
cor-responding to the range, using the 2-loop 5-flavour renormalization group (RG) evolution equation, resulting in the αS(Q) values listed in table 5. The same RG equation is used
to obtain the corresponding uncertainties. The contributions to both the experimental and theoretical uncertainties are shown in table 6. A comparison of these results with those from the CMS [53–55], D0 [49,50], H1 [56], and ZEUS [57] experiments is shown in figure 13. The present measurement is in very good agreement with results obtained by previous experiments. The present analysis constrains the αS(Q) running for Q between
86 GeV and 1.5 TeV, which is the highest scale at which αS has been measured, to date.
9 The QCD analysis of the inclusive jet measurements
The CMS inclusive jet measurements at √s= 7 TeV probe the gluon and valence-quark distributions in the kinematic range x >0.01 [29]. In this paper, we use the inclusive jet cross section measurements at √s = 8 TeV for pT > 74 GeV in a QCD analysis at NLO
together with the combined measurements of neutral- and charged-current cross sections of deep inelastic electron (positron)-proton scattering at HERA [13]. The correlations of the experimental uncertainties for the jet measurements and DIS cross sections are taken into account. The DIS measurements and the CMS jet cross section data are treated as uncor-related. The theoretical predictions for the cross sections of jet production are calculated at NLO by using theNLOJet++program [32,33] as implemented into thefastNLO
JHEP03(2017)156
pT range (GeV) PDF unc. scale unc. NP unc. stat unc. syst unc. exp unc.74–133 −+00..00070007 +0−0..00540028 +0−0..00040004 +0−0..00160015 −+00..00200021 +0−0..00260026
133–220 −+00..00090009 +0−0..00560029 +0−0..00030003 +0−0..00080008 −+00..00190019 +0−0..00210021
220–300 −+00..00130013 +0−0..00580028 +0−0..00030003 +0−0..00030003 −+00..00180019 +0−0..00180018
300–395 −+00..00160017 +0−0..00600030 +0−0..00030003 +0−0..00040004 −+00..00160016 +0−0..00170017
395–507 −+00..00180019 +0−0..00560027 +0−0..00030002 +0−0..00070008 −+00..00140014 +0−0..00160016
507–686 −+00..00210022 +0−0..00580029 +0−0..00030002 +0−0..00060007 −+00..00140013 +0−0..00150015
686–905 −+00..00240025 +0−0..00620031 +0−0..00020002 +0−0..00140016 −+00..00150014 +0−0..00210022
905–1410 −+00..00260028 +0−0..00580027 +0−0..00020001 +0−0..00210026 −+00..00170017 +0−0..00270031
[image:23.595.91.510.84.309.2]1410–2500 −+00..00290032 +0−0..00500033 +0−0..00010001 +0−0..00350037 −+00..00190020 +0−0..00400042
Table 6. Composition of the uncertainty in αS(MZ) fit results in ranges of pT. For each range,
the corresponding statistical and experimental systematic uncertainties and the components of the theoretical uncertainty are shown. The numbers are obtained by using the CT10 NLO PDF set.
version 1.1.1, is used with the parton distributions evolved by using the DGLAP equa-tions [60–65] at NLO, as implemented in theqcdnumprogram [66].
The Thorne-Roberts general mass variable flavour number scheme at NLO [37, 67] is used for the treatment of the heavy-quark contributions with the heavy-quark masses mc= 1.47 GeV andmb= 4.5 GeV. The renormalization and factorization scales are set to
Q, which denotes the four-momentum transfer in case of the DIS data and the jet pT in
case of the CMS jet cross sections.
The strong coupling constant is set to αS(MZ) = 0.118, as in the HERAPDF2.0
anal-ysis [13] and following the global PDF analyses, for example, in ref. [39]. The Q2 range of HERA data is restricted to Q2≥Q2min= 7.5 GeV2.
The procedure for the determination of the PDFs follows the approach used in the previous QCD analysis [29] with the jet cross section measurements at√s= 7 TeV replaced by those at 8 TeV. At the initial scale of the QCD evolution Q20 = 1.9 GeV2, the parton distributions are represented by:
xg(x) = AgxBg(1−x)Cg(1 +Egx2)−A0g xB 0
g (1−x)Cg0, (9.1)
xuv(x) = Auvx
Buv(1−x)Cuv(1 +D
uvx+Euvx
2), (9.2)
xdv(x) = Advx
Bdv(1−x)Cdv(1 +D
dvx), (9.3)
xU(x) = AUxBU(1−x)CU(1 +D
Ux), (9.4)
xD(x) = ADxBD(1−x)CD(1 +D
Dx+EDx
2). (9.5)
The normalization parameters Auv, Adv, Ag are determined by the QCD sum rules;
JHEP03(2017)156
describes the shape of the distribution asx→1. A flexible form for the gluon distributionis adopted here, where the (fixed) choice of Cg0 = 25 is motivated by the approach of the MSTW group [37,67]. Additional constraintsBU=BDandAU=AD(1−fs) are imposed
with fs being the strangeness fraction, fs = s/(d + s), fixed to fs = 0.31 ±0.08, as in
ref. [37], consistent with the determination of the strangeness fraction made by using the CMS measurements of W+charm production [68]. Additional D and E parameters allow probing the sensitivity of results on the specific selected functional form. The parameters in eqs. (9.1)–(9.5) are selected by first fitting with allDandEparameters set to zero. The other parameters are then included in the fit one at a time. The improvement inχ2 of the fits is monitored and the procedure is stopped when no further improvement is observed. This leads to an 18-parameter fit.
The PDF uncertainties are estimated in a way similar to the earlier CMS analyses [29,
68] according to the general approach ofHERAPDF1.0[40] in which experimental, model,
and parameterization uncertainties are taken into account. The experimental uncertainties originate from the measurements included in the analysis and are determined by using the Hessian [69] method, applying a tolerance criterion of ∆χ2 = 1. Alternatively, the Monte Carlo method [70,71] to determine the PDF uncertainties is used.
Model uncertainties arise from variations in the values assumed for the charm and bottom quark massesmc andmb, with 1.41≤mc≤1.53 GeV and 4.25≤mb≤4.75 GeV,
following ref. [13], and the value of Q2min imposed on the HERA data, which is varied within the interval 5.0 ≤ Q2
min ≤ 10.0 GeV2. The strangeness fraction fs is varied by its
uncertainty.
The parameterization uncertainty is estimated by extending the functional form of all PDFs with additional parameters. The uncertainty is constructed as an envelope built from the maximal differences between the PDFs resulting from all the parameterization variations and the central fit at each x value.
The total PDF uncertainty is obtained by adding experimental, model, and parameter-ization uncertainties in quadrature. In the following, the quoted uncertainties correspond to 68% confidence level. The global and partial χ2 values for each data set are listed in table 7, where the χ2 values illustrate a general agreement among all the data sets. The somewhat highχ2/Ndof values for the combined DIS data are very similar to those observed
in ref. [13], where they are investigated in detail.
Together with HERA DIS cross section data, the inclusive jet measurements provide important constraints on the gluon and valence-quark distributions in the kinematic range studied. These constraints are illustrated in figures14and15, where the distributions of the gluon and valence quarks are shown at the scales of Q2 = 1.9 and 105GeV2, respectively. The results obtained using the Monte Carlo method to determine the PDF uncertainties are consistent with those obtained with the Hessian method. The uncertainties for the gluon distribution, as estimated by using the HERAPDF method for HERA-only and HERA+CMS jet analyses, are shown in figure 16. The parameterization uncertainty is significantly reduced once the CMS jet measurements are included.
The same QCD analysis has been performed using both the low- and high-pT