Theme 2
Economy and finance
Series Β
Shortterm trends
ISSN 10110844
ECU-EMS information
Price indices in ecu (*)
The aim here is to study the relationship between indices of
national prices expressed in ecus and the same index for
EUR12.
It must be remembered that this index represents the
average of the indices of national prices expressed in ecus
weighted by each Member State's relative share of the final
consumption of households.
Since it is based on
consumption, this index reflects actual transactions (flows
of goods) and thus has sound methodological validity. In
concrete terms, the national index shows the change in
purchasing power, in a specific country, of an individual
purportedly holding a bank account in ecus. As for the
EUR12 index, it shows the change in the average
purchasing power of a European Union citizen holding a
similar account.
During the period from January 1987 to September 1992
the currencies in the EMS were marked by relative stability,
a situation which had been hitherto unknown. Whereas
there had been no fewer than 13 adjustments to realign
currencies in the system between 1979 and 1987 (i.e. one
or two adjustments per year), in the next five years between
1987 and 1992 there was only one minor realignment
affecting the lira, when it joined the narrow bands in the
ERM system.
This stability allowed pressure to build up. Instead of being
eased by frequent but minor parity adjustments as
happened before 1987 it was tackled by radical and
sudden realignment. The discrepancies observed in the
purchasing powers of the various currencies needed to be
remedied; changes in purchasing power were no longer
reflected in the exchange rates.
When the trend in the index of
prices expressed in ecus
in
the various countries of the European Union is considered
(see tables), it can be seen that changes in exchange rates
contributed to the convergence of national indices towards
the EUR12 index.
The indices of Germany, the Benelux countries, Denmark
and France (eg : Table 1) all followed the same pattern:
after a steady downward trend they came to "mirror" the
EUR12 index.
In the case of Spain and the United
Kingdom, the movement of the national index expressed in
ecus towards the EUR12 index (base 100 in 1987) was
even more dramatic (Table 2). Italy and Ireland followed a
different pattern, which prompts the thought that some of
the conditions mentioned in the opening paragraph were
not met during the period under review. The inflation rate
differential was thus not a prime factor in deciding the
exchange rates of their particular currencies (Table 3).
| — F — N L — E U R 12 |
|
{ |j
]
i
| r^ v < C V - H
—
^^øP ■■■·η m i
—UK — E —EUR 12 i |—IRL
-|
- I —EUR 12 |
i
■ [
|
.j¿¿m
.«-^.¿^^1—1—""""^—
τι 1» η
Table 1
Table 2
Table 3
eurostat
OFICINA ESTADÍSTICA DE LAS COMUNIDADES EUROPEAS
DE EUROPÆISKE FÆLLESSKABERS STATISTISKE KONTOR
STATISTISCHES AMT DER EUROPÄISCHEN GEMEINSCHAFTEN
ΣΤΑΤΙΣΤΙΚΗ ΥΠΗΡΕΣΙΑ ΤΩΝ
ΕΥΡΩΠΑΪΚΩΝ ΚΟΙΝΟΤΗΤΩΝ
STATISTICAL OFFICE OF THE EUROPEAN COMMUNITIES
OFFICE STATISTIQUE DES
COMMUNAUTÉS EUROPÉENNES
ISTITUTO STATISTICO DELLE COMUNITÀ EUROPEE
BUREAU VOOR DE STATISTIEK DER EUROPESE GEMEENSCHAPPEN
SERVIÇO DE ESTATÍSTICA DAS COMUNIDADES EUROPEIAS
L2920 Luxembourg Tél. 43 011 Télex COMEUR LU 3423
B1049 Bruxelles, rue de la Loi 200 Tél. 299 11 11
Note
For any
tel.
■*
Fax
information on the statistics ir
352
4301-34674
4301-33288
4301-34150
F.
G.
this bulletin contact
Garcia Valero
Thouvenin
Luxembourg:
Eurostat
Monetary and Financial Statistics,
Jean Monnet Building C3/45
L-2920 Luxembourg
Contents
I.
II.
III.
IV.
V.
VI.
VII.
A graph of the bilateral fluctuations of the ERM currencies.
Yearly and monthly issues of ecu bonds.
EMCF rate, interest rates on ecu deposits and yields on ecu bonds.
Last month's ecu bond issues.
Consumer price indices in national currencies.
Consumer price indices in ecus.
Yearly, monthly and daily ecu exchange rates.
ECSCEECEAEC, Brussels · Luxembourg, 1994
Reproduction is authorized, except for commercial purposes, provided the source is acknowledged.
TABLE I
BILATERAL FLUCTUATIONS OF THE ERM CURRENCIES
3 - r
I I I I I I I I I I I I I I I I I I I I I I I I I I I I I I I I I I I I I I I I I I I I
8
15
22
29
13
20
27
November
December
CENTRAL RATES AND INTERVENTION LIMIT RATES, IN FORCE SINCE 2 AUGUST 1993, FOR
THE CURRENCIES OF COUNTRIES PARTICIPATING IN THE EMS EXCHANGE MECHANISM.
BLF
DKR
DM
PTA
FF
IRL
HFL
ESC
1 ecu =
40.2123
7.43679
1.94964
154.250
6.53883
0.808628
2.19672
192.854
S
C
B
S
C
B
S
C
B
S
C
B
S
C
B
S
C
B
S
C
B
S
C
B
100 BLF =
-21.4747
18.4938
15.9266
5.63000
4.84837
4.17500
445.418
383.589
330.342
18.8800
16.2608
14.0050
2.33503
2.01090
1.73176
6.34340
5.46286
4.70454
556.890
479.590
413.020
100 D K R =
627.880
540.723
465.665
-30.4450
26.2162
22.5750
2408.50
2074.15
1786.20
102.100
87.9257
75.7200
12.6261
10.8734
9.36403
34.3002
29.5389
25.4385
3011.20
2593.24
2233.30
100 D M = !
2395.20 I
2062.55 |
1776.20
:442.968 ·
381.443
328.461
-9191.20
7911.72
6812.00
389.480
335.386
288.810
48.1696
41.4757
35.7143
(130.834)(1
112.673
(97.0325)0
11481.1
9891.77
8517.90
100 PTA =
30.2715
26.0696
22.4510
5.59850
4.82126
4.15190
1:46800
1.26395
1.08800
-4.92260
4.23911
3.65050
0.608731
0.524232
0.451462
1.65368
1.42413
1.22644
145.180
125.027
107.670
100 FF =
714.030
614.977
529.660
132.066
113.732
97.9430
34.6250
29.8164
25.6750
2739.30
2358.98
2031.50
-14.3599
12.3666
10.6500
39.0091
33.5953
28.9381
3424.80
2949.37
2540.00
1 IRL =
57.7445
49.7289
42.8260
10.67920
9.19676
7.92014
2.80000
2.41105
2.07600
221.503
190.755
164.276
9.38950
8.08631
6.96400
-3.15450
2.71662
2.33952
276.938
238.495
205.389
100 H F L =
2125.60
1830.54
1576.45
393.105
338.537
291.544
(103.058)(1
88.7526
(76.4326)0
8153.70
7021.83
6047.10
345.650
297.661
256.350
42.7439
36.8105
31.7007
-10194.30
8779.18
7560.50
100 E S C =
24.2120
20.8512
17.9570
4.47770
3.85618
3.32090
1.17400
1.01094
0.87100
92.8760
79.9828
68.8800
3.93700
3.39056
2.91990
0.486881
0.419295
0.361092
1.32266
1.13906
0.98094
-.
-(1) These buying and selling rates will not be operational. Reflecting a bilateral agreement between the German and the
authorities, the following rates will continue to apply : selling rate Fl. 100 in Frankfurt: DM 90.7700; buying rate Fl. 100
86.7800; selling rate DM 100 in Amsterdam: Fl. 115.235; buying rate DM 100 in Amsterdam Fl. 110.1675.
The Greek drachma, the Pound Sterling and the Italian Lira do not participate in the exchange mechanism.
TABLE II
ECU BOND ISSUES (Mio ECU) '
1988 1989 1990 1991 1992 1993
1992
1993 II III IV I II III IV October December
TOTAL
9 248 11 127 15 040 27 163 19 242 6 870
7 585 1 375
80
1 980 1 130 1 070 2 690
750 1 940
0
Total
5 335 6 461 10 525 19 266 11 675
5 020
4 663 880
80
1 480 630 770 2 140 250 1 890
0
European Business
sector
3 390 4 400 3 990 6 581 4 870 1 565
1 388 280
80
300 130 720 415 250 165 0
Community
Govern-ments
100 500 5 000 7 900 2 475 250
2 075 0 0
0 250 0 0 0 0 0
Insti-tutions
1 845 1 561 1 535 4 785 4 330 3 205
1 200 600
0
1 180 250 50 1 725
0 1 725
0
Non-European Community Total
3 9 1 3 4 666 4 5 1 5 7 897 7 567 1 850
2 922 495
0
500 500 300 550 500 50 0
Business sector
3 138 4 141 3 565 3 932 3 902 250
1 572 480
0
0 0 200 50 0 50 0
Govern-ments
575 425 550 3 790 2 850 1 600
750 0 0
500 500 100 500 500 0 0
Insti-tutions
200 100 400 175 815 0
600 15 0
0 0 0 0 0 0 0
(*) Recording based on the payment date
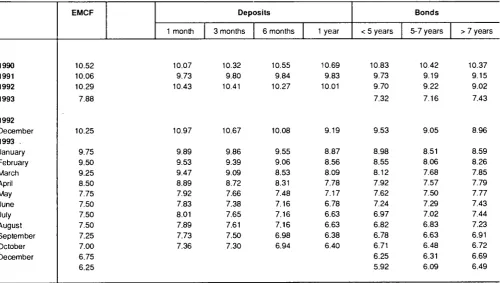
TABLE III
OPERATIONS RATES OF THE EMCF (CALCULATION MONTH, APPLICABLE THE FOLLOWING MONTH) AND INTEREST RATES AND YIELDS OF ECU INVESTMENTS (%)
1990 1991 1992 1993
1992 December 1993 . January February March April May June July August September October December
EMCF Deposits
1 month
10.52 10.07 10.06 9.73 10.29 10.43
7.88
10.25 10.97
9.75 9.89 9.50 9.53 9.25 9.47 8.50 8.89 7.75 7.92 7.50 7.83 7.50 8.01 7.50 7.89 7.25 7.73 7.00 7.36 6.75
6.25
3 months
10.32 9.80 10.41
10.67
9.86 9.39 9.09 8.72 7.66 7.38 7.65 7.61 7.50 7.30
6 months
10.55 9.84 10.27
10.08
9.55 9.06 8.53 8.31 7.48 7.16 7.16 7.16 6.98 6.94
1 year
10.69 9.83 10.01
9.19
8.87 8.56 8.09 7.78 7.17 6.78 6.63 6.63 6.38 6.40
Bonds < 5 years
10.83 9.73 9.70 7.32
9.53
8.98 8.55 8.12 7.92 7.62 7.24 6.97 6.82 6.78 6.71 6.25 5.92
5-7 years
10.42 9.19 9.22 7.16
9.05
8.51 8.06 7.68 7.57 7.50 7.29 7.02 6.83 6.63 6.48 6.31 6.09
> 7 years
10.37 9.15 9.02 7.43
8.96
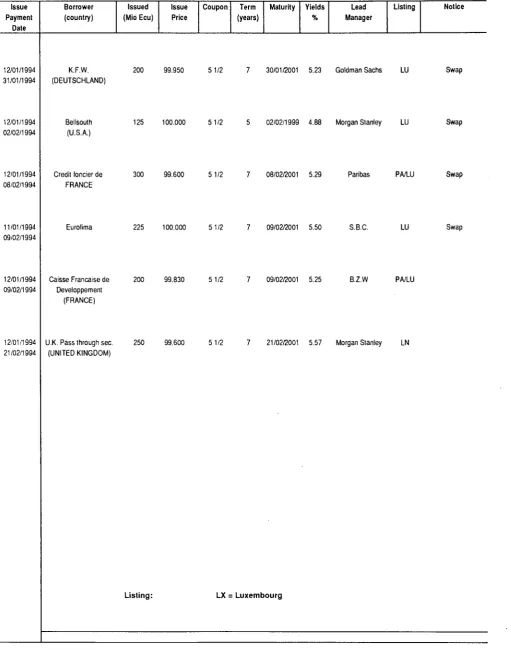
TABLE IV
LAST MONTH'S ECU BOND ISSUES
Issue Payment
Date
Borrower (country)
Issued (Mio Ecu)
Issue Price
Coupon Term (years)
Maturity Yields
%
Lead Manager
Listing Notice
12/01/1994 31/01/1994
12/01/1994 02/02/1994
12/01/1994 08/02/1994
11/01/1994 09/02/1994
12/01/1994 09/02/1994
12/01/1994 21/02/1994
K.F.W. (DEUTSCHLAND)
Bellsouth (U.S.A.)
Credit foncier de FRANCE
Eurolima
Caisse Française de Développement
(FRANCE)
U.K. Pass through sec. (UNITED KINGDOM)
200 99.950 51/2 7 30/01/2001 5.23 Goldman Sachs LU
125 100.000 51/2 5 02/02/1999 4.88 Morgan Stanley LU
300 99.600 5 1/2 7 08/02/2001 5.29 Paribas PA/LU
225 100.000 5 1/2 7 09/02/2001 5.50 S.B.C.
Listing:
LU
200 99.830 5 1/2 7 09/02/2001 5.25 B.Z.W PA/LU
250 99.600 5 1/2 7 21/02/2001 5.57 Morgan Stanley LN
LX = Luxembourg
Swap
Swap
Swap
TABLE V
CONSUMER PRICE INDICES IN NATIONAL CURRENCY
1985=100 B DK D ELL E F IRL I L NL Ρ UK
EUR 12 ERM 1980 71.2 68.3 82.6 39.1 56.2 63.3 56.1 52.5 70.3 81.8 35.2 70.7 65.3 66.7
1990 1987
111.0 102.9 121.2 107.8 107.0 100.1 222.6 143.2 136.8 114.5 116.3 105.9 117.6 107.1 131.8 110.9 109.0 100.2 104.3 99.8 170.9 122.2 133.3 107.7
123.0 106.9 116.9 104.7
1988 104.1 112.7 101.4 162.5 120.0 108.7 109.4 116.5 101.7 100.6 133.9 113.0 110.7 107.6 1989 107.3 118.1 104.2 184.9 128.2 112.7 113.9 123.7 105.1 101.7 150.8 121.8 116.4 111.9 1990 111.0 121.2 107.0 222.6 136.8 116.3 117.6 131.8 109.0 104.3 170.9 133.3 123.0 116.9 1991 114.6 124.1 110.7 264.7 145.0 120.0 121.3 140.2 112.4 108.4 189.5 141.1 129.1 122.4
1992 1993
05
117.3 120.1 126.7 128.5 115.1 119.8 308.1 351.2 153.5 159.5 123.0 125.7 125.1 126.1 147.4 153.2 115.9 119.7 112.5 114.5 206.7 218.6 146.4 149.2
134.6 138.9 127.2 131.0
06 120.1 128.4 120.0 355.1 159.9 125.5 126.1 154.2 119.8 114.2 219.1 149.0 139.1 131.1 07 120.9 128.2 120.2 348.3 160.5 125.7 126.1 154.9 120.2 115.0 220.6 148.7 139.3 131.1 08 121.4 128.4 120.2 349.8 161.5 125.7 126.1 155.3 120.6 115.5 221.5 149.4 139.6 131.8 09 121.2 128.8 120.3 358.5 162.4 126.1 127.3 154.7 120.7 116.0 222.2 150.0 140.0 131.4 10 121.4 129.2 120.6 365.4 163.0 126.4 127.3 155.8 121.1 116.2 223.5 149.9 140.4 133.4 11 121.7 129.1 121.1 371.9 164.0 126.4 127.8 156.6 121.6 115.7 225.6 150.0 140.8 133.6
Annual rate of increase (%)
Β DK D ELL E F IRL I L NL Ρ UK
EUR 12
ERM EUR 12 ERM EUR 12 ERM 71-80 7.4 9.8 5.1 14.5 15.4 9.7 13.7 14.1 6.7 7.4 18.7 13.8 9.9 8.4 3.5 3.0 4.8 3.3
81-90 1987
4.6 1.6
5.9 4.0 2.6 0.2 19.0 16.1
9.3 5.3 6.3 3.1 7.8 3.1
9.7 4.8 4.5 -0.1
2.5 -0.2
17.3 9.4
6.6 4.1
6.6 3.4 5.4 2.4
2.4 1.9
2.5 1.8
4.1 3.8
2.9 2.8 1988 1.2 4.6 1.2 13.5 4.8 2.7 2.1 5.1 1.4 0.9 9.6 4.9 3.6 2.7 1.8 1.4 2.8 1.9 1989 3.1 4.8 2.8 13.8 6.8 3.7 4.1 6.2 3.3 1.1 12.6 7.8 5.1 4.0 2.2 1.4 Dis ρ 4.1 2.9 1990 3.4 2.6 2.7 20.4 6.7 3.2 3.2 6.5 3.7 2.5 13.3 9.4 5.7 4.5 Avéra 2.7 1.8 arity bet 3.5 2.3 1991 3.2 2.4 3.5 18.9 6.0 3.2 3.1 6.4 3.1 3.9 10.9 5.9 5.0 4.7
ge devi;
1.8 1.4
ween th
2.7 2.3
1992 1993
05
2.4 2.7 2.1 1.0 4.0 4.2 16.4 16.4 5.9 4.6 2.5 2.0 3.1 0.9 5.1 4.2 3.1 3.5 3.8 2.2 9.1 5.7 3.8 1.3
4.3 3.3 4.1 3.3
¡tion around the mea
1.2 1.5 0.9 1.1
e average and the n
2.3 2.4 2.0 2.4
TABLE VI
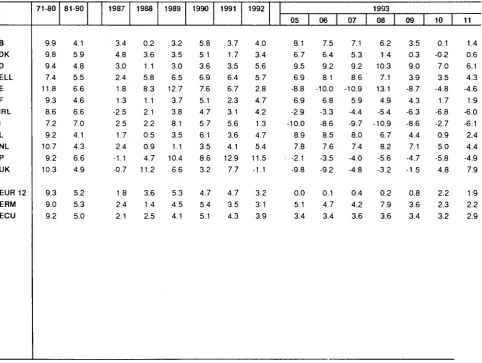
CONSUMER PRICE INDICES IN ECU
1985=100
Β DK D ELL E F IRL I L NL Ρ UK EUR 12 ERM ECU 1980 78.7 70.0 72.9 68.6 72.7 73.1 58.5 63.8 77.7 74.4 65.8 69.7 70.9 71.3 71.71990 1987
117.5 107.3 123.7 109.7 116.1 107.6 114.9 95.3 136.4 103.9 114.3 103.8 109.3 98.5 125.2 107.2 115.4 104.6 113.2 107.3 122.6 97.7 110.0 90.0 117.8 103.1 119.0 106.5 117.0 104.3 1988 107.6 113.7 108.8 100.9 112.5 105.0 100.6 109.6 105.2 108.2 102.3 100.2 106.8 108.0 106.9 1989 111.1 117.7 112.1 107.5 126.8 108.9 104.4 118.5 108.8 109.4 112.9 106.6 112.5 112.9 111.3 1990 117.5 123.7 116.1 114.9 136.4 114.3 109.3 125.2 115.4 113.2 122.6 110.0 117.8 119.0 117.0 1991 121.9 125.8 120.2 122.2 145.5 116.9 112.7 132.2 119.6 117.8 138.4 118.5 123.3 123.2 122.0
1992 1993
05 126.7 134.2 130.1 137.2 126.9 136.4 129.8 137.8 149.6 139.6 122.3 129.6 117.4 112.5 133.9 123.7 125.2 133.8 124.2 131.1 153.8 153.9 117.3 111.7 127.2 128.2 127.0 137.7 126.8 130.5 06 134.2 137.5 136.6 138.7 137.2 129.5 112.5 125.6 133.8 130.7 152.8 111.9 128.4 137.1 130.5 07 134.8 136.0 137.2 135.7 135.2 128.5 111.8 124.5 134.0 131.6 150.5 115.2 128.5 135.6 130.8 08 133.9 131.4 139.3 135.2 132.3 127.0 110.7 123.4 133.0 134.2 146.6 115.7 128.4 140.4 132.7 09 132.6 131.9 140.1 136.2 135.9 128.1 110.9 121.0 132.1 135.7 147.2 114.2 128.5 133.6 131.1 10 131.4 134.3 140.8 137.6 136.7 128.3 112.2 121.0 131.1 136.2 147.2 114.0 128.7 129.9 131.5 11 133.5 135.8 140.2 139.4 135.9 128.8 113.5 120.4 133.5 135.3 148.9 115.6 128.9 130.1 131.6
Annual rate of increase (%)
Β DK D ELL E F IRL I L NL Ρ UK EUR 12 ERM ECU 71-80 9.9 9.8 9.4 7.4 11.8 9.3 8.6 7.2 9.2 10.7 9.2 10.3 9.3 9.0 9.2
81-90 1987
4.1 3.4 5.9 4.8 4.8 3.0 5.5 2.4 6.6 1.8 4.6 1.3 6.6 -2.5 7.0 2.5 4.1 1.7 4.3 2.4 6.6 -1.1 4.9 -0.7 5.2 1.8 5.3 2 4
5.0 2.1
1988 0.2 3.6 1.1 5.8 8.3 1.1 2.1 2.2 0.5 0.9 4.7 11.2 3.6 1.4 2.5 1989 3.2 3.5 3.0 6.5 12.7 3.7 3.8 8.1 3.5 1.1 10.4 6.6 5.3 4.5 4.1 1990 5.8 5.1 3.6 6.9 7.6 5.1 4.7 5.7 6.1 3.5 8.6 3.2 4.7 5.4 5.1 1991 3.7 1.7 3.5 6.4 6.7 2.3 3.1 5.6 3.6 4.1 12.9 7.7 4.7 3.5 4.3
1992 1993
05 4.0 3.1 3.4 6.7 5.6 9.5 5.7 6.9 2.8 -8.8 4.7 6.9 4.2 -2.9 1.3 -10.0 4.7 8.9 5.4 7.8 11.5 -2.1 -1.1 -9.8 3.2 0.0 3.1 5.1
3.9 3.4
TABLE VII
ECU EXCHANGE RATES
1985 1986 1987 1988 1989 1990 1991 1992 1993 92/12 93/01 93/02 93/03 93/04 93/05 93/06 93/07 93/08 93/09 93/10 93/11 93/12 12/01 12/02 12/03 12/06 12/07 12/08 12/09 12/10 12/13 12/14 12/15 12/16 12/17 12/20 12/21 12/22 12/23 12/24 12/27 12/28 12/29 12/30 12/31 B/LFR 44.9137 43.7979 43.0410 43.4285 43.3806 42.4257 42.2233 41.5932 40.4713 40.3034 40.3106 40.0504 39.9768 40.1018 40.1919 40.2060 40.2940 40.7313 41.0548 41.4857 40.8884 40.3146 40.5572 40.5821 40.5242 40.4051 40.2531 40.2992 40.3421 40.3721 40.3598 40.3971 40.3054 40.3264 40.2547 40.2155 40.1756 40.1328 40.2500 40.2696 40.2198 40.2092 40.2320 40.2657 40.2869
DKR
8.01877 7.93565 7.88472 7.95152 3.04929 7.85652 7.90859 7.80925 7.59359 7.58077 7.55583 7.45955 7.45371 7.48447 7.51093 7.49122 7.55659 7.83353 7.83300 7.71285 7.63939 7.56812 7.60210 7.59589 7.59232 7.59071 7.59709 7.58101 7.55650 7.54529 7.56906 7.56582 7.57029 7.56237 7.56373 7.57018 7.56490 7.55835 7.55648 7.55891 7.55239 7.55247 7.55694 7.55083 7.55310DM
2.22632 2.12819 2.07153 2.07440 2.07015 2.05209 2.05076 2.02031 1.93639 1.95898 1.95815 1.94224 1.94079 1.94816 1.95497 1.95633 1.95094 1.92126 1.91165 1.90647 1.91956 1.93091 1.92219 1.92329 1.92603 1.92684 1.92974 1.93002 1.93113 1.92895 1.92691 1.93148 1.93225 1.93001 1.92999 1.93341 1.93431 1.93409 1.93423 1.93330 1.93337 1.93359 1.93421 1.93587 1.93569DRA
105.739 137.425 156.268 167.576 178.840 201.412 225.216 247.026 268.568 259.052 261.628 260.773 263.171 265.453 265.225 266.402 266.971 269.231 273.811 276.322 274.968 276.996 275.894 276.093 276.496 276.825 276.956 276.399 276.150 275.748 276.285 276.688 276.740 276.769 277.205 277.352 277.302 277.449 277.828 277.589 277.665 277.818 277.635 278.044 277.970ESC
130.252 147.088 162.616 170.059 173.413 181.109 178.614 174.714 188.370 175.856 176.237 177.036 179.401 180.714 184.557 186.246 190.384 196.343 196.052 197.089 196.356 158.437 196.547 196.511 196.884 197.091 196.546 196.620 196.823 197.101 197.669 196.756 196.974 197.225 197.114 197.197 197.494 197.581 197.749 197.830 197.083 197.303 197.075 196.667 197.050FF
HFL
IRL
EXPLANATORY NOTES
Bilateral currency deviation (graph on page 3).
The various curves should be compared in pairs. To find the
differential between two currencies, subtract the (positive or
negative) values along the y-axis corresponding to each
currency.
The graph is drawn with the curve of the strongest currency
above that of the weakest. It shows therefore the relative
position of each currency vis-à-vis the other currencies.
When two curves intersect or merge over a period of time there
is no differential between the two currencies and their market
exchange rate equals their bilateral central rate.
The graph is drawn within a horizontal band corresponding to the
maximum 15% margin of fluctuation applying at any given
moment to market exchange rates and the bilateral central rates
of the ERM currencies. This band is divided symmetrically by a
horizontal axis along which the points would be plotted if all
currencies were at their bilateral central rate and there were
therefore no fluctuations.
The daily market exchange rates of all currencies are compared
with the relevant bilateral central rates and the differentials
between the two calculated.
The maximum fluctuation between two currencies is shown
within the band, symmetrical with the horizontal axis. The
fluctuations of the other currencies in relation to either of the two
currencies in question are shown within the maximum
permissible fluctuation.
The curves are drawn by linking the daily points showing the
relative positions of each currency.
Exchange rate grid (Table I).
The intervention limit rates fixed in the official grid do not always
correspond exactly to + or -15 % of the central rates, since for
each currency pair (whose exchange rates are inversely
proportional to one another) the lower limit of the one
corresponds to the upper limit of the other.
Ecu bond issues (Table II
&
IV).
In table II, issues are recorded as at the payment date. This
bulletin only covers international and foreign issues in ecus,
including ecu issues offering the option of conversion into other
currencies. Main source: International Financing Review
Table II shows, under the headings:
-Business sector and Governments: national issuers, both
private and public.
-Institutions: the European Investment Bank and the
Commission of the European Communities (EEC, ECSC,
Euratom).
-Organizations: the specialist institutions of the United Nations,
the World Bank, the Council of Europe, etc
Table IV shows detailled information of the latest known issues,
whatever the payment date.
Interest rates and yields on ecu investments (Table III).
The interest rates for 1, 3 and 6 month and 1 year deposits are
calculated on the basis of the Friday London market rates
(source: Financial Times, London Money Rates, ECU Linked
Deposit Bid).
The bonds are classified according to three types of maturities:
under 5 years, from 5 to 7 years and more than 7 years. The
redemption yields of ecu bonds are calculated each Wednesday
from
a
sample of fixed interest bonds, denominated in ecus and
listed on the Luxembourg Stock Exchange. These yields are
weighted by the amounts in circulation, (source: Luxembourg
Stock Exchange).
The monthly and yearly averages are the arithmetic means of
these weekly interest rates and bond yields.
Operations rates of the EMCF (Table III).
The interest rate for transactions in EMCF (European Monetary
Cooperation Fund) ecus, is the weighted average of the most
representative rates on the domestic money market of the
countries whose currencies make up the ecu basket. It is based
on the weighting of the currencies in the ecu basket as derived
from the ecu central rates in force. The rate thus calculated for a
given month applies to EMCF transactions for the following
month. In table 3, this rate relates to the month upon which the
calculations are based and not to the (following) month during
which it is used by the EMCF.
Consumer price indices in national currency (Table V).
The consumer price indices in the national currency of each
country measure changes in the purchasing power of one unit of
national currency spent in the country concerned.
Two composite indices are calculated, covering all the Member
States of the Community (EUR 12) and the nine Member States
with currencies participating in the European Monetary System
exchange rate mechanism (ERM). (Although the peseta has
been participating in the exchange rate mechanism since
19/06/89 and has been included in the calculation of the ecu
since 21/09/89, it is only taken into account in the indices
relating to the ERM which are included in this bulletin for data
after 30/09/89.)
These indices are calculated as weighted arithmetic means
(chain indices) of the national indices, the weighting for each
Member Stale being its relative share in the final consumption of
households of the group of countries in question (EUR 12,
ERM), expressed in purchasing power standards, at current
prices and purchasing power parities.
Consumer price indices in ecus (Table VI),
For each country the index of consumer prices in ecus is
calculated by dividing the national consumer price index by the
average movement of the national currency in relation to the ecu
during the month. It measures the change in the purchasing
power of one ecu in the country concerned.
Three composite indices are calculated, covering all the Member
States of the Community (EUR 12 and ECU), the 9 Member
States participating in the European Monetary System exchange
rate mechanism (ERM). (Although the peseta has been
participating in the exchange rate mechanism since 19/06/89 and
has been included in the calculation of the ecu since 21/09/89, it
is only taken into account in the indices relating to the ERM which
are included in this bulletin for data after 30/09/89.)
These three indices are calculated as weighted arithmetic means
(chain-indices). The weightings are defined as follows: for the
EUR 12 and ERM indices, the relative share of each Member
State in the final consumption of households for the group of
countries in question (EUR 12 or ERM), expressed in ecus at
current prices and exchange rates (annual weighting). For the
ECU index, the relative share of each Member State's currency in
the calculation of the ecu (monthly weighting).
Ecu exchange rates (Table VII).
The exchange rates for the ecu against the national currencies of
the Member States of the Community, the USD and yen are
shown as annual averages, monthly averages (for the current
year), and daily rates (for the latest available month).
1f!CU =
1 Ί 0 =
BFR
3.301
40.2123
8.21
DKR
DM
DRA*
ESC
FF
HFL
IRL
LFR
LIT*
PTA
From 21/09/89 the ecu basket has been made up as follows
:
0.1976 0.6242 1.44 1.393 1.332 0.2198 0.008552 0.13 151.8 6.885
Ecu central rates from 14/05/93
7.43679 1.94964 264.513 192.854 6.53883 2.19672 0.808628 40.2123 1793.19 154.250
Weights of currencies on 14/05/93, calculated on the basis of current central rates, expressed in
% :
2.66 32.02 0.54 0.72 20.37 10.01 1.06 0.32 8.47 4.46
UKL*
0.08784
0.786749
11.16
' toes not participate in the exchange rate mechanism.
Venta y suscripciones * Salg og abonnement · Verkauf und Abonnement · Πωλήσεις και συνδρομές
Sales and subscriptions · Vente et abonnements · Vendita e abbonamenti
Verkoop en abonnementen * Venda e assinaturas
BELGIQUE / BELGIË FRANCE
Moniteur belge / Belgisch Staatsblad
Rue de Louvain 42 / Leuvenseweg 42 B1000 Bruxelles / B1000 Brussel Tél. (02) 512 00 26
Fax (02) 511 01 84 Autres distributeurs / Overige verkooppunten
Librairie e u r o p é e n n e / Europese boekhandel
Rue de la Loi 244/Wetstraat 244 B1040 Bruxelles / B1040 Brussel Tél. (02) 231 04 35
Fax (02) 735 08 60
Jean De Lannoy
Avenue d u Roi 202 /Koningslaan 202 B1060 B r u x e l l e s / B1060 Brussel Tél. (02) 538 51 69
Télex 63220 U N B O O K Β Fax (02) 538 08 41
Document delivery: Credoc
Rue de la Montagne 34 / Bergstraat 34 Bte 11 / Bus 11
B1000 B r u x e l l e s / B 1 0 0 0 Brussel Tél. (02) 511 69 41
Fax (02) 513 31 95
DANMARK
J . H. Schultz Information A/S Herstedvang 1012
DK2620 Albertslund Tlf. 43 63 23 00 Fax (Sales) 43 63 19 69 Fax (Management) 43 63 19 49
DEUTSCHLAND B u n d e s a n z e i g e r V e r l a g Breite Straße 7880 Postfach 10 05 34 D50445 Köln Tel. (02 21) 20 290
Telex ANZEIGER BONN 8 882 595 Fax 2 02 92 78
GREECE/ΕΛΛΑΔΑ G.C. E l e f t h e r o u d a k i s SA International Bookstore Nikis Street 4 GR10563 Athens Tel. (01) 322 63 23 Telex 219410 ELEF Fax 323 98 21
ESPANA
B o l e t í n Oficial d e l E s t a d o Trafalgar. 29
E28071 Madrid Tel. (91) 538 22 95 Fax (91)538 23 49
Mundi-Prensa Libros, SA Castellò. 37
E28001 Madrid
Tel. (91) 431 33 99 (Libros) 431 32 22 (Suscripciones) 435 36 37 (Dirección) Télex 49370MPLIE Fax (91)575 39 98 Sucursal:
Librería Internacional AEDOS
Consejo de Ciento, 391 E08009 Barcelona Tel. (93) 488 34 92 Fax (93) 487 76 59 L l i b r e r i a d e la G e n e r a l i t ä t de C a t a l u n y a
Rambla deis Estudis. 118 (Palau Moja) E08002 Barcelona
Tel. (93) 302 68 35 302 64 62 Fax (93) 302 12 99
Journal officiel Service des publications des C o m m u n a u t é s européennes
26. rue Desaix F75727 Paris Cedex 15 Tél. (1) 40 58 75 00 Fax (1) 40 58 77 00
TURKIYE
IRELAND
Government Supplies Agency
45 Harcourt Road Dublin 2 Tel. (1) 66 13 111 Fax (1) 47 80 645
ITALIA L i c o s a SpA
Via Duca di Calabria 1/1 Casella postale 552 150125 Firenze Tel. (055) 64 54 15 Fax 64 12 57 Telex 570466 LICOSA I
GRANDDUCHÉ DE LUXEMBOURG M e s s a g e r i e s d u livre
5, rue Raiffeisen L2411 Luxembourg Tél. 40 10 20 Fax 40 10 24 01
NEDERLAND
S D U O v e r h e i d s i n f o r m a t i e Externe Fondsen Postbus 20014 2500 EA 'sGravenhage Tel. (070) 37 89 880 Fax (070) 34 75 778
PORTUGAL I m p r e n s a N a c i o n a l Casa da Moeda, EP
Rua D. Francisco Manuel de Melo, P1092 Lisboa Codex
Tel. (01) 69 34 14 D i s t r i b u i d o r a d e L i v r o s B e r t r a n d , L d . ' G r u p o B e r t r a n d , SA
Rua das Terras dos Vales, 4A Apartado 37
P2700 Amadora Codex Tel. (01) 49 59 050 Telex 15798 BERDIS Fax 49 60 255
UNITED KINGDOM
H M S O B o o k s ( A g e n c y s e c t i o n ) HMSO Publications Centre 51 Nine Elms Lane London SW8 5DR Tel. (071) 873 9090 Fax 873 8463 Telex 29 71 138
ÖSTERREICH M a n z ' s c h e V e r l a g s
u n d U n i v e r s i t ä t s b u c h h a n d l u n g Kohlmarkt 16
A1014 Wien Tel. (0222) 531 610 Telex 112 500 B O X A Fax (0222) 531 61339
SUOMI/FINLAND A k a t e e m i n e n K i r j a k a u p p a Keskuskatu 1
PO Box 128 SF00101 Helsinki Tel. (0) 121 41 Fax (0) 121 44 41
Narvesen Info Center
Bertrand Narvesens vei 2 PO Box 6125 Etterstad N0602 Oslo 6 Tel. (22) 57 33 00 Telex 79668 NIC N Fax (22) 68 19 01
SVERIGE
BTJ AB
Traktorvägen 13 S22100 Lund Tel. (046) 18 00 00
Fax (046) 18 01 25 30 79 47
SCHWEIZ / SUISSE / SVIZZERA
OSEC
Stampfenbachstraße 85 CH8035 Zürich Tel. (01) 365 54 49 Fax (01) 365 54 11
CESKA REPUBLIKA
NIS ÒR Havelkova 22 130 00 Praha 3 Tel. (2) 24 23 09 07 Fax (2) 242 21 484
MAGYARORSZAG E u r o I n f o S e r v i c e Club Sziget Margitsziget 1138 Budapest Tel./Fax 1 111 60 61
1 111 62 16
B u s i n e s s F o u n d a t i o n ul. Krucza 38/42 00512 Warszawa
Tel. (22) 21 99 93. 6282882 International Fax&Phone
(039) 120077
Euromedia
65, Strada Dionisie Lupu 70184 Bucuresti Tel./Fax 0 12 96 46
BÄLGARIJA
E u r o p r e s s K l a s s i c a BK Ltd
66, bd Vitosha 1463 Sofia Tel./Fax 2 52 74 75
C C E C
9.60letiya Oktyabrya Avenue 117312 M o s c o w
Tel./Fax (095) 135 52 27
CYPRUS
C y p r u s C h a m b e r of C o m m e r c e a n d
Industry
Chamber Building 38 Grivas Dhigenis Ave 3 Deligiorgis Street PO Box 1455 Nicosia
Tel. (2) 449500/462312 Fax (2) 458630
MALTA
Miller distributors Ltd
Scots House, M.A. Vassalli street PO Box 272
Valletta
Tel. 24 73 01/22 29 95 Fax 23 49 14
Pres Gazete Kitap Dergi
Pazarlama Dagitim Ticaret ve s a n a y i
AS
Narlibahçe Sokak N. 15 IstanbulCagaloglu
Tel. (1) 520 92 96 528 55 66 Fax ( 1 ) 2 5 1 91 97
Telex 23822 DSVOTR
ROY International
PO Box 13056
41 Mishmar Hayarden Street Tel Aviv 61130
Tel. 3 648 60 39 Fax 3 544 60 39
UNITED STATES OF A M E R I C A / CANADA
U N I P U B
4611F Assembly Drive Lanham. MD 207064391 Tel. Toll Free (800) 274 4888 Fax (301) 459 0056
' CANADA Subscriptions only Uniquement abonnements Renouf P u b l i s h i n g C o . Ltd 1294 A l g o m a Road Ottawa, Ontario K1Β 3W8 Tel. (613) 741 43 33 Fax (613) 741 54 39 Telex 0534783
AUSTRALIA H u n t e r P u b l i c a t i o n s 58A Gipps Street Collingwood Victoria 3066 Tel. (3) 417 5361 Fax (3) 419 7154
JAPAN
K i n o k u n i y a C o m p a n y Ltd 177 Shinjuku 3Chome Shinjukuku
Tokyo 16091 Tel. (03) 34390121 J o u r n a l D e p a r t m e n t PO Box 55 Chitóse
Tokyo 156
Tel. (03) 34390124
SOUTHEAST ASIA Legal L i b r a r y S e r v i c e s Ltd
STK Agency Robinson Road PO Box 1817 Singapore 9036
SOUTH AFRICA
Safto
5th Floor. Export House Cnr Maude & West Streets Sandton 2146
Tel. (011) 8833737 Fax (011) 8836569
AUTRES PAYS OTHER COUNTRIES ANDERE LÄNDER
O f f i c e d e s p u b l i c a t i o n s o f f i c i e l l e s d e s C o m m u n a u t é s e u r o p é e n n e s 2, rue Mercier
L2985 Luxembourg Tél. 499 281
Price (excl. VAT) in Luxembourg: Single copy ECU 11 · Subscription: ECU 79
; * ;
OFICINA DE PUBLICACIONES OFICIALES DE LAS COMUNIDADES EUROPEAS IQCM 1 ("H -I ÍIQ/l/t
KONTORET FOR DE EUROPÆISKE FÆLLESSKA8ERS OFFICIELLE PUBLIKATIONER lOOlM I U I I -\JÖ<W
AMT FÜR AMTLICHE VERÖFFENTLICHUNGEN DER EUROPÄISCHEN GEMEINSCHAFTEN ΥΠΗΡΕΣΙΑ ΕΠΙΣΗΜΩΝ ΕΚΔΟΣΕΩΝ ΤΩΝ ΕΥΡΩΠΑΪΚΩΝ ΚΟΙΝΟΤΗΤΩΝ
OFFICE FOR OFFICIAL PUBLICATIONS OF THE EUROPEAN COMMUNITIES OFFICE DES PUBLICATIONS OFFICIELLES DES COMMUNAUTÉS EUROPÉENNES UFFICIO DELLE PUBBLICAZIONI UFFICIALI DELLE COMUNITÀ EUROPEE BUREAU VOOR OFFICIËLE PUBLIKATIES DER EUROPESE GEMEENSCHAPPEN SERVIÇO DAS PUBLICAÇÕES OFICIAIS DAS COMUNIDADES EUROPEIAS