White Rose Research Online URL for this paper:
http://eprints.whiterose.ac.uk/125222/
Version: Accepted Version
Article:
Johnston, R.J., Pattie, C.J. orcid.org/0000-0003-4578-178X, Hartman, T. et al. (3 more
authors) (2017) Scotland's electoral geography differed from the rest of Britain's in 2017
(and 2015) - exploring its contours. Scottish Geographical Journal. ISSN 1470-2541
https://doi.org/10.1080/14702541.2017.1409362
[email protected] https://eprints.whiterose.ac.uk/ Reuse
Items deposited in White Rose Research Online are protected by copyright, with all rights reserved unless indicated otherwise. They may be downloaded and/or printed for private study, or other acts as permitted by national copyright laws. The publisher or other rights holders may allow further reproduction and re-use of the full text version. This is indicated by the licence information on the White Rose Research Online record for the item.
Takedown
If you consider content in White Rose Research Online to be in breach of UK law, please notify us by
For Peer Review Only
! " # $
!
! " # $ % # & " & '
For Peer Review Only
Scotland’s Electoral Geography Differed from the Rest of Britain’s in 2017
(and 2015) – Exploring its Contours
ABSTRACT. The rapid expansion in support for the Scottish National Party between the 2010 and 2015 general elections substantially changed the country’s electoral geography, as again did its relative decline at the next election in 2017.At that last contest, however, the SNP won many seats with fewer than 40 per cent of the votes cast, a situation very different from that in the rest of Great Britain. That difference – which had a considerable impact on the formation of a government in June 2017 – came about because of the nature of the competition in individual seats.
KEY WORDS: general elections, electoral geography, party competition, Scotland
1. Introduction
The 2015 and 2017 general elections both saw major changes to Scotland’s electoral geography, changes that differed substantially from those in the rest of Great Britain and which indirectly influenced the electoral outcomes. The Scottish National Party (SNP) increased its share of
Scotland’s votes from 19.9 per cent in 2010 to exactly 50.0 per cent in 2015, winning all but three of the country’s 59 House of Commons seats. Just two years later, that vote share fell to 36.9 per cent, and the SNP won 35 of the 59 seats. In seventeen of those it had the support of less than 40 per cent of voters – a situation that characterised the winning party in only five of the 572 seats in England and Wales; almost all English and Welsh MPs elected in 2017 had the support of at least 45 per cent of their constituents who voted compared to less than one-fifth of all Scottish MPs. Furthermore, whereas only 12 per cent of English and Welsh constituencies returned an MP with a majority of five percentage points of less, similar small majorities characterised 37 per cent of Scotland’s
constituencies then. This paper explores those significant differences between Scotland and the rest of Great Britain, identifies tactical voting as a possible cause of the shifts away from the SNP in many seats, and comments on the impact of the result in Scotland on the nature of the UK government formed in June 2017.
2. From Votes to Seats: Duverger’s Law
The UK’s first-past-the-post (fptp, or plurality) electoral system is widely known for producing both disproportional and biased election outcomes, whereby a party’s overall share of the votes cast is very often incommensurate with its allocation of seats. In Scotland, for example, the SNP won 19.9 per cent of the votes in 2010 but only six (10.7 per cent) of the seats. As clearly demonstrated in Gudgin and Taylor’s (1979) classic study of Seats, Votes, and the Spatial Organisation of Elections, such disproportionality is a function of geography, of not only how many votes a party wins but also, and crucially, the location of those votes. Three elements of the geography of a party’s support interact in that function: the degree to which its supporters are congregated in particular places; the degree to which those places are concentrated within larger areas; and the network of
constituencies superimposed on those geographies. A party whose supporters are evenly distributed across a country may win few, if any, seats – for example, UKIP won 12.9 per cent of the votes in Great Britain in 2015, but had only one MP elected. Another party with its support more spatially concentrated might perform better in the translation of votes into seats but still not obtain a commensurate share of the seats: at the 2015 election, for example, Plaid Cymru won 12.1 per cent of the votes cast in Wales, with more than 20 per cent of the votes cast in just seven of the forty
For Peer Review Only
constituencies, but only three of its candidates were elected (7.5 per cent of the total). As both Gudgin and Taylor (1979) and Johnston and Rossiter (1983) have shown, within any large area the same level and geography of support for a party can lead to different outcomes in the allocation of seats depending on the placement of constituency boundaries.
Disproportionality in a party’s shares of the votes and seats as a function of those three geographical components is a common characteristic of polities characterised as two-party systems. Its nature and production are particularly complex in multi-party systems where more than two parties are relatively strong competitors not only for votes but also for seats. One of political science’s longest-lasting empirical generalisations – Duverger’s law (Duverger, 1954; Grofman et al., 2009) – stipulates that there is a strong tendency for polities using fptp to be dominated by two parties, with smaller parties rarely allocated legislative seats in a number commensurate with their vote share; support for ‘third parties’ is squeezed. But how such two-party systems emerge can vary not only between but also within polities, as illustrated here – a situation that accounts for Scotland’s particularity at the 2017 UK general election.
3. The British Polity Before 2015: Changing Party Systems and Regional Duverger’s Law
For the first 25 years after the Second World War the British polity had all the characteristics of a two-party system. The Conservative and Labour parties together won the great majority of the votes cast (a minimum of 87.5 per cent in 1964 and maximum of 96.8 per cent in 1951) and even greater percentages of the seats – 621 of the 630 seats in 1964 and 616 of the 625 in 1951 (98.6 per cent in both cases).1 This hegemony changed at the first of the 1974 elections, much more so in the vote totals than in seats: the two parties’ combined vote share fell to 74.9 per cent, but they still won 598 of the 635 constituency contests. Their predominance in the competition for votes was further eroded from then on, with some slight variations at individual elections, by growing support both for the Liberal party and its successors and for the Scottish and Welsh nationalist parties. Those parties’ electoral successes had their own geographies and exemplifications of Duverger’s law.
The Liberal Democrats’ increased voter support was never commensurate with their number of seats won;2 nevertheless, the geography of that increased support significantly altered not only their relative success in electing MPs but also how the British party system operated under Duverger’s law: the third party’s’ vote share was squeezed, but it was a different third party in different parts of the country. In the 1980s and 1990s the Liberal Democrats’ success was focused on blocks of constituencies in areas where the Conservative party predominated – mainly in the south of England, where Labour was pushed into a poor third place in many constituencies. The
Conservative and Labour candidates occupied the first two places in 286 constituencies at the 2010 election, averaging 37.3 and 37.8 per cent of the vote shares respectively; the Liberal Democrats occupied a poor third place, averaging 17.1 per cent of the votes (Johnston and Pattie, 2011). Most of those seats were in London, northern England, and Wales. In another 205 constituencies, however, Conservative and Liberal Democrat candidates occupied the first two places; half of them were in the Southeast and Southwest regions and most of the remainder in the East and the East Midlands. Labour came a poor third there, with a mean vote percentage of only 12.7, compared to 48.8 and 32.0 for the Conservatives and Liberal Democrats respectively.
1
These data are taken from House of Commons Library (2017a). Detailed sources of voting at each
constituency were obtained for the 2010 and 2015 general elections from Kavanagh and Cowley (2010) and Cowley and Kavanagh (2015); for 2017 they are taken from House of Commons Library (2017b).
2
Until the early 1980s, the Liberals were the third party in British politics. At the 1983 and 1987 General Elections, they formed an electoral alliance with the Social Democratic Party, which had split from Labour in 1981. The two Alliance partners merged in 1988 to form the Liberal Democrats.
For Peer Review Only
A third group of constituencies, 94 in 2010 with most of them located in either London or the main metropolitan centres of northern and midland England, had Labour and the Liberal Democrats occupying the first two places. The Liberal Democrats performed well there among younger and, in general, educationally more qualified voters who supported the party’s opposition to the Iraq War and (top-up) university fees. The party’s mean vote share in those 94 seats of 29.7 per cent compared to Labour’s 44.6 per cent – with the Conservatives occupying the squeezed Duvergian poor third place with an average of only 16.9 per cent.
Although some analysts characterised British – really English and Welsh – politics as a three-party system in the twenty-first century’s first decade, geographically it was represented by three separate two-party systems, therefore, the main exception being the eight Welsh constituencies where Plaid Cymru candidates occupied one of the first two places in 2010 (Johnston and Pattie, 2011). That all changed at the next two elections – 2010 and 2015 – as it did too in Scotland.
Four parties won seats in Scotland in 2010, but there were several separate two-party systems at the constituency scale, although not all of these, nor their geographies, were as clearly demarcated as those in England and Wales. As Table 1 shows, in each of the nine constituency types defined by which parties filled the first two places, those that came first and second predominated with at least 60 per cent of the votes. Except for the two seats won by the SNP with Labour in second place, however, the two parties occupying the third and fourth places together gained between one-fifth and one-third of the votes – there was less ‘squeezing’ of the smaller parties than in England and Wales. Geographically, although the constituencies in several of the types shown in Table 1 were concentrated in parts of Scotland there was quite a spatial spread. Most of the seats won by the Liberal Democrats were in relatively rural and remote parts of Scotland, for example, but they also won Edinburgh West and East Dunbartonshire; and although four of the SNP’s six victories were in rural north-eastern seats, the party also won Dundee East (the urban constituency held by the party’s leader – Gordon Wilson – in 1974, 1979 and 1983), and Na h-Eileann an Iar.
4. The 2015 Election: Stability in the Party System’s Core but Major Change in its Periphery
The 2015 general election saw considerable change to both the party system and the UK’s electoral geographies – changes that largely came about outwith the core of the long-standing party system. In terms of United Kingdom vote share, little changed for the Conservatives and Labour: they won 37.0 and 29.7 per cent of the votes respectively in Great Britain in 2010, and 37.8 and 31.2 per cent in 2015, with few seats changing hands (the Conservatives lost ten seats to Labour, and gained eight). But much changed in the party periphery (Johnston, Pattie and Manley, 2017). Carrying much opprobrium for entering a coalition with the Conservatives and then abandoning some of the policies on which they were elected, the Liberal Democrats’ vote share fell from 23.6 to 8.1 per cent, and they lost 49 of their 57 seats – 27 in England and Wales to the Conservatives and ten to Labour. That collapse was so extensive that in many constituencies they were relegated to third or fourth place. In England and Wales they came second to the Conservative candidate in 167 seats in 2010 and to Labour’s in a further 72; five years later the comparable figures were 46 and 9.
The Liberal Democrats’ decline was only partly matched by UKIP’s increase; from 3.2 per cent of the votes in Great Britain in 2010 to 12.9 per cent in 2015. But those votes were fairly evenly distributed across the country: UKIP won only one seat, and although it came second to the Conservatives in 76 constituencies and to Labour in 44, it was at least 10 percentage points behind the winner in virtually all of them. The result was fewer marginal constituencies than at any previous UK general election since 1945 and more safe Conservative and Labour seats (Johnston, Pattie and Rossiter, 2017).
For Peer Review Only
More safe seats, because of a major change in voting preferences, also characterised Scotland, where the SNP won half of the votes and all but three of the 59 seats. The Conservatives were already weak there, reflecting their declining popularity since the Thatcher governments: their vote share fell by 1.8 percentage points and they retained their one seat. The Liberal Democrats’ UK-wide unpopularity characterised Scotland too: their vote share fell from 18.8 to 7.5 per cent, and ten of the eleven seats won in 2010 were lost. Almost all of the gains went to the SNP (UKIP’s vote share increased from 0.7 to 1.6 per cent only), and with half of the votes it won all but three seats – an exaggerated example of the disproportionality that can emerge in fptp systems with such a vote share depending on the geographies of party support. Further, all but six of the SNP’s 56 MPs won with a majority of 10 percentage points or more. But Labour’s was the most dramatic decline in Scotland. In 2010, it returned 41 of the country’s 59 MPs and increased its vote share over 2005 (the only region in the UK where it did so) by 2.5 percentage points to 42.0 per cent. In 2015 its share fell to 24.3 per cent, and it returned just one Scottish MP.
5. And 2017: Scotland Was Different
The 2017 general election was held one year after the UK – but neither Scotland nor Northern Ireland – voted to leave the European Union. It was called by a Conservative Prime Minister seeking to enhance her mandate before the Brexit negotiations and obtain a substantial House of Commons majority that would sustain her government as it introduced the needed legislation to the House of Commons. The gamble failed: the Conservatives lost their majority, and Labour gained a substantial number of seats (Ross and McTague, 2017).
In Scotland, the SNP suffered a very significant loss of support – from half of the votes in 2015 to 36.9 per cent in 2017. It retained 35 of its 56 seats, however, because of the geographies of its support and those of its competitors – and in so doing made the incoming Conservative government’s position more difficult than it otherwise might have been.
Almost all of England and Wales – the main exception was the small number of Welsh seats where Plaid Cymru performed well – returned to the predominant two-party system that had apparently ended in the 1970s. The Liberal Democrats’ vote share fell again, slightly, and although they regained a small number of seats held before the 2015 collapse they did not present a major challenge to either the Conservatives or Labour. They came second in only 28 constituencies won by the Conservatives and seven won by Labour. UKIP’s vote share collapsed: many seats were
uncontested (206 of the 573 in England and Wales and 49 of Scotland’s 59: see Johnston et al., 2017) and the party won more than 10 per cent of the votes in only two – Thurrock (20.1) and Hartlepool (11.5). A considerable number of former UKIP voters switched to Labour rather than to the
Conservatives. (Indeed, many more UKIP supporters in 2010 switched to Labour than either commentators or the parties expected. The Conservatives targeted many Labour-held marginal seats, hoping to convince those who voted Brexit – a majority in most cases – to vote for the party that was implementing a ‘hard Brexit’, but many instead voted against their austerity plans for pensions and schools and for Labour’s proposals to invest more in public services.) Consequently, Labour held almost all its marginal seats and won many of those the Conservatives were defending. Both won larger vote shares than at previous contests: Labour’s 40 per cent was its best
performance since the two Blair landslides of 1997 and 2001; the Conservatives hadn’t exceeded 43.2 per cent since 1979.
The main changes in vote shares in Scotland were the fall in the SNP’s percentage from 50.0 in 2015 to 36.9 two years later, and the comparable increase in the Conservatives’ share – from 14.9 to 28.6: Labour’s share increased slightly (from 24.3 to 27.1) and the Liberal Democrats’ fell (from 7.5 to 6.8). Much of the Scottish campaign focused on independence. The SNP leader, Nicola Sturgeon,
For Peer Review Only
indicated that the ‘hard Brexit’ the Prime Minister was seeking would probably result in the SNP administration in the Scottish Parliament seeking a second referendum on independence once the outcome of the negotiations with the EU was known, to allow Scottish voters a say on their future – presented by the SNP as an independent Scotland remaining within the European Union. This was vigorously opposed by the other three parties, which argued that the electorate did not want another referendum. The SNP lost 21 seats, very much because of that campaign, including 12 to the Conservatives.
Although the three pro-union parties all gained seats at its expense, nevertheless the SNP retained a considerable number with relatively low vote shares, and by small majorities. Seventeen were won with less than 40 per cent of the votes and eight by a majority of less than one percentage point – the SNP candidate retained North East Fife by a margin of just two votes over his Liberal Democrat rival.
6. From Votes to Seats in Two-Party and Multi-Party Systems
The SNP won 59 per cent of Scotland’s seats in 2017 with just under 37 per cent of the votes, therefore, a highly disproportionate outcome (a ratio of seats to votes of 1.59, though of course much smaller than the ratio of 1.89 in 2015 when half of the votes delivered 94.9 per cent of the seats). By comparison, in England and Wales in 2017 the Conservatives won 53 per cent of the seats with 44.8 per cent of the votes (a ratio of 1.18) and Labour’s ratio was even smaller at 1.05 (44.5 per cent of the seats and 42.3 per cent of the votes).
In England, where there was a stable two-party system at most of the elections since the Second World War, Figure 1a shows a consistent pattern of seats:votes ratios. The two largest parties both had ratios exceeding 1.0 at most contests, with the winning party having the largest (compare the wide gap between the Conservative and Labour ratios favouring the former between 1983 and 1992 with that favouring Labour between 1997 and 2001), whereas the small third party had a ratio of less than 0.1 until 1992, when its greater success at winning seats initiated an increase, although the Liberal Democrats’ ratio never exceeded 0.4 and rapidly declined in 2015 and 2017. This relatively consistent picture is very different from that for Scotland (Figure 1b). As the increasingly
predominant party until 2010 Labour had high ratios, whereas the Conservatives’ declining popularity saw their ratios diminish as they became one of the three relatively small opposition parties between 1987 and 2010. (Over those six elections, the Conservatives averaged 19.2 per cent of the votes cast, the Liberal Democrats 17.2 and the SNP 19.2.) Ratios close to 1.0 were rare for those parties then – only the Liberal Democrats achieved it. The 2015 election saw the SNP’s ratio exceed even Labour’s greatest achievement, with the other three getting very poor returns – Labour with 24.3 per cent of the votes won only a single seat. And then, although the gap closed somewhat in 2017, the fptp system’s operation continued to favour the SNP very substantially. The reason for this is illustrated in Tables 2 and 3, which indicate the percentage of seats won by each party according to its constituency vote shares at each of the last three elections.
In a two-party system, the existence of only relatively small ‘third parties’ means that a large party can expect to win in a constituency where it gains at least 45 per cent of the votes, but very few where its share is less than that. This was clearly the case in England and Wales in 2017: both the Conservatives and Labour won most constituencies where they obtained 45-49 per cent of the votes, but not in those where they gained less (Table 2). That situation differed substantially from the preceding two elections, when the Liberal Democrats and UKIP provided fairly strong competition in many seats. In 2010, for example, the Conservatives won 69 of the 80 seats where they gained 40-44 per cent of the votes and 29 of the 65 where their tally was 30-34 per cent (Table 2); Labour similarly
For Peer Review Only
won a majority of the seats where its vote share then was 35-39 per cent, though the Liberal Democrats did not (Johnston et al., 2012).
Four parties returned Scottish MPs in 2017, with each winning seats with less than 35 per cent of the votes there; the SNP won more seats than it lost with such percentages (Table 3). Those successes with little more than one-third of the votes reflected a ‘divided opposition’ across the other three parties. As Table 1 shows, in all three groups of seats won by the SNP in 2017 the third-placed party averaged over 20 per cent of the votes and the third- and fourth-placed together as much as 34 per cent – a very different situation from the preceding election when the third-placed party in SNP-won seats averaged only around 10 per cent of the votes.
There was some discussion, though little formal pressure, suggesting that those opposed to the SNP’s policies, particularly on a second independence referendum, should vote for the party best-placed to defeat it in their constituency (on the campaigns, especially through social media, see Ross and McTague, 2017). If this occurred, the concentration of anti-SNP votes on one party could bring about its defeat there. But this seems not to have happened to a sufficient degree to bring that about in many constituencies. This can be illustrated by using the entropy measure of unevenness in a distribution (H) to assess the degree to which the non-SNP vote was concentrated on one party in a constituency. With this measure, the larger its negative value the more even the spread of those votes across parties other than the SNP: the smaller the negative value, the more they were concentrated on a single party.3
Figure 2 graphs the SNP’s share of the votes in each of Scotland’s 59 constituencies in 2017 against the entropy measure, separately identifying the seats it won and lost. It won all but one of the seats where it gained more than 40 per cent of the votes (it didn’t obtain 50 per cent or more in any, compared to 2015 when it exceeded half of the votes cast in 25 constituencies). The exception was the constituency in that group with the smallest entropy value – Glasgow North East: Labour won with 42.9 per cent of the votes to the SNP’s 42.2, a margin of 242; the Conservatives got 12.9 per cent and the Liberal Democrats 2.0 in what had been a traditional Labour safe seat – and where neither of the latter parties achieved a substantial improvement on their 2015 performance.
Among the constituencies where the SNP got between 35 and 39 per cent of the votes, Figure 2 shows that it lost in the four with the smallest entropy values and won the five with the largest. Three of the first four – Moray, Banff & Buchan, and Angus – were won by the Conservatives with over 45 per cent of the votes in each case and with Labour and the Liberal Democrats together gaining no more than 16 per cent: the fourth – Coatbridge, Chryston & Belshill – was a Labour gain with 42.2 per cent. In the five with the highest entropy scores (all held by the SNP with 35-39 per cent of the votes) – Dunfermline & West Fife, East Kilbride, Strathaven & Lesmahagow, Falkirk, Argyll & Bute, and Glasgow North – the third- and fourth-placed parties together won 30.6, 28.3, 28.3, 30.8, and 18.2 per cent of the votes respectively. (In addition, a Green party candidate won 9.7 per cent of the votes in Glasgow North.) Between those two extreme groups with relatively low and high entropy values respectively, the SNP won in all but five seats: three of those five were won with majorities of less than 300, indicative of how a small difference in the distribution of votes across the opposition parties made a difference between victory and defeat for the SNP in such contests.
Finally, the SNP won three seats with less than 35 per cent of the votes. All had relatively high entropy scores and were, in effect, three-party contests where the SNP prevailed by a small margin. In Edinburgh North & Leith it won 34.0 per cent of the votes to Labour’s 31.2 and the Conservatives’ 27.2; in North East Fife the SNP won 33.0 per cent and the Liberal Democrats 33.0 per cent, and the
3
The formula for the entropy measure is Hj = – Σ ( Pij* Log Pij) where Pij is the proportion of voters (other than those who voted SNP) who voted for party i in constituency j and Hj is the entropy value for constituency j.
For Peer Review Only
Conservatives 24.3; and in Lanark & Hamilton East the SNP, Conservatives and Labour got 32.6, 32.1 and 31.9 per cent of the votes respectively.
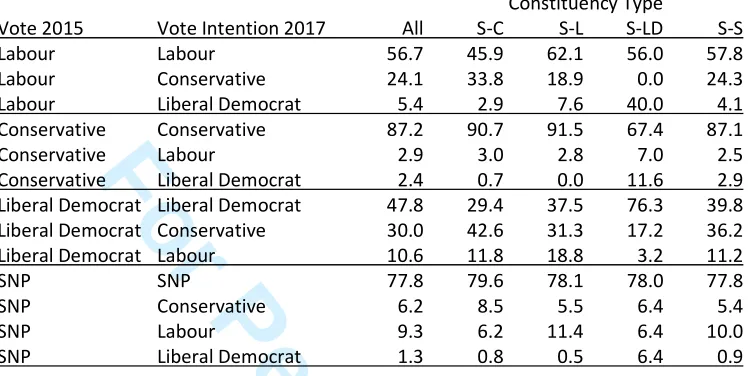
These results suggest that there was probably tactical voting focused on one of the three other parties in the seats that the SNP lost, with voters who supported one of those other three in 2015 opting in 2017 for the party they considered best able to defeat the SNP in their constituency. This is illustrated by Table 4, which is based on a data set combining a number of polls conducted by YouGov in the last week of the campaign, in which voters were asked how they voted in 2015 and how they intended to vote in 2017.4 The figures there show the percentages of respondents who voted for the named party in the first column according to their 2017 vote intention for the second-named party, in Scotland as a whole (the column headed ‘All’), the constituencies lost by the SNP to the Conservatives, Labour and the Liberal Democrats respectively (the next three columns), and the constituencies retained by the SNP. Thus, for example, across Scotland Labour retained the support of 56.7 per cent of those who voted for it in 2015, but 62.1 per cent in the seats that it won from the SNP.
In virtually every case shown the pattern of shifts between 2015 vote and 2017 vote intention is consistent with the argument that there was tactical voting, with people shifting their support to the party most likely to defeat the SNP candidate locally.5 Whereas across Scotland as a whole, 24.1 per cent of Labour’s 2015 voters shifted to the Conservatives, in seats where the Conservatives won it was 33.8 per cent; similarly, only 5.4 per cent nationally shifted from Labour to the Liberal
Democrats but in the three seats won by the latter from the SNP that increased to 40 per cent. Very similar patterns occurred with Liberal Democrat voters in 2015: only 47.8 per cent remained loyal to the party in 2017 across Scotland as a whole, but 76.3 per cent in the three constituencies where they gained control; and more switched to the Conservatives and Labour respectively in seats that they won from the SNP than was the case nationally. The only substantial exception to this pattern was with flows from Conservative voting in 2015 to intending to vote Labour in 2017: the percentage making that shift was no larger in the seats won by Labour than across all seats – but there was a much larger (almost five times) shift from the Conservatives to the Liberal Democrats in the three seats won by the latter than nationally, and a compensating much smaller percentage of
Conservative voters in 2015 remaining loyal two years later. Finally, there were slightly more defections from the SNP to the Conservatives and Labour respectively in the seats that they won than nationwide, and a substantially (five-times) larger flow from the SNP to the Liberal Democrats in the three that changed hands between those two parties.
This pattern of differential flows between the parties is consistent with tactical voting and suggests that voters wishing to see their local SNP candidate defeated either calculated for themselves which other party had the best chance of doing that, and intended to vote accordingly, or were
encouraged to do so by the latter party’s canvassers. Some of the differentials were not large, however, suggesting that such tactical considerations influenced only a small proportion of the electorate. Nevertheless, that the entropy values shown in Figure 2 were much smaller in some constituencies than others suggests that tactical voting probably contributed to the SNP’s defeat in at least some of the constituencies lost. Further, given the small majorities for many of the SNP candidates who retained their seats – eight won by less than one percentage point, and a further seven by between one and five points – it is likely that more (and not substantially more) tactical
4
We are grateful to Prof Ben Lauderdale for providing us with these data. 5
The British Election Study data allow a cross-tabulation of how respondents actually voted in 2017 as well as 2015, but because of a smaller sample size (i.e. of those surveyed at both dates) many of the cells in the flow-of-the-vote tables (disaggregated by constituency type) are too small to give robust estimates of the pattern. However, for those where the sample size if sufficiently large to give reasonable estimates the pattern of flows mirrors that shown in Table 4.
For Peer Review Only
voting by those who wished to punish the SNP complement of MPs reduced even further without it losing any more electoral support, such is the sensitivity of the translation of votes into seats to even minor shifts in the distribution of votes across the parties.
The result of these shifts was a new electoral geography, though its contours were not entirely clear-cut. (One clear feature was that the SNP came either first or second in every seat.) Figure 3 shows two main clusters of seats comprising those with Conservative MPs plus those with SNP MPs and the Conservatives in second place – along the English border, and in the north-east (where the SNP won three of its six seats in 2010). The seats contested by the SNP and Labour were concentrated in the central belt, extending into the Highlands and Islands region, but Labour won only one seat in its traditional Glasgow heartland (where it lost control of the City Council at the local government elections in May 2017) as against three in Edinburgh and the Lothians. The SNP-Liberal Democrat contests were widely dispersed.
7. Discussion
Against the early expectations from the polls and its own hopes the Conservative party failed to win a majority at the 2017 UK general election. It was the largest party in terms of number of MPs by a considerable margin – 55 more than Labour – but needed to enter a formal agreement with the Northern Ireland Democratic Unionist Party to ensure that it could carry its major policies through the House of Commons.
The result in Scotland had a considerable influence on that outcome. Many post-election commentators pointed to the Conservative party’s revival there – it last won at least 13 seats in Scotland in 1983 – and the important role played by its Scottish leader, Ruth Davidson. Without that surge in support and, more importantly, MPs a better performance by either the SNP or/and Labour would have substantially reduced the Conservatives’ lead in the House of Commons, making it more difficult to operate as a minority government. As it is, the thirteen Scottish Conservative MPs are committed to a less ‘hard’ version of Brexit than the government was promoting before the election,6 and they could have a significant influence on the negotiations.
It might have been different. The Conservatives came second to the SNP in a further seven seats, losing each by a majority of less than ten percentage points, five by less than three points. All but one of those had relatively high negative entropy values: they were constituencies where the third- and also sometimes the fourth-placed parties performed relatively well.7 If further small numbers of voters there had expressed their opposition to the SNP by voting for the Conservative rather than the Labour or Liberal Democrat candidate, Theresa May could have gained seven more seats and with a total of 324 been very close to an overall Commons majority.8 Such an outcome would have required more tactical voting than the available data suggest. In most of those seven seats some of the third- and fourth-placed parties’ supporters could have ensured a Conservative victory if they had voted otherwise. In the recent past the probability of Labour supporters switching to the Conservatives has been low – reflecting negative attitudes across Scotland to the Conservatives that were accentuated from the 1980s on – but the voting intention data analysed here show that
6
See their manifesto at http://www.scottishconservatives.com/wordpress/wp-content/uploads/2017 /05/GE2017_Manifesto_A5_Scottish_DIGITAL.pdf (accessed 30 June 2017)
7
The seven, in order of majority starting with the smallest, were: Perth & North Perthshire; Lanark & Hamilton East; Edinburgh Southwest; Argyll & Bute; Central Ayrshire; North Ayrshire & Arran; and Inverness, Nairn, Badenoch & Strathspey.
8
With 650 MPs, and with the Speaker independent and not voting, 625 is needed for a majority, but as Sinn Féin MPs (of which there are currently seven) do not take their seats, 322 seats would in effect constitute a majority.
For Peer Review Only
considerable numbers did in 2017. Labour’s vote share changed relatively little across most Scottish constituencies between 2015 and 2017, but several of those in which it declined substantially – Aberdeen South, Dumfries & Galloway, Ochil & South Perthshire, and Renfrewshire East (covering areas where the Conservatives traditionally performed well before the 1980s) – were seats in which the Conservatives narrowly defeated the SNP. (The largest decline in the Liberal Democrats’ vote share – a drop of 21.1 percentage points – was in Gordon, where the Conservatives unseated the former SNP First Minister, Alex Salmond.) Conservative voters in 2015 were apparently reluctant to switch to Labour in 2017, however. Labour came second to the SNP by less than one percentage point in three seats, for example; the Conservatives averaged 20 per cent of the votes cast there so if a further small number of them had switched to Labour to defeat the SNP this could have significantly impacted on the outcome not only in those constituencies but also in the composition of the House of Commons.
The development of the three two-party systems in England and Wales after 1992 owed much to tactical voting, mainly involving Labour and Liberal Democrat supporters. The pattern of voting in Scotland in 2017 suggests that it was less pronounced there – which may reflect one or both of stronger loyalties to a party whatever its local electoral chances alongside the lack of a tradition of tactical voting, including its mobilisation by the political parties and their allies.
8. Conclusions
Scotland played an important part in determining the political outcome of the 2017 general election. Without the revival of the Conservative party there and its defeat of SNP candidates in twelve of the 59 constituencies, Theresa May would have found it more difficult to retain the position of Prime Minister leading a minority government sustained in confidence and supply motions by the Democratic Unionists. But Scotland could have played an even more important part in determining the balance of the parties in the House of Commons. A slightly different pattern of (tactical?) voting across a few constituencies could have increased the complement of Scottish Conservative MPs by at least half, and ensured a (very small) majority Conservative government; but another slightly different pattern could have seen more Labour MPs returned. That neither occurred reflects the detailed geography of party competition. The SNP retained its hold on several seats not so much because of its own support – which collapsed very substantially in most places – but rather because the anti-SNP vote was split between two, if not three, of its competitors. Gudgin and Taylor (1979) described three-party situations as the Achilles Heel of the plurality electoral system. These analyses of Scotland’s four-party situation at the 2017 general election clearly illustrate why.
References
Cowley, P. & Kavanagh, D. (2015) The British General Election of 2015 (Basingstoke; Palgrave Macmillan).
Duverger, M. (1954) Political Parties. Their Organisation and Activity in the Modern State (London: Methuen).
Grofman, B., Blais, A. & Bowler, S. (2009) Duverger’s Law of Plurality Voting: the Logic of Party Competition in Canada, India, the United Kingdom and the United States (New York: Springer).
Gudgin, G. & Taylor, P. J. (1979) Seats, Votes, and the Spatial Organization of Elections (London: Pion).
For Peer Review Only
House of Commons Library (2017a) UK Election Statistics 1918-2017 (London: House of Commons Library, Briefing Paper 7529).
House of Commons Library (2017b) General Election 2017: Results and Analysis (London: House of Commons Library, Briefing Paper 7979).
Johnston, R. J., Borisyuk, G. Thrasher, M. & Rallings, C. (2012) Unequal and unequally distributed votes: the sources of electoral bias at recent British general elections, Political Studies, vol. 60, pp. 877-898.
Johnston, R. J. & Pattie, C. J. (2011) The British general election of 2010: a three-party contest or three two-party contests? The Geographical Journal, vol. 177, pp. 17-26.
Johnston, R. J., Pattie, C. J. & Manley, D. (2017) Britain’s changed electoral map in and beyond 2015: the importance of geography, The Geographical Journal, vol. 183, 58-70.
Johnston, R. J., Pattie, C. J. & Rossiter, D. J. (2017) A re-dividing nation? A newly polarized electoral geography of Great Britain, British Politics, vol. 12, 521-535.
Johnston, R. J. & Rossiter, D. J. (1983) Constituency building, political representation and electoral bias in urban England. In D. T. Herbert and R.J. Johnston (eds.) Geography and the Urban Environment, Volume 3 (Chichester: John Wiley), pp. 113-156.
Johnston, R. J., Rossiter, D. J., Manley, D., Pattie, C. J., Hartman, T. & Jones, K. (2017) Coming full circle: the 2017 UK general election and the changing electoral map, The Geographical Journal, doi 10.1111/geoj.122240
Kavanagh, D. & Cowley, P. (2010) The British General Election of 2010 (Basingstoke: Palgrave Macmillan).
Ross, T. and McTague, T. (2017) Betting the House: the Inside Story of the 2017 Election. London: Biteback Books.
For Peer Review Only
Table 1 Party systems in Scottish constituencies, 2010-2017Mean Vote Per Cent
Winner Second Seats Con Lab LD SNP
2010 general election
Conservative Labour 1 38.1 28.9 19.8 10.8
Labour Conservative 7 25.1 45.8 12.7 14.8
Labour Liberal Democrat 6 13.5 42.3 29.7 11.2
Labour SNP 28 10.6 54.4 11.0 21.0
Liberal Democrat Conservative 4 27.4 15.9 39.9 14.5
Liberal Democrat Labour 5 15.1 23.8 43.4 14.4
Liberal Democrat SNP 2 15.5 17.6 44.3 18.7
SNP Conservative 4 29.6 16.2 12.2 40.0
SNP Labour 2 9.8 33.1 9.0 41.7
2015 general election
Conservative SNP 1 39.8 14.8 2.7 38.3
Labour SNP 1 17.5 39.1 3.7 33.8
Liberal Democrat SNP 1 8.9 7.1 41.4 37.8
SNP Conservative 7 30.9 9.5 8.1 47.7
SNP Labour 41 11.9 30.0 2.3 52.7
SNP Liberal Democrat 8 10.3 8.7 33.0 44.6
2017 general election
Conservative SNP 13 44.4 16.6 4.4 34.6
Labour SNP 7 21.0 41.1 2.9 34.6
Liberal Democrat SNP 4 16.8 13.4 40.1 29.4
SNP Conservative 9 32.2 21.1 8.0 38.5
SNP Labour 25 21.1 34.6 3.0 40.4
SNP Liberal Democrat 1 24.3 9.7 33.0 33.0
For Peer Review Only
Table 2 The percentage of seats won by each party according to their share of the votes in each constituency at the 2010, 2015 and 2017 general elections: England and Wales
Party Conservative Labour Liberal Democrat Plaid Cymru
Vote % N Won% N Won% N Won% N Won%
2010 general election
50< 126 100 56 100 10 100 0 -
45-49 77 98.7 48 100 23 100 0 -
40-44 80 86.3 65 93.8 19 42.1 2 50.0
35-39 65 44.6 74 58.1 27 11.1 2 100
30-34 58 6.9 66 13.6 42 2.4 0 0
25-29 38 0 34 0 73 1.4 3 0
24> 128 0 230 0 379 0 33 0
2015 general election
50< 184 100 111 100 1 100 0 -
45-49 69 100 47 100 0 - 0 -
40-44 73 82.2 64 89.1 1 100 2 100
35-39 32 46.9 54 27.8 8 50.0 1 100
30-34 38 2.6 38 2.6 14 7.1 1 0
25-29 34 0 37 0 16 0 2 0
24> 143 10 222 0 533 0 34 0
2017 general election
50< 243 100 223 100 1 100 0 -
45-49 71 73.2 46 58.7 5 80.0 1 100
40-44 54 13.0 39 10.3 5 60.0 1 100
35-39 39 5.1 53 1.9 5 0 1 100
30-34 46 0 52 0 8 0 0 -
25-29 43 0 66 0 10 0 2 50.0
24> 77 0 94 0 539 0 35 0
N – number of constituencies; %Won – percentage of the constituencies won with that vote share. Seats where a party won between 30 and 44 per cent of the votes are shown in bold.
For Peer Review Only
Table 3 The percentage of seats won by each party according to their share of the votes in each constituency at the 2010, 2015 and 2017 general elections: Scotland
Party Conservative Labour Liberal Democrat SNP
Vote % N Won% N Won% N Won% N Won%
2010 general election
50< 0 - 20 100 2 100 0 -
45-49 0 - 11 100 1 100 1 100
40-44 0 - 6 100 3 100 1 100
35-39 1 100 3 100 5 80.0 4 100
30-34 7 0 4 25.0 4 25.0 1 0
25-29 2 0 2 0 1 0 6 0
24> 49 0 13 0 43 0 46 0
2015 general election
50< 0 - 0 - 0 - 35 100
45-49 0 - 0 - 0 - 9 100
40-44 0 - 0 - 1 100 10 100
35-39 2 50.0 3 33.3 3 0 4 50.0
30-34 2 0 23 0 4 0 1 0
25-29 4 0 14 0 1 0 0 0
24> 51 0 19 0 50 0 0 0
2017 general election
50< 1 100 1 100 0 - 0 -
45-49 5 100 0 - 1 100 1 100
40-44 7 85.7 3 66.7 1 100 18 94.4
35-39 1 100 14 28.6 1 100 23 60.9
30-34 6 0 13 0 2 50.0 13 23.1
25-29 10 0 7 0 0 0 3 0
24> 29 0 21 0 54 0 1 0
N – number of constituencies; %Won – percentage of the constituencies won with that vote share. Seats where a party won between 30 and 44 per cent of the votes are shown in bold.
For Peer Review Only
Table 4 Inter-party flows of the vote between 2015 and 2017 by constituency type (percentages of those voting for the party in 2015)Constituency Type
Vote 2015 Vote Intention 2017 All S-C S-L S-LD S-S
Labour Labour 56.7 45.9 62.1 56.0 57.8
Labour Conservative 24.1 33.8 18.9 0.0 24.3
Labour Liberal Democrat 5.4 2.9 7.6 40.0 4.1
Conservative Conservative 87.2 90.7 91.5 67.4 87.1
Conservative Labour 2.9 3.0 2.8 7.0 2.5
Conservative Liberal Democrat 2.4 0.7 0.0 11.6 2.9
Liberal Democrat Liberal Democrat 47.8 29.4 37.5 76.3 39.8
Liberal Democrat Conservative 30.0 42.6 31.3 17.2 36.2
Liberal Democrat Labour 10.6 11.8 18.8 3.2 11.2
SNP SNP 77.8 79.6 78.1 78.0 77.8
SNP Conservative 6.2 8.5 5.5 6.4 5.4
SNP Labour 9.3 6.2 11.4 6.4 10.0
SNP Liberal Democrat 1.3 0.8 0.5 6.4 0.9
Key to Constituency Types: All – all constituencies; S-C – won by SNP in 2015 and Conservative in 2017; S-L – won by SNP in 2015 and Labour in 2017; S-LD – won by SNP in 2015 and Liberal Democrat in 2017; S-S – won by SNP in 2015 and 2017
For Peer Review Only
Figure 1a The seats:votes ratios for political parties at general elections since 1950: England
For Peer Review Only
Figure 1b The seats:votes ratios for political parties at general elections since 1950: Scotland
For Peer Review Only
[image:19.612.103.487.105.429.2]
Figure 2 Votes cast for the SNP and the entropy value for the vote shares won by other parties at the 2017 election.
For Peer Review Only
Figure 3 Map of Scottish constituencies showing which parties came first and second at the 2017 general election