ISSN 1017-6004
eurostat
%
EXTERNAL TRADE
Monthly statistics
1 - 2 D 1991
ISTITUTO STATISTICO DELLE COMUNITÀ EUROPEE
BUREAU VOOR DE STATISTIEK DER EUROPESE GEMEENSCHAPPEN
SERVIÇO DE ESTATÍSTICA DAS COMUNIDADES EUROPEIAS
L 2 9 2 0 Luxembourg Tél. 43011 Télex : Comeur Lu 3 4 2 3
B1049 Bruxelles, bâtiment Berlaymont, rue de la Loi 2 0 0 (bureau de liaison) — Tél. 2351111
Las publicaciones de Eurostat están clasificadas por temas y por series. La clasificación se encuentra al
final de la obra. Para mayor información sobre las publicaciones, rogamos se pongan en contacto con
Eurostat.
Para los pedidos, diríjanse a las oficinas de venta cuyas direcciones figuran en la página interior de la
contracubierta.
Eurostats publikationer er klassificeret efter emne og serie. En oversigt herover findes bag i hæftet.
Yderligere oplysninger o m publikationerne kan fås ved henvendelse til Eurostat.
Bestilling kan afgives til de salgssteder, der er anført på omslagets side 3.
Die Veröffentlichungen von Eurostat sind nach Themenkreisen und Reihen gegliedert. Die Gliederung ist
hinten in jedem Band aufgeführt. Genauere Auskünfte über die Veröffentlichungen erteilt Eurostat.
Ihre Bestellungen richten Sie bitte an die Verkaufsbüros, deren Anschriften jeweils auf der dritten
Umschlagseite der Veröffentlichungen zu finden sind.
Οι εκδόσεις της Eurostat ταξινομούνται κατά θέμα και κατά σειρά. Η ακριβής ταξινόμηση αναφέρεται στο
τέλος κάθε έκδοσης. Για λεπτομερέστερες πληροφορίες σχετικά με τις εκδόσεις, μπορείτε να απευθύνεσθε
στην Eurostat.
Για τις παραγγελίες μπορείτε να απευθύνεσθε στα γραφεία πώλησης, των οποίων οι διευθύνσεις αναγράφονται
στη σελίδα 3 του εξωφύλλου.
Eurostat's publications are classified according to themes and series. This classification is indicated at the
end of the publication. For more detailed information on publications, contact Eurostat.
Orders are obtainable from the sales offices mentioned on the inside back cover.
Les publications d'Eurostat sont
classées par thème et par série. Cette classification est précisée à la fin
de l'ouvrage. Pour des informations plus détaillées sur les publications, contactez Eurostat.
Pour les commandes, adressez-vous aux bureaux de vente dont les adresses sont indiquées à la page 3
de la couverture.
Le pubblicazioni dell'Eurostat sono classificate per tema e per serie. Tale classificazione è precisata alla
fine dell'opera. Per informazioni più dettagliate sulle pubblicazioni rivolgersi all'Eurostat.
Per eventuali ordinazioni rivolgersi a uno degli uffici di vendita i cui indirizzi figurano nella 3
apagina
della copertina.
EXTERNAL TRADE
Monthly statistics
Available data in this issue:
June 1990
July 1990
August 1990
September 1990
October 1990
November 1990
Analysis and commentary:
Methodological notes:
EUR 12
X
X
X
X
UEBL
X
X
X
X
X
DK
X
X
X
X
X
X
D
X
X
X
X
(X)
(X)
GR
Χ
Χ
Χ
Χ
Χ
Ε
Χ
Χ
Χ
Χ
Χ
χ
F
Χ
χ
χ
χ
χ
χ
IRL
Χ
Χ
Χ
Χ
Ι
Χ
Χ
Χ
Χ
Χ
Χ
NL
Χ
Χ
Χ
Χ
Ρ
Χ
Χ
Χ
Χ
Χ
Χ
UK
Χ
Χ
χ
χ
χ
χ
Page V
See Glossarium 1990
Foreword
Two important changes have taken place in 1988 with regard
to the collection of external trade statistics:
(¡) The introduction of the Single Administrative Document,
which not only covers trade in Community goods
between Member States but is also intended to be used
for the corresponding formalities in trade with non
member countries. This simplification of declaration pro
cedures in the exchange of goods marks an important
step towards completion of the internal market.
(ii) The simultaneous entry into force of a new goods classi
fication known as the Combined Nomenclature (CN),
which is intended to meet Common Customs Tariff and
statistical requirements alike. This nomenclature is
based on the Harmonized Commodity Description and
Coding System (HS), whose aim is to enhance the world
wide comparability of external trade statistics.
As a result of both these changes, customs and statistical
departments were faced with a considerable amount of work
until the procedures had been properly introduced and
tested and formed part of normal working practice.
This meant that there were delays in the forwarding of data
in all the Member States. In addition, there was bound to be
a higher quota of errors and corrections, so that the first
month's data are not directly comparable with those of the
preceding year and therefore need to be interpreted with
caution.
In particular, it should be noted that considerable diver
gences have arisen at subheading level between the Combi
ned Nomenclature and the formerly used Nimexe, leading to
a break in the goodsrelated time series between 1987 and
1988. Up to December 1987 this Bulletin used the SITC Rev.
2, which was worked out using the 6digit Nimexe, while
from January 1988 it uses the SITC Rev. 3, which has been
drawn up using the 8digit subheadings of the Combined
Nomenclature.
As an aid to interpretation of the statistics, Eurostat has
published in Theme 6 'Foreign Trade, Series E: Methods'
brochures entitled 'Nomenclature of goods, CNNimexe cor
relation tables'. These provide a comparison between the old
and new nomenclatures as well as showing the links bet
ween the Combined Nomenclature (CN) and its offshoots.
Eurostat will be glad to provide users of European statistics
with any further information or explanations they may require
with regard to these new developments.
Tab. 2: Monthly data 5
General summary of trade by commodities:
Tab. 3: Yearly and quarterly data 8
Tab. 4: Monthly data 11
Trends in trade by country:
Tab. 5: World, intra- and extra-EC 16
Tab. 6: Intra-EC by member countries 24
Tab. 7: Major areas 30
Trends in trade by commodities:
Tab. 8: SITC sections 52
Trade by partner countries:
Tab. 9: All commodities (monthly cumulative data) 92
Tab. 10: SITC sections and main partner countries (quarterly cumulative data) 124
Indices:
Tab. 11: Volume and unit value indices 204
Trade of main non-Community countries:
Tab. 12: Trends in total trade and with the EC (EUR 12) 206
Conversion rates:
Tab. 13: Member countries, United States of America, Japan and Switzerland 210
EC trade in agricultural products:
Tab. 14: Main product groups 212
Tab. 15: Products subject to common agricultural policy regulations 220
EC trade in petroleum products:
Tab. 16: Petroleum and petroleum products 244
EC and world trade:
Tab. A: World, Community and main non-Community countries 252
Trade of the FR of Germany, including West Berlin, as constituted prior to 3 October 1990:
Tab. B: Trade by countries 253
Tab. C: Trade by products 256
Symbols and abbreviations used
EUR 12:
UEBL:
DK:
D:
GR:
E:
F:
IRL:
I:
NL:
P:
Total of the EC member countries
Belgo-Luxembourg Economic Union
Denmark
Federal Republic of Germany
Greece
Spain
France
Ireland
Italy
Netherlands
Portugal
0: Data less than half the unit used
Mio: Million
Mrd: 1 000 million
ECU: European currency unit
Eurostat: Statistical Office of the European Communities
GLOBAL TRENDS : Results for October 1990
External trade flows for the major industrialized economies continued on a downward trend which
was accompanied by an increased Community trade deficit, a decrease in the US deficit and a fall
on the Japanese surplus.
October global trade flows were characterized by three
important phenomena , which were in line with the situation
observed in September :
On the foreign exchange markets : compared with the
previous year the US dollar fell sharply by 18.4% visàvis
the ecu, after recording afall of 12% for JanuarySeptember;
the yen depreciated by 10.8% against the ecu, having regis
tered afall of 19.7% during the first three quarters of 1990.
The US trade deficit fell from 12.1 billion ecus in October
1989 to 11.4 billion ecus. However, in dollar terms this
corresponds to a deteriorated balance : the deficit increased
from 13.4 billion dollars in October last year to 15.4 billion
dollars. On a yearonyear basis, imports and exports were
well down by 9.2% and 10.4% respectively in ecu terms ( in
dollars, up 11.4% and up 9.9% respectively). Considering
the period JanuarySeptember 1990, both importsand ex
ports recorded significant yearonyear decreases in ecus :
down 8.9% and 5.1% ( in dollars up 3.5 % and 7.8%
respectively ). Irrespective of the currency, these rates
indicate a downward trend when compared with last year's
trade growth.
On the oil markets : the CIF cost per barrel of Community
crude oil supplies, rose from an average price of 19.6$/barrel
in the first nine months of 1990, to 36.1 $/barrel in October
which represents a yearonyear increase of 98%.
On the world trade markets : the slowdown of trade growth
forthe most industrialized economies, although this was less
marked than for the previous month.
The Community's Octobertrade balance registered a higher
deficit than the same month last year ( 5.9 billion ecus as
opposed to 4 billion ecus ). This was the result of a slight
decrease in export values ( down 0.2% on October 1989 ),
accompanied by an increased import bill ( up 4.3% on the
same month in 1989 ), under the impact of the rising oil
prices. During the first three quarters of the year, a decele
ration of trade growth was already registered: on a yearon
year basis, imports and exports were up only 2.4% having
produced a deficit of 31.5 billion ecus, against 30.7 for the
same period in 1989.
The Japanese trade surplusfell sharply from 4.2 billion ecus
in October 1989 to 2.4 billion ecus. In yen too, this corre
sponds to a significant decline in the trade surplus, from
around 600 billion yen to 430 billion yen. Irrespective of the
currency, import values recorded a rise of 4.3% in ecus,
19.7% in yen and 27 % in dollar terms, due to increasing oil
prices. Meanwhile, exports fell by 5.3%, in ecu terms but
were up by 8.5 % in yen and by 16% in dollars , which
indicatesastrengthening of Japanese exports when compa
red with the yearonyear export growth for the first three
quarters of 1990 (down by 11.4% in ecus, up 10.9% in yen
and up only 0.4 % in dollars ).
% 3 0
2 0
10
1 0
20
1
GR. I IMPORTS A N D E X P O R T S (CIF,FOB)
A N N U A L % C H A N G E IN V A L U E
3 0 T
3°-r
2 0
¡H ^
,ηπ,Πΐ
10
□_
1 0
-8 9
89
9 0 * 89
9 0 *
0 1 - 0 9
10
10
EUR 12
-20-
1Π
89
89
9 0
8 9
90
0 1 - 0 9
10
10
USA
2 0
10
0
- 1 0
- 2 0
\
\
\
El
J3
Π
89
89
9 0
89
90
0 1 - 0 9
10
10
JAPAN
'Estimates
S 3
I m p o r t .
EFTA countries recorded during the first three quarters of
1990 (up 2.3 billion ecus on the same period last year) was
not carried over into October. Compared with last October
no important movement of the trade balances with these
economies was registered : the deficit with Japan was
unchanged ( -2.1 billion ecus ) and the surplus with EFTA
deteriorated by 0.2 billion ecus. Meanwhile, the deficit with
the USA decreased slightly, by 0.1 billion ecus.
Community export growth (year-on-vear basisi remained
weak, particularly to USA and EFTA ( -0.3,% and 1%
respectively ) continuing the trend already registered during
January-September 1990 ( export growth was -0.2% and 5%
respectively). On the other hand, growth of exportsto Japan
maintained a healthy rate of increase in October ( up 7.2%
) but still showed some deceleration when compared with
the average growth during the first nine months of 1990 ( up
9.2% on the same period last year).
On the import side similar movements were recorded:
im-ports from USA were down by 2.1 % on October 1989, having
registered an average growth of 3.1% during the first three
quarters of 1990 ; imports from EFTA were up only 2.5% on
the same month last year, as opposed to a year-on-year rise
of 4.7% from January to September 1990 ; meanwhile,
imports from Japan grew by 3.4% on last October compared
with a year-on-year decrease of 1.4% during the first three
quarters of 1990.
-0.8 billion ecus, respectively ). This large deterioration
reflected a significant increase in import values from these
partner groups ( up 39.1% and 32.4% respectively ).
The
main factor contributing to this result was the rise in oil prices
compared with October 1989 ( up 98% in dollar terms ),
which was only partly compensated by the appreciation of
the ecu vis-à-vis the US dollar. On the other hand, exports
to OPEC countries were well down (by 11.6%) on the same
month last year and growth of exports to Mediterranean
countries was up only 2.9%.
As regards the period January-September 1990, the
situa-tion was quite different : taken as a whole and on a
year-on-year basis, imports and exports grew by only 2.8% and 3.8%
respectively, and the trade deficit decreased by 0.8 billion
ecus. This improvement was essentially due to a widening
surplus with the Mediterranean countries ( 3.2 billion ecus
against 1.6 billion ecus the same period last year ).
Connpa-red with the same period of 1989, imports and exports
showed a healthy increase : up by 9.7% and 14.6%,
res-pectively.
The Community's deficit with state trading countries
increa-sed quite substantially : 1.6 billion ecus as oppoincrea-sed to 0.6
billion ecus in the same month of the previous year. Imports
rose by 11 % on October 1989 while exports were well down
by 20.1%. Compared with the average growth of trade
during the first nine months of theyear, during which imports
were up 6.1% and exports down 4.3% ,the growth rates for
October showed a continued weakness of the EC position
vis-à-vis this partner group.
GR.II - EXTRA T R A D E BALANCE (MAIN P A R T N E R S )
(BIO ECU)
0
1 0
2 0
3 0
-EFTA
15-r
1 0
-5
USA
JAPAN
88
89
5
-- 1 0
-15
-20-EFTA
2-r
1
0
JAPAN
89
0 1 - 0 9
9 0 *
01-09
1
--2
3
-EFTA
EXTRA-COMMUNITY TRADE BY PRODUCT : Results for October 1990
Sharp increase in fuel trade deficit due to the impact of soaring price of crude oil.
Slight increase in the deficit of primary goods other than fuel accompanied by a larger surplus
on manufactured goods.
The Community's deficit on fuel was 2.5 billion ecus higher
than that recorded in October 1989. Imports rose by 50.8%
on the same month last year, reflecting the sharp increase
in the CIF cost per barrel ( in dollars ) of Community crude
oil supplies (36.1 $/barrel in October 1990 against
18.2$/bar-rel in October 1989 ). Meanwhile, exports of fuel were up
10.7% on the corresponding month in 1989.
The Community's surplus on manufactured goods widened
compared with the same month last year ( up 0.4 billion
ecus ) which is quite significant compared with the
year-on-year increase of 1.2 billion ecus during the first three quarters
of 1990. The October import bill rose by around 3% while
export growth was up only 1.8% on the same month last
year. These growth rates confirm the slowdown already
observed from January to September 1990. Imports and
exports recorded year-on-year rises of 2.7% and 4.6% on
the corresponding nine months the year before.
The Community's deficit on primary goods other than fuel
increased slightly ( down 0.2 billion ecus on October 1989 ).
On a year-on-year basis, October import values fell by
around 9.3% while exports were well down by 19%. These
rates showed more accentuated decreases than those
re-corded during the first three quarters of 1990, -5% and-10%
(on a year-on-year basis) for imports and exports
respecti-vely.
GR.III
-
EXTRA T R A D E B A L A N C E (PRODUCT
G R O U P S )
(BIO ECU
)
6 0 T
40
20
o
-20
-40
-60-M a n u f a c t u r e s
40
20
P r i m , g o o d s
-20
-40
M a n u f a c t u r e s
10
5
0
5
-
-10-M a n u f a c t u r e s
P r i m , g o o d s
89
10
9 0 *
1 0
Germany's trade surplus showed a yearonyear decline
of 1.7 billion ecus in October 1990, reflecting a sharp rise
on the import bill (up 10.4% ) and a continued slowdown
in exports (uponly 2.9% ). On the other hand, the deficits
of UKand Spain showed quite important decreases (down
1 billion ecus and 0.7 billion ecus, respectively, compared
with October 1989 ) while France's deficit recorded a more
modest yearonyear fall ( down 0.1 billion ecus ). This
was largely due to stronger yearonyear export growth
(up 10.5%, 10% and 7.6%, respectively ) than those
recorded in the import side ( 2 . 1 % , 4.7% and 6.5%,
respectively ), despite higher oil prices. Meanwhile, Ita
ly's deficit increased by 0.8 billion ecuson the same month
last year, having recorded an improvement on its balance
during the first three quarters of 1990 ( 7.2 billion ecus
against a deficit of 9.9 billion ecus for the same period of
the previous year ). Italy's exports were almost the same
as those for October last year, while the import bill increa
sed by 6.5% . The BelgiumLuxembourg balance showed
a deficit of 0.3 billion ecus as opposed to a surplus of 0.2
billion ecus in October 1989 essentially due to strong
import growth ( + 13.2%) and a weaker growth in exports
( +6.8% ). The balances of the remaining Member States
registered no significant changes compared with October
in the previous year.
IntraCommunitvtradeorew by 4.7% which shows a conti
nued strengthening trend on comparison with to extra
trade growth ( imports up 4.3 % and exports down 0.2%
on October 1989 j . This was already observed during the
first three quarters of 1990 : ¡ntracommunity trade grew
by 6.3% whileextraimports and exports both grew by only
2.4%. As regards the pattern of Member States' intra
Community trade balances some adjustment occurred:
Germany's intrasurplus decreased by 1.5 billion ecus,
after a significant deterioration over the first three quar
ters of 1990
(down 7.8 billion ecus ). The fall on the
German intrabalance reflected to a large extent the im
provement in the intrabalances of the major Member
States. The intradeficit of UK decreased by 1.2 billion
ecus while the intradeficits of France and Italy fell by 0.5
billion ecus and 0.2 billion ecus, respectively, on last
October. BelgiumLuxembourg recorded an intrasurplus
of 0.4 billion against 0.6 billion ecus in the corresponding
month the year before. The other countries registered no
significant change in their intraCommunity positions.
G R . I V M E M B E R S T A T E S ' EXTRA A N D INTRA T R A D E B A L A N C E S
(BIO ECU)
40
T
30
20 ·
10
oi-mP
1 0
2 0
3 0
—40
Γ
τ β ~
""insN
EC
B L
D
K
D
G
R
E
F
R
L
I
N L P U K
Π EXTRA 0 1 0 9 / 8 9
■ EXTRA 0 1 0 9 / 9 0
S INTRA 0 1 0 9 / 8 9
Β INTRA 0 1 0 9 / 9 0
4y
2
0
- 2
6
fi
* ^
T j p r f ï — ' r y
H
—[up·
EC
B L
DK
D
GR
E
F
R L
NL
Ρ
UK
TABLE I - TRADE BALANCE, IMPORTS AND EXPORTS (1)
COUNTRIES
EUR-12(2)
United
States
Japan
BLEU
Denmark
Germany
Greece
Spain
France
Ireland
Italy
Netherlands
Portugal
United Kingdom
EUR-12(2)
United
States
Japan
BLEU
Denmark
Germany
Greece
Spain
France
Ireland
Italy
Netherlands
Portugal
United Kingdom
EUR-12(2)
United States
Japan
BLEU
Denmark
Germany
Greece
Spain
France
Ireland
Italy
Netherlands
Portugal
United Kingdom
Memorandum Item
1 USD = ...ECU
1 YEN = ...ECU
1988
-25,0
-117,3
65,8
-2,9
0,9
61,0
-5,9
-11,9
-12,2
2,7
-8,4
1,2
-5,8
-42,6
14,0
5,8
22,9
11,2
-0,6
7,2
-6,8
20,1
14,9
10,9
8,3
6,9
21,9
23,8
6,9
24,0
13,2
8,2
2,6
7,1
-18,0
15,6
16,8
14,3
8,0
6,9
13,3
9,1
2,4
10,0
1989
-33,7
-116,1
58,4
-2,2
1,2
64,0
-7,8
-19,3
-14,9
3,1
-11,2
3,5
-5,6
-11,1
%(
15,2
14,6
20,6
15,2
10,5
15,4
40,0
27,3
16,6
19,8
18,7
14,2
13,4
7,8
%
13,8
21,3
11,3
16,7
11.3
13,1
48,6
16,0
16,2
18,6
17,6
16,7
23,5
11,7
%
7,4
-0,3
1990
II
1990
III
1989
01-09
1990
01-09
TRADE BALANCE (Mrd ECU)
-10,3
-19,7
"
10,9
-1,6
0,6
13,3
-2,8
-5,8
-3,7
0,8
-1,4
0,1
-1,7
-9,3
change on
the
-1,1
-11,9
"
-7,7
1,4
-1,2
1,3
35,5
7,7
-0,1
1,6
0,6
2,2
12,1
-2,4
change on the
-0,4
-6,0 "
-12,5
-3,1
4,7
-2,7
-4,0
5,5
0,2
0,7
5,4
0,7
13,1
3,9
-10,8 '
-18,9 "
12,2
-1,4
0,5
9,0
-4,4
-1,6
0,3
0,2
-0,9
-1,6
-8,4
-30,7
-86,9
45,7
-2,0
0.7
49.4
-5.3
-14,5
-11,1
2,3
-9.9
2.1
-1.1
-34,9
IMPORTS
-31,5
-69,4 "
33,4
-4,4
1,7
40,2
-15,6
-12,6
1,9
-7,2
-0,0
-4,7
-27,5
1989
10
-4,0
-12,1
4,2
0,2
0,2
4,7
-0,5
-2,8
-1,6
0,3
-0.2
0,2
-0,5
-3.5
corresponding period of the previous year
1,3
'
-13,0
"
-11,5
3,3
-1,2
10,9
4,1
8,6
6,3
-2,0
3,5
6,4
-3,8
17,3
17,1
21,2
16,3
11,7
16,8
34,2
30,4
16,6
23,2
21,6
14,4
29,2
11,8
EXPORTS
2,4
-8,9 "
-6,8
5,6
2,2
8,0
7,3
5,7
4,4
2,4
5,6
14,1
-2,5
16,3
16.2
20,6
16,4
9,3
13,5
41,3
49,6
24,1
21,7
17,2
17,1
22,1
0.6
ι corresponding period of the previous year
-1,8 '
-11,7
"
-13,7
1,3
2,5
-1,2
12,2
5,8
-7,8
0,5
-3,3
6,8
5,7
15,3
24,4
15,6
18,8
11,4
16,2
54,7
16,9
16,3
20,7
19,0
17,4
30,2
11,8
EXCHANGE RATE
2,4
-5,1 "
-11,4
2,1
7,3
2,2
;
6,8
4,9
0,8
5,5
2,6
13,7
4,0
13,9
15,2
1,5
13,9
13,0
9,5
121,3
19,3
19,5
12,5
20,7
16,4
23,6
17,2
shange on the corresponding period of the previous year
-14,4
-19,9
-16,8
-18,5
8,5
2,9
-12,0
-19,7
3,4
-6,2
1990
10
-5,9 '
-11,4
"
2,4
-0,3
0,1
3,0
-2,1
-1,5
-1,0
-0,7
-2,5
4,3
-9,2 "
4,3
13,2
12,0
10,4
-4,7
6,5
6,0
17,5
2,1
-0,2 '
-10,4
-5,3
6,8
10,2
2,9
10,0
7,6
0,3
7,8
10,5
-18,4
-10,8
Remark: The monthly data in these commentary tables ares sometimes more up-to-date than those presented in the main part of this publication.
Consequently, there may be slight differences between the two sets of figures.
(1) External Trade Statistics (Imports CIF, Exports FOB).
(2) EUR-12 includes only extra flows. Figures for Member States include world flows.
For Germany, the situation is the same as before the 3 October 1990.
* Estimate.
INDUSTRIALIZED THIRD
COUNTRIES
- United States
-Japan
- E R A
DEVELOPING COUNTRIES
-AsianNICs(2)
-OPEC
- Mediterranean Basin
-ACP
COUNTRIES WITH STATE
TRADE
EXTRA-EC
INDUSTRIALIZED THIRD
COUNTRIES
- United States
-Japan
-EFTA
DEVELOPING COUNTRIES
- Asian NICs (2)
-OPEC
- Mediterranean Basin
-ACP
COUNTRIES WITH STATE
TRADE
INTRA-EC
EXTRA-EC
INDUSTRIALIZED THIRD
COUNTRIES
-United States
-Japan
-EFTA
DEVELOPING COUNTRIES
-AsianNICs (2)
-OPEC
- Mediterranean Basin
-ACP
COUNTRIES WITH STATE
TRADE
-100,0
61,0
18,8
10,4
22,9
30,4
6,0
9,0
8,3
4,4
8,6
-100,0
60,2
18,9
5,1
26,1
31,8
5,6
8,5
9,9
4,0
8,0
-16,9
3,5
-24,6
5,8
-3,0
-4,9
-0,7
5,2
-2,1
-5,1
14,0
18,5
21,6
19,6
9,4
7,4
20,3
-8.5
3,0
5,8
7,3
10,8
6,9
6,1
-0,1
25,0
6,8
8,5
30,8
5,4
3,7
10,0
7,2
-22,2
-5,6
-25,2
5,4
-5,9
-3,7
-5,8
3,5
-3,1
-5,6
-7,6
-3,9
-6,2
1,8
-0,3
-0,5
-0,2
1,8
0,0
-2,5
-3,8 '
-0,4 '
-5,7 '
0,9 '
-3,4 '
-1,1 '
-2,3 '
1,1 '
-0,9 '
-3,6 '
-19.4
-5,2
-19.1
3,3
-6.4
-3,0
-4,1
1,6
-2,4
-4,9
IMPORTS
-18,3 '
-7,3 '
-17,2 '
3,7 '
-5,6 '
-2,0 '
-4.8 '
3,2 '
-1,5 '
-7,6 '
-2.0
-0.6
-2.1
0,4
-1,4
-0,5
-0,5
0,6
-0,4
-0,6
%
change on the corresponding period of the previous year
15,2
13,4
22,4
11,3
13,2
17,6
8,3
28,2
23,1
11,5
19,5
15,5
-1,1
-0,8
2,7
-4,1
0,5
-2,3
-5,6
-5.4
2,5
-11,4
1,2
3,1
1.3 '
-0,3 '
0,0 '
-3,2 '
4,7 '
2,0 '
-5,8 '
9,3 *
6,6 '
-1,8 '
9,5 "
5,9 '
EXPC
17,3
15,9
25,4
14,6
15,3
19,1
11,3
27,6
23,6
11.5
21,7
17.0
ÎRTS
2,4 '
1,6 '
3,1 '
-1,4 '
4,7 '
2,8 '
-3,8 '
6,7 '
9,7 '
-3,6 '
6,1 '
6,3 '
% change on the corresponding period of
the
previo
13,8
12,0
8,7
24,1
12,0
15,5
16,4
12,3
14,9
6,8
21,4
-0,4
-0,5
-3,1
2,8
3,8
1,7
-3,8
6,4
11,5
6,8
-8,1
-1,8 '
-1,1
'
-3,6 '
1,5 '
1,1 '
-0,8 '
-4,9 '
-1.0
'
9,9 '
-2,0 '
-11,0 '
15,3
13,5
11,0
27,4
13,0
16,8
21,9
12,3
13,2
7,0
23,6
2,4 *
2,5 '
-0,2 '
9,2 '
5,0 '
3,8 '
1,3 '
5,2 "
14.6 '
2,8 '
-4,1 '
16,3
14,4
24,4
8,4
14,6
20,3
0,4
21,5
22,0
34,1
15,7
16.3
us
year
13,9
13,1
7,0
32,9
12,6
12,9
4,6
10,8
21,3
17,3
25,3
-2,0
-0,5
-2,1
0,2
-2,3
-0,4
-2,3
-0,3
-0,7
-1,6
4,3
0,0
-2.1
3,4
2,5
10,7
4,0
39,1
32,4
7,3
11,0
4,7 '
-0,2
0,4
-0,3
7,2
1,0
3,8
7,8
-11,6
2,9
-9,4
-20,1
(1 ) External Trade Statistics (Imports CIF, Exports FOB).
(2) Asian NICs include the following countries: Singapore, South Korea, Taiwan and Hong
* Estimate.
TABLE III - EUR-12TRADE BALANCE AND TRADE FLOWS BY BROAD PRODUCT GROUPS (1)
EXTRA-EC
-Food, etc (SITC 0+1)
-Crude materials (SITC 2+4) (2)
- Fuel products (SITC 3)
-Chemicals (SITC 5)
- Transport equipment (SITC 7)
- Other manufacL goods (SITC 6+8)
- Artides not classified (SITC 9)
EXTRA-EC
-Food, etc (SITC 0+1)
- Crude materials (SITC 2+4) (2)
- Fuel products (SITC 3)
-Chemicals (SITC 5)
- Transport equipment (SITC 7)
- Other manufact goods (SITC 6+8)
- Articles not classified (SITC 9)
EXTRA-EC
- Food, etc (SITC 0+1 )
- Crude materials (SITC 2+4) (2)
- Fuel products (SITC 3)
-Chemicals (SITC 5)
- Transport equipment (SITC 7)
- Other manufact goods (SITC 6+8)
- Artides not classified (SITC 9)
1989
STRUC
TURE
%
-100,0
8,1
9,4
13,6
6,6
28,0
28,9
5,4
100,0
7,6
2,3
2,4
11,6
38,7
31,9
5,5
1988
-25,0
-8,6
-28,5
-39,3
19,4
34,5
5,9
-8,4
14,0
5,0
15,0
-15,7
15,5
24,5
19,3
38,0
6,9
7,0
13,7
-14,1
16,9
7,1
7,6
-8,1
1989
-33,7
-4,7
-32,7
-52,5
18.7
35,0
3,0
-0.4
%
change
15,2
3,7
13,4
30,2
17,0
17,2
18,6
-16,2
1990
II
1990
III
1989
01-09
1990
01-09
TRADE BALANCE (Mrd ECU)
-10.3
-1,6
-8,3
-11,6
4,3
8,2
-0,2
-1,2
-10,8
'
-1,2
^
-6,4
'
-13,9
'
4,6 '
8,5 '
-1,1 '
-1,2 *
-30,7
-4,2
-24,9
-38,1
13,8
23,7
-0,4
-0,8
IMPORTS
-31,5 '
-3,7 '
-22,8 '
-39,4 '
13,8 '
26,7 '
-2,2 "
-3,8 '
1989
10
^ , 0
o.o
-2.6
-4.3
1,5
2,0
-0,1
-0.6
ι on the corresponding period of the previous year
-1,1
-2,1
0,3
-8,0
-0,6
2,7
0,4
-0,5
%
change on the co
13,8
20,0
9,2
14,5
7,9
13,3
15,1
16,8
-0,4
-2,4
-12,1
16,0
-4,0
4,1
-2,2
-12,7
1,3 '
-2,0
"
-2,1
'
7,9 '
0,3 '
2,9 '
2,2 '
11,2
17,3
7,1
17,2
27,5
20,7
19,7
22,2
-17,1
EXPORTS
2,4 '
-0,7 '
-8,4 '
5,2 '
1,5 '
5,1 '
2,6 '
5,0 '
16,3
3,3
6,7
35,7
13,6
21,8
21,5
-18,8
rrespondlng period of the previous year
-1,8
-1,4
-11,3
8,0
-2,6
2,4
-4,0
-15,8
15.3
24,5
12,7
8,1
10.4
15,0
16,4
15,2
2,4
1,2
-9,0
16,1
0,6
6,6
0,7
-12,7
13,9
30,5
22,9
82,6
-1,2
13,7
13,4
5,4
1990
10
-0,6 '
-2,2 '
-€,8 *
1,4 '
2,8 '
-0,4 '
-0,1 '
4,3 '
0,1 '
-15,1 '
50,8 '
9,4 '
2,0 '
-2,4 '
-22,6 '
-0,2 '
-18,1 "
-20,0 '
10,7 *
2,2 '
7,7 '
-4,3 '
-1,9 '
(1 ) External Trade Statistics (Imports CIF, Exports FOB).
(2) Petroleum not included.
* Estimate.
SITC Rev.3 is in application from 1988.
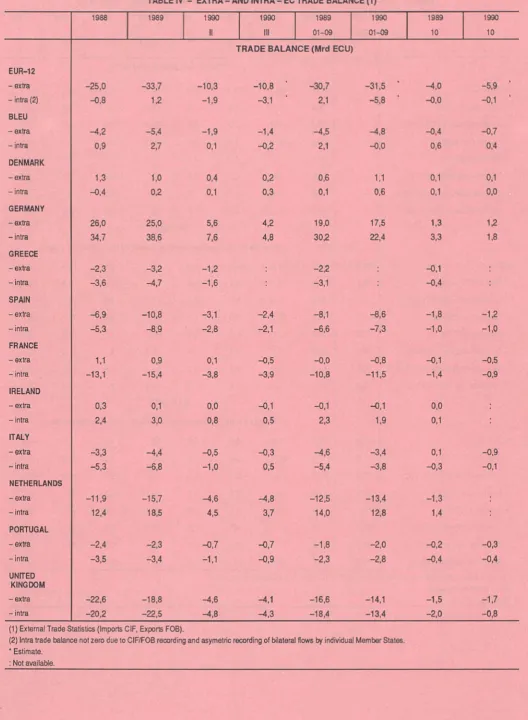
- intra (2)
BLEU
-extra
-intra
DENMARK
-extra
- intra
GERMANY
-extra
-intra
GREECE
-extra
- intra
SPAIN
-extra
-intra
FRANCE
-extra
- intra
IRELAND
-extra
-intra
ITALY
-extra
- intra
NETHERLANDS
- extra
- intra
PORTUGAL
-extra
- intra
UNITED
KINGDOM
-extra
-intra
(1) External Trade S
(2) Intra trade balani
* Estimate.
: Not available.
-0,8
-4,2
0,9
1,3
-0,4
26,0
34,7
-2,3
-3,6
-6,9
-5,3
1,1
-13.1
0.3
2,4
-3,3
-5,3
-11,9
12,4
-2,4
-3.5
-22,6
-20,2
1,2
-5,4
2,7
1,0
0,2
25,0
38,6
-3,2
-4,7
-10,8
-8,9
0,9
-15,4
0,1
3,0
-4,4
-6,8
-15,7
18,5
-2,3
-3,4
-18,8
-22,5
-1,9 -3,1 ' 2,1 -5,8 '
-1,9 -1,4 -4,5
-4,8
0,1 -0.2 2,1 -0,0
0,4 0,2 0,6 1,1
0,1 0,3 0,1 0,6
5,6 4,2 19,0 17,5
7,6 4,8 30,2 22,4
-1,2 : -2,2
-1,6 : -3,1 :
-3,1 -2,4 -8,1 -8.6
-2,8 -2,1 -6,6 -7,3
0,1 -0,5 -0,0 -0.8
-3,8 -3,9 -10,8 -11,5
0,0 -0,1 -0.1 -0,1
0,8 0,5 2,3 1,9
-0,5 -0,3 -4,6 -3,4
-1,0 0,5
-5,4
-3,8
-4,6 -4,8 -12,5 -13,4
4,5 3,7 14,0 12,8
-0,7 -0,7 -1,8 -2,0
-1,1
-0,9 -2,3 -2,8
-4,6
-4,1
-16,6
-14,1
-4,8 -4,3 -18,4 -13,4
tatistics (Imports CIF, Exports FOB).
:e not zero due to CIF/FOB recording and asymétrie recording of bilateral flows by individual Member States.
-0,0
-0,4
0,6
0,1
0,1
1,3
3,3
-0,1
-OA
-1,8
-1,0
-0,1
-1,4
0,0
0,1
0,1
-0,3
-1,3
1,4
-0,2
-0,4
-1,5
-2.0
-0,1 '
-0,7
0.4
0,1
0,0
1.2
1,8
:
;
-1,2
-1,0
-0,5
-0,9
:
;
-0,9
-0,1
:
-0,3
-0,4
[image:14.595.33.562.28.749.2]Mrd ECU
120
100
80
60
40
20
Trade of the EC in agricultural and industrial products
1989
Import
Intra Extra
Industrial products
Agricultural products
B/L DK D GR
IRL
NL
UK
Mrd ECU
Export
160
140
120
100
75
50
; r 1 I , I I , I 1 1 I , , I I , I I
1988
1989
1990
100
75
50
25
Ι ι , I . , I , . I I 1 ι , I ,1988
1989
1990
125
100
75
50
25
ι Ι ι ι Ι ι ι Ι ι ι Ι ι ι Ι ι ι 1 ι ι Ι ι ι Ι ι ι Ι ι ι Ι ι ι 1 ι1988
1989
1990
G r e e c e
200
175
150
125
100
75
50
25
uI
, ι ι ι I
, ,
1988
1989
1990
200
175
150
125
100
75
50
25
Spa I n
F r a n c e
■ , ι Ι , , Ι , ι I , , I 1 ι , Ι ι ι I
1988
1989
1990
200
175
150
125
100
75
50-25
' ' ι ' ■ I ' ■ ι ' ■ I ' ' I ' ■ ï ' ' ι ' ' 1 ' ' I ' ' I ' ' I '1988
1989
1990
I r e i and
200
175
150
125
100
75
50
25
I
I
I t a l y
N e t h e r l a n d s
1988
1989
1990
2 5
L^
200
175
150
125
100
75
50
1988
19B9
1990
25
: I . ι I . ι Ι ι I_LJ.L1.J-I Ι ι i L L I . I . H I 1. ! I I I I I
1988
1989
1990
Po r t u g a I
U n i t e d Klngdom
1988
1989
1990
200
175
150
125
100
75
50
j j
I
Ι , , ι , , ι , , ι ,
1988
1989
1990
C o u n t r y
EUR 12
VALUE INDICES
1985
=
100
200
175-150
125
100
75
50
25
Belgium & Luxembourg
■ ' , , I I . , Ι ι ι Ι , , Ι ι ι Ι , , Ι ι ι I ,
1988
1989
1990
200Γ
175-
150-125
100
75
50
WORLD EXPORTS
Denmar k
25
' ' ■ ' ' ' ■ ï ' ' I ' ' ' ■ ι ï ' ' ' ι ' I ■1988
1989
1990
FR of Germany
200Γ
175
150-125
loo h
75
50
25
I l 1 ι ι Ι ι ι Ι ι ι Ι ι ι Ι ι ι Ι ι ι Ι ι ι Ι ι ι Ι ι ι1988
1989
1990
G r e e c e
1988
1989
1990
200
175
150
125
100
75
50
25
Spa i η
' ' ' Ι , Ι Ι Ι , Ι Ι Ι Ι , ! Ι ι , ι
200
175
150
125
100
75
h
50
F rance
1988
1989
1990
2 5 ^
' ι , , ι
1988
1989
1990
Ire!and
25
U-
L200
175
150
125
100
75
50
I t a l y
1988
1989
1990
25 ^
Ι , , Ι , ι Ι , , Ι ι , I I , ,
1988
1989
1990
200
175
150
125
100
75
50
25
Nether lands
, ι ,
Ι , , ι ι
, 1 , , ; ,
1988
1989
1990
Po r t u g a I
200
175
150
125
100
75
5 0
Un i t ed Ki ngdom
1988
1989
1990
25'-
t, I . , I , . I , . I . , I . . 1 . ■ I ■ . 1 Ι ι ι I .
1988
1989
1990
Count ry
EUR 12
1011 1020 1021 1022 1023 1028 1030 1031 1032 1033 1038 1040 1041 1048 1090 1051 1053 1057 1058
024 028 030 032 036 038 043 046 048 052 056 058 060 062 064 066 068 204 208 212 216 220 224 248 272 276 288 302 314 318 322 330 346 372 373 382 388 389 400 404 406 412 442 448 453 458 462 480 484 500 504 508 512 520 524 528 600 604 608 612 616 624 632 636 647 649 652 662 664 666 669 680 700 701 703 706 708 720 728 732 736 740
Extra-EC Class 1 EFTA
Other West. Europe USA and Canada Other class 1 Class 2
ACP (68 countries) DOM
TOM Other class 2 Class 3 (1)
Eastern Europe (1) Other class 3 Miscellaneous Mediterranean Basin OPEC
ASEAN Latin America
Main countries . Iceland
Norway Sweden Finland Switzerland Austria Andorra Malta Yugoslavia Turkey Soviet Union German Dem. Rep. (1) Poland
Czechoslovakia Hungary Romania Bulgaria Morocco Algeria Tunisia Libya Egypt Sudan Senegal Ivory Coast Ghana Nigeria Cameroon Gabon Congo Zaire Angola Kenya Reunion Mauritius Zimbabwe South Africa (2) Namibia
United States of America Canada
Greenland Mexico
Panama
Cuba Bahamas Guadeloupe Martinique Colombia Venezuela Ecuador Peru Brazil Chile Paraguay Uruguay Argentina Cyprus Lebanon Syria Iraq Iran Israel Saudi Arabia Kuwait
United Arab Emirates Oman
North Yemen Pakistan India Bangladesh Sri Lanka Thailand Indonesia Malaysia Brunei Singapore Philippines China South Korea
Japan Taiwan Hong Kong
340 057 201 400 82 679 9 644 63 139 45 938 108 492 16 510 1 318 496 90 168 30 156 24 479 5 687 1 682 29 302 34 968 10 037 19 350
722 12 106 20 056 7 873 26 696 15 226 23 360 5 251 3 772 13 128 1 390 2 907 2 055 1 996 2 429 517 1 929 5 383 1 542 5 239 2 121 206 300 1 772
417 3 004 1 138 704 413 1 117
523 484 127 571 492 5 382
56 213 6 926 295 2 924 328 293 106 95 163 1 669 1 195 262 645 7 274 1 443 252 368 1 889 302 81 538 3 852 3 859 2 585 5 622 2 537 1 391 232 11 1 i o ; 2 762 274 321 2 479 1 680 2 322 50 2 368 1 138 5 239 5 959 34 757 6 626 5 507
387 891 238 898 90 653 10 907 76 765 60 573 115 517 17 541 1 363 740 96 973 32 377 24 891 7 486 1 869 30 196 31 851 12 203 23 047
731 12 507 21 965 8 996 29 572 16 881 29 390 5 892 4 346 12 990 1 404 3 361 2 211 2 158 2 234 462 2 271 4 864 1 527 5 223 1 646 200 384 1 615 497 2 876 1 105 1 092 403 1 284 713 532 128 667 603 12 528
68 349 8 415 316 2 466 400 374 113 133 166 1 322 1 155 328 684 9 329 2 187 366 884 2 624 400 112 421 2 786 3 106 2 885 5 470 2 100 649 316 197 1 230 3 266 371 349 2 966 2 134 2 687 214 2 993 1 209 7 005 7 240 41 618 8 067 6 317
445 716 270 893 102 589 13 436 93 472 61 396 137 113 19 597 1 413 878 115 225 38 707 28 992 9 715 2 347 37 174 40 843 15 173 26 047
779 15 365 25 406 9 918 32 029 19 092 33 568 6 997 5 536 15 166 1 644 3 858 2 558 2 587 2 548 531 2 674 5 848 1 980 6 304 2 441 204 413 1 622
642 3 472 1 096 1 002 569 1 348 538 588 110 718 752 8 185
83 660 9 812 346 2 760 401 433 151 122 169 1 525 1 559 326 1 040 10 446 2 752 427 659 2 787 524 101 775 3 369 5 352 3 197 6 666 2 718 1 553 144 479 1 271 4 181 427 419 3 362 2 553 3 507 403 4 023 1 325 9 149 6 953 46 337 9 259 6 432
97 355 58 035 20 918 2 557 18 980 15 583 30 778 4 421 278 217 25 861 8 569 6 441 2 128 486 7 366 8 178 3 173 6 558
192 2 954 4 981 2 127 6 631 4 033 7 99 1 389 1 007 3 528 332 780 522 535 608 109 508 1 201 399 1 400 425 47 105 345 114 722 257 258 105 366 174 130 22 182 136 3 532
16 814 2 166 102 620 88 106 20 31 35 354 312 68 193 2 697 521 152 266 942 79 28 106 644 804 663 1 359 685 168 63 70 267 753 88 89 766 551 691 73 761 330 2 001 2 109 10 504 2 168 1 831
104 909 64 979 25 165 3 133 20 831 15 850 31 039 4 614 324 227 25 874 8 892 6 838 2 054 547 8 031 8 837 3 378 5 940
193 3 292 6 195 2 510 8 314 4 660 7 99 1 593 1 365 3 420 406 981 637 664 564 149 626 1 200
409 1 354 426 51 92 383 143 752 296 253 86 341 147 148 35 189 239 2 863
18 424 2 407 96 595 )03 113 63 24 35 361 272 99 155 2 546 592
97 125 663 81 32 89 660 939 703 1 827
542 323 53 45 279 784 111 94 768 584 757 60 881 329 1 908 1 859 11 375 2 162 1 700
108 324 65 236 24 979 3 472 23 285 14 500 33 139 4 713 424 188 27 814 8 948 6 679 2 269 499 8 967 9 731 3 769 5 979
191 3 633 6 301 2 467 7 822 4 565 6 149 1 790 1 454 3 472 377 903 585 586 600 134 650 1 342 495 1 322 560 47 93 397 168 847 290 175 126 314 163 142 33 141 186 1 972
20 947 2 338 49 674 86 115 28 49 46 388 334 72 214 2 330 690 33 222 602 152 33 118 763 1 394 847 1 769 586 455 62 69 350 1 098 105 98 891 652 851 185 829 361 2 127 1 771 10 877 2 200 1 592
115 929 71 575 26 695 3 335 25 309 16 238 34 329 4 912 369 228 28 820 10 020 7 684 2 337 606 9 508 9 812 3 666 7 041
194 3 971 6 753 2 608 8 247 4 922 7 136 1 751 1 366 4 129 418 1 015 649 618 696 126 678 1 638 470 1 569 625 49 110 437 138 782 290 255 133 364 86 159 33 177 180 2 191
22 600 2 708 75 747 118 115 66 29 49 387 453 108 336 2 804 765 116 111 678 142 21 221 884 1 058 824 1 307 810 274 25 121 319 1 132
109 107 845 637 839 15 1 010 319 2 187 1 710 12 174 2 383 1 462
107 755 63 717 23 808 3 133 21 441 15 335 34 464 4 782 280 234 29 168
9 503 6 967 2 636 682 8 919 9 834 3 834 6 895
205 3 851 5 609 2 339 7 260 4 544 IO 139 1 645 1 268 3 578 389 928 608 643 679 121 658 1 336 467 1 671 579 52 103 386 162 803 247 245 163 343 131 142 27 209 192 2 037
19 077 2 364 125 694 90 95 31 23 34 384 390 57 263 2 886
632 175 138 885 121 21 209 750 1 423 756 1 581 626 299 32 113 294 981 102 95 822 617 878 133 1 042 341 2 505 1 829 11 614 2 434 1 798
114 679 SS 353 27 107 3 495 23 437 15 324 35 151 5 189 339 229 29 424 10 135 7 662 2 473 561 9 780 11 466 3 905 6 132
189 3 910 6 742 2 504 8 701 5 061 8 145 1 810 1 448 3 987 460 1 011 717 740 574 150 689 1 531 548 1 742 678
56 107 401 173 1 040 269 327 147 328 158 145 17 190 194 1 986
21 036 2 401 97 645 107 108 26 22 40 366 382 89 226 2 426 664 102 186 622 109 26 227 972 1 478 769 2 009 696 526 25 176 307 971 111 118 804 648 939 69 1 141
304 2 330 1 644 11 671 2 242 1 580
115 119 70 341 27 301 3 753 24 662 14 625 36 120 4 837 417 156 30 719 g 649 6 983 2 666 575 10 796 11 321 4 275 5 770
219 3 887 6 610 2 574 8 796 5 215 9 132 1 997 1 538 3 600 357 1 093
653 667 455 138 643 1 714 605 1 792
692 42 120 423 156 915 323 223 169 363 129 142 27 169 135 1 556 414 22 276 2 387 53 661 115 73 68 22 56 355 372 92 203 2 249 610 45 188 607 161 22 254 995 1 398 991 1 851 706 447 47 155 423 1 324 131 110 1 091 803 970 25 1 035 353 2 550 1 582 11 270 2 280 1 502
114 655 70 S M 26 823 3 570 25 665 14 932 33 537 4 352 437 186 28 563 10 141 7 601 2 540 559 9 747 9 282 4 000 6 484
271 3 400 6 505 2 811 8 630 5 206 9 171 1 983 1 327 3 890 446 1 306 689 707 389 153 736 1 497 529 1 571 506 38 100 460 186 513 322 306 137 268 157 124 36 165 123 1 526 464 23 203 2 462 90 668 114 76 20 32 60 351 346 97 190 2 373 822 168 114 899 147 23 290 704 1 151
899 1 491
524 348 25 86 368 1 149
123 100 997 696 857 67 1 080
303 2 432 1 512 11 677 2 316 1 292
109 053 53 357 24 742 3 405 21 296 13 914 35 155 4 707 345 203 29 933 10 501 7 597 2 912 676 9 487 10 764 4 240 6 407
228 3 641 5 654 2 365 7 902 4 952 8 156 1 801 1 351 4 082 360 1 253 610 737 391 148 696 1 390 473 1 830 533 38 101 373 198 938 288 306 145 267 237 119 19 220 153 1 311 459 19 135 2 161 112 598 161 86 88 26 40 342 390 69 211 2 375 598 133 171 1 070 92 23 337 501 1 970 756 1 900 511 270 25 180 326 1 065
118 113 1 078 868 889 86 1 214 306 2 760 I 549 11 222
GENERAL SUMMARY
of EC trade by country
Values in Mio ECU
E x p o r t s
1987
829 911 456 S36 339 338 209 235
90 287 12 652 80 923 25 377
104 675
14 119 6 538 1 530 82 487
25 427
19 217 6 210 3 735
34 164 29 618 8 906 13 489
685 9 512 20 192 7 014 32 772 20 112 518 725 5 398 5 561 9 189 1 086 2 332 2 078 2 372 651 1 453 2 253 3 884 1 782 2 338 3 736 396 539 987 393 2 231
928 423 302 679 484 702 902 272 253 5 000
71 899 9 024 372 1 847
433 433 175 742 742 822 2 033 371 658 3 354 823 157 235 1 757
858 608 704 1 513 3 089 4 722 7 716 1 406 2 505 714 336 1 446 5 679 439 295 1 634 1 708 1 171 379 3 194
819 5 533 3 663 13 618 3 418 4 777 23
1988
906 730 540 012 362 903 222 029
96 434 12 886 81 933 30 776
113 634
15 551 7 254 1 404 69 425
27 247
20 740 6 506 3 808
35 423 31 198 10 689 13 227
625 8 515 21 132 7 767 35 881 22 514 643 843 5 714 5 225 10 114 1 260 2 756 2 169 2 355 615 1 406 2 609 3 704 2 003 2 706 3 676 481 537 988 412 2 166
677 1 017
317 725 626 811 1 039
313 283 6 360
71 809 10 124 284 2 296 390 511 188 837 839 778 2 406 333 403 3 122 851 135 215 1 311 1 053 851 659 2 420 2 873 4 712 7 572 1 394 2 288 826 411 1 606 5 638 403 375 2 072 1 934 1 385 319 4 067 912 5 802 4 392 17 020 4 460 6 772 26
1989
1043 289 625 722 413 010 248 715
107 968 14 947 88 675 37 128
131 197
16 627 8 307 1 683 104 580 33 056
25 870 7 216
4 557
40 699 35 031 14 110 15 109
592 8 607 24 058 9 372 40 071 25 268 773 1 064 7 031 5 609 12 603 1 661 3 945 2 385 2 988 689 1 477 3 226 4 715 2 531 2 911 3 764 423 641 1 142
453 2 216 758 722 345 787 819 891 1 150
395 353 6 450
78 020 10 655 242 3 511 563 587 133 962 896 865 1 667 391 371 3 841 1 207 117 252 1 161 1 438 829 7B0 3 053 3 286 5 101 8 805 1 671 3 110 742 414 1 460 7 083 445 391 2 765 2 039 2 049 574 5 486 1 197 6 369 5 207 21 130 5 206 7 023 35
1988 III
219 510 128 142 90 415 55 161
23 268 3 105 20 700 8 088
25 565
3 833 1 727 339 22 666
6 690
4 815 1 875
1 053
8 375
7 710 3 045 3 468
165 2 024 4 824 1 837 8 831 5 587 174 200 1 358 1 273 2 341 328 616 493 553 123 340 583 867 465 641 856 133 130 253 95 539 170 245 75 188 144 203 250 77 70 1 732
18 109 2 591 86 597 91 112 63 186 190 187 633 77 103 880 210 42 54 350 259 223 145 610 682 1 139 1 863 337 519 255 131 383 1 418 77 102 582 606 382 122 1 069 282 1 713 1 174
4 459 1 133 1 832 6
IV
250 975 145 301 101 593 61 629
26 652 3 462 22 765 8 750
31 878
4 294 2 131 391 25 063
5086
6 277 1 809
1 084
9 775 6 701 3 062 3 701
143 2 290 6 160 2 194 9 570 6 295 175 255 1 662 1 233 2 904 414 936 726 712 187 381 749 1 079
589 670 1 068
126 161 268 116 606 192 250 80 200 209 238 285 91 81 1 689
20 119 2 646 69 668 113 145 38 251 235 190 709 91 96 859 252 31 67 331 288 276 194 718 786 1 240 2 015 404 702 207 99 426 1 491 143 111 575 560 383 98 1 215
229 1 611 1 288
4 832 1 225 1 951 7
1
249 477 152 159 96 363 56 000
25 774 2 989 20 646 8 592
30 775
4 048 2 014 390 24 323
7 587
5 572 2 016
955
9 078 8 160 3 095 3 466
147 2 013 5 869 2 257 9 523 5 964 162 228 1 436 1 057 2 785 352 842 480 629 123 333 736 1 024 565 606 917 108 177 313 106 491 181 151 103 174 166 182 258 83 74 1 611 18 104 2 542 34 715 133 147 41 211 214 190 510 80 74 847 231 30 62 324 375 234 151 732 775 1 257 2 145 409 732 160