This is a repository copy of Dust devil dynamics. White Rose Research Online URL for this paper: http://eprints.whiterose.ac.uk/104394/
Version: Accepted Version
Article:
Horton, W., Miura, H., Onishchenko, O. et al. (5 more authors) (2016) Dust devil dynamics. Journal of Geophysical Research: Atmospheres, 121 (12). pp. 7197-7214. ISSN
2169-897X
https://doi.org/10.1002/2016JD024832
[email protected] https://eprints.whiterose.ac.uk/ Reuse
Unless indicated otherwise, fulltext items are protected by copyright with all rights reserved. The copyright exception in section 29 of the Copyright, Designs and Patents Act 1988 allows the making of a single copy solely for the purpose of non-commercial research or private study within the limits of fair dealing. The publisher or other rights-holder may allow further reproduction and re-use of this version - refer to the White Rose Research Online record for this item. Where records identify the publisher as the copyright holder, users can verify any specific terms of use on the publisher’s website.
Takedown
If you consider content in White Rose Research Online to be in breach of UK law, please notify us by
Dust Devil Dynamics
W. Horton,1,2 H. Miura,3 O. Onishchenko,4,5 L. Couedel,2 C. Arnas,2 A. Escarguel,2 S. Benkadda,2 V. Fedun6
1The University of Texas at Austin, USA.
2Laboratorie de Physique des Interactions
Ioniques et Moleculaires, Centre National de la Recherche Scientifique/Aix–Marseilles Universities, 13397 Marseilles, France.
3National Institute for Fusion Science,
509–5292 Toki, Japan.
4Institute of Physics of the Earth, 10 B.
Gruzinskaya, 123242 Moscow, Russian Federation.
5Space Research Institute, 84/32
Profsoyuznaya str., 117997 Moscow, Russian Federation.
6University of Sheffield, Mappin Street
Sheffield, S1 3JD United Kingdom.
Abstract.
Key Points.
◦ Main point #1: Surface heating drives unstable gravity waves that develop into complex dust devil vortices.
◦ Main point #2: Toroidal rotation in dust devils evolves form the driven vertical flows from the surface layer producing complex 3D structures.
1. Introduction
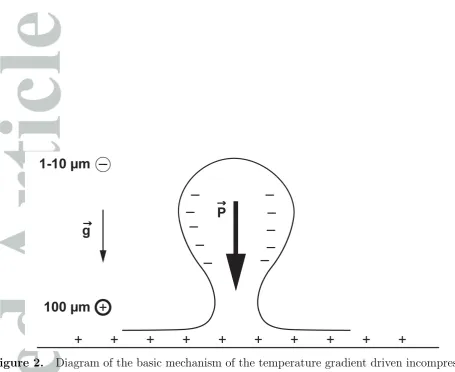
Dust devils are localized, complex vortical structures driven by inverted temperature gradients over hot, dry sandy soils and give one of the possible mass flow configurations in-ferred from the dust devil field data taken fromBalme and Greeley [2006]. Figure 1(a)-(b) show the structure given by Balme and Greeley. Figure 2 gives our version of the electrical structure from the differential motion of the dust, aerosol, particles from the triboelectric charging of the sand transported by the hydrodynamic flows reported in the field obser-vations along with knowledge from plasma physics of toroidal structures. In the lower core of the structure the atmospheric flow patterns are of rising hot air. Outside the core there is falling of cooled air. From the field data there is also the tangential, and thus a toroidal flow velocity vθ shown in Fig. 2. The toroidal flow adds to the vertical flow to produce the swirling helical structures of dust devils.
The vortex structure moves horizontally so as to feed on new layers of inverted mass density material, thus maintaining the power driving the kinetic energy of the vortex against friction and viscosity. While external horizontal wind shear may enhance the strength of the vortex, external sheared flow is not an essential ingredient in our analysis, owing to the nonlinear transfer of energy from the poloidal to the toroidal flows.
crite-rion [Schwarzschild, 1998] for atmosphere instability against convection. The dynamical rate of growth is estimated from (g/Lp)1/2 where the mass density scale lengthLp is much less than the pressure gradient scale height H in the hot desert atmosphere. For incom-pressible motions in a gas with adiabatic gas constantγ the formula for the Brunt–V¨ais¨al¨a frequency becomes (gdlnθ/dz)1/2 where θ is the potential temperature for the gas. The unstable air dynamics drives an upward and horizontal air flow from the energy released by gravity from the reversed mass density in the hot–surface air layer. The instability follows simply from the formulas for internal gravity waves with the equation of state for air. The critical vertical–temperature gradient for the onset of the dust devil vortex is derived and approximated as observed of 1-10oC/m, in the first few meters of hot surface air over the sandy soil.
As the critical temperature gradient is reached, the low–frequency f < mHz internal gravity waves become [bifurcate] complex exponential growing modes. These unstable gravity waves produce vertical–horizontal vortex flow structures rising from 100 m to 1 km with their vorticity vectorω =∇ ×v in the horizontal plane. Without external sheared– horizontal winds the flow becomes unstable through a nonlinear bifurcation to a horizontal toroidal flow that can exceed the velocities of the original vertical–horizontal flow. The higher–speed toroidal or tangential flow creates a lower–pressure region in the core of the dust devil structure that has been measured in several field experiments and modeled in several computer simulations [Houser, et al., 2003].
which either lifts the dust and sand directly or balances the downward gravitational force on the sand sufficiently to allow electrostatic forces from triboelectricity to lift the smaller, lighter sand and dust into a high rising column [Kok and Renno, 2006]. The bouncing of the sand, called saltation, transfers weakly–bound surface electrons from the larger to the smaller diameter particles (sand – principally SiO2 during the collisions [Lacks and Levandowsky, 2007]. Each grain forms a small capacitor with capacitance given by Cd = 2πϵ0d where d is the diameter of the grain and ϵ0 is the free space permeability. The vertical stratification of the grains by mass separates the particles so that the lighter negatively–charged particles rise to the top of the vortex structure as shown in Balme and Greeley [2006]. The result is a large vertical electric field and a large electric dipole moment shown as P. The first observations [Freier, 1960; Crozier, 1970] on dust devils
report measuring a kV/m vertical electric field and give estimates of the electric dipole moment PE of order a Coulomb–meter red[C-m] from the first data on dust devils. This
electric field then enhances the pickup, or lifting, of the smaller sand grains as shown in the experiments of Kok and Renno [2006]. Thus there is feedback loop in the charge separation that builds up the electric dipole moment and the lifts the negatively–charged grains of sand to considerable heightsH >100 m. Since the vortex structure is dynamical with significant fluctuations, the oscillations of the charged dust generates radio frequency (RF) waves from the oscillations of the charges as well as an acoustical signal that is heard and recorded in movies of dust devils. In addition, the circular vortex motion of the charges creates a fluctuating magnetic field.
emission was recorded at two bands: 5-20 Hz and 30-50 Hz. The peak emission is steady for 10 s and decreases over the next 25 s as shown in magnetic spectrograms inFarrell, et al. [2000]. In June 2001 a campaign was carried out in Arizona 5 km southwest of Eloy, Arizona with scientists from GSFC, UC Berkeley, Glenn RC, Ames, JP:L and Optech, Inc. This campaign used a variety of instruments simultaneously integrating the data at high speed of 40 kS/s. Studies of the individual events are found in Renno, et al. [1998] and a summary of the MATADOR 2002 field test is given in Renno, et al. [2004]. Since that early study the nature of the wind–driven pickup of the grains by triboelectric charging has been parameterized in more detail by several research groups [Lacks and Levandowsky,
2007].
moved by the wind, bouncing along the surface against the force of gravity. The collisions between the larger and smaller bouncing particles gives the smaller particles a negative charge. There is a complex interplay between gravity, electric forces and wind shear stress that ejects, or lifts, the dust into the air. Once the small mineral particles are ejected they are transported by the frictional force from the wind and vortex flows for long distances and to high altitudes. Kok and Renno [2006] report laboratory data on the critical electric field required to lift sand grain particles of several sizes. They report experiments with Sonoran desert particles in Arizona ranging from 20 to 300µm with fourteen sample sizes to test the formulas derived for the lifting conditions. The experiments show the critical electric field above which the particles are lifted. The authors give a formula for the wind velocity threshold combined with the electric field threshold for lifting sand particles.
One of the earliest reports estimating the electric field is Freier [1960] from dust dev-ils observed in the Sahara Desert, West Africa at the time, during the a solar eclipse expedition. The report notes the field reaches at least 400 V/m and could be modeled by an electric dipole moment M = 0.6 Cm (reported as 1.7×10⁹esu m at the height of
al. (2005)]. There are observations by Mars explorers of giant dust devils adding further to the interest in the complex dynamics [Farrell, et al., 2004]. A curious event is noted on the NASA website of the change in the performance of a solar panel array after the passage of Martian dust devil over the panel. There are many large tracks over the surface of Mars from the dust devils.
are commonly observed convectively–driven regions of the solar atmosphere [Wedemeyer, et al. [2012] andLi, et al. [2012].
We use simple parameterizations from the Lacks and Levandowsky [2007] experiments in our hydrodynamic model to calculate the amount of sand and mineral dust raised in a dust devil. The explicit of the hydrodynamics may add confidence in the meteorology communities’ ability to estimate and forecast the amount of material in the atmosphere to be used in global circulation models of the troposphere. From the particle charge distri-bution versus particle radius distridistri-bution shown inLacks and Levandowsky [2007], we can estimate the vertical electric field from the stratification of the particles. As an example, we note that the dust storms in the Panhandle in northwest Texas bring significant layers of dust into homes in Austin and San Antonio, more than 500 km southeast. The dust storms can reduce visibility to 1 km [Goudie, 1983].
In Sec. 2(a) the generation of the dust devil by the unstable vertical convection is derived in the vertical/horizontal flow velocities which is driven by the vertical tempera-ture gradient. In Sec. 2(b) the nonlinear coupling of the toroidal vorticity to a vertical vorticity is derived. The energy conservation and the flow of the cross–helicity equations are analyzed. In Sec. 3.2 the numerical simulations are discussed and the transport of the dust is calculated. Sections 3 and 4 discuss the desert observational data and the pro-posed laboratory experiment required to validate the theory-simulation model for weather forecasting. Section 5 gives the conclusions.
2. Dust Devil Generation from Temperature Gradients
struc-tures. The poloidal flows [horizontal/verticalvr, vz flows] are driven by the instability that arises from the inversion of the mass density stratification (a form of the Rayleigh–Taylor instability) from solar heating of the air by the hot sandy surface soil. We show that the initial unstable vertically stratified atmosphere results in large–scale toroidal motion generating the dust devil vortex structures. The velocities are low compared with the speed of sound 300 m/s and thus we take them as incompressible as given by the stream function Ψ(r, z) where vr =−(∂Ψ/∂z) and vz = (∂Ψ/∂r).
2.1. Two– and three–dimensional dust devil dynamics
In the gravitational, unstable lower level of the air, there are two types of nonlinear vortices. They are 2D rolls and three–dimensional vortex rings. For the two–dimensional rolls we take axis of the roll in the y–direction which wraps in to ring becoming the azimuthal direction ϕ in the vortex ring in the 3D vortex. The vertically–upward fluid motion with velocityvz and the horizontal motion with velocityvx. For 2D incompressible flow the velocity in a vertical slice across the vorticity vector is called the poloidal plane. In this plane the velocity vector is derived from the stream function Ψ as follows:
v = ˆy× ∇Ψ =
(
∂Ψ
∂z,0,−
∂Ψ
∂x
)
= (u, v, w). (1)
The curl (rotation) of momentum equation gives
∂
∂zρ
∂ ∂z
∂
∂tΨ +
∂
∂xρ
∂ ∂x
∂
∂tΨ =g
∂
∂xρ. (2)
The conservation of mass for the incompressible 2D flow is
∂ρ ∂t − ∂Ψ ∂x ∂ρ ∂z + ∂Ψ ∂z ∂ρ
∂x = 0. (3)
The amplitude of the waves increases with height as the density drops from the conser-vation of energy.
In the 3D vortex flow we use u = vr and w = vz for the velocity flow in the poloidal plane and vφ is the toroidal velocity. Here (r, ϕ, z) are the cylindrical coordinates. We will assume the mean fields averaged over the fluctuations have symmetry in the toroidal angle variable ϕ. The conservation equation for the airborne dust of mass density ρd, along with the surface layer source term Sd, is given by
∂ρd ∂t + 1 r [ ∂ρd ∂r ∂ψ ∂z − ∂ρd ∂z ∂ψ ∂r ]
where there is a source of dust proportional to the upward air velocity near the surface at zm. Equation (4) is in the limit of vanishing slippage between the dust and air flow in a small–surface layer at z = zm. The source of the dust at the layer zm is defined wheredw/dz = 0 or wis a maximum and thenSd is the surface density at the top of the boundary layer of the bouncing/saltating dust, as described in Fig. 2.
In the approximation where the density under the operators on the left–hand side of Eq. (3) can be taken as constant the operator on ψ is the Grad–Shafranov operator of equilibrium toroidal MHD. The operator is denoted by ∆∗
in plasma physics and numerous programs are available for inverting the Grad–Shafranov problem. The linearized forms of the density–weighted toroidal–vorticity equation determines the eigenmodes of the con-vection. For the vertical mass density function ρ(z) the Laplace transform of exp(γt) of the toroidal vorticity equation gives
r ∂
∂r ρ r
∂
∂rΨ +
∂
∂zρ(z)
∂
∂zΨ =
ρN2(z)
−γ2 r
∂ ∂r
1 r
∂
∂rΨ. (5)
In Eq. (5) the function N2(z) is the Brunt–V¨ais¨al¨a frequency from the vertically mass density profile ρ(z).
In the limit of weak stratification above the unstable mixing layer, we can reduce the full nonlinear dynamics as incompressible 3D turbulence with
ω =∇ ×v,
∂ω
∂t +v· ∇ω =ω· ∇v+∇ρ×
∇p
ρ2
(6)
follows by solving the Bernoulli equation
∆
(
p
ρ +
1 2v
2
)
=−∇ ·(v ×ω). (7)
Once the convection has reached a steady state, a simple, classical vortex solution of the axisymmetric 3D Navier–Stokes equations – without the vertical stratification – applies. The steady state solution is the Burgers vortex. (Burgers vortex is an exact solution to the Navier–Stokes equations governing viscous flow.) We apply this solution and use it to assess the pressure field from the computer simulations of incompressible vortex flow. The Burgers vortex gives the pressure drop from the high speed flows in the core of the dust devil that are an expression of the Bernoulli law. The Bernoulli law in the vortex flow states that the cross–product of the vorticity and flow velocity vectors give rise to a force balancing the gradient of the dynamical pressure that is the sum of the thermal pressure per unit mass and the kinetic pressure from flow velocity. The cross product of the vorticity vector and the flow velocity are analogous in plasma physics vortex problem to the j×B force where the incompressible velocity field plays the role of the magnetic field and the vorticity is the current density j.
The core of the vortex is a viscous region where the flow is converted from radially– converging to upward–increasing velocity. The flow in this core region is close to that given by the Burgers vortex with stream function Ψ(x, z) =ωz =αr2z/2, which gives the flow fields
vr =−αr/2
vz =αz
vφ=uφ(r).
The toroidal flow velocity vφ is determined by the radial force balance equation and the equation for the axial vorticityωz with viscosity ν. The toroidal velocity is given as
uθ = αΓ
2πν
(
1−exp
( −αr 2 4ν )) . (9)
Returning to the radial force balance equation and calculating the radial integral of the centrifugal acceleration, one obtains the depression in the pressure field given by
p ρ = po ρo − 1 2α
2z2
−18α2r2−
(αΓ
2πr
)2∫ ∞
r dr1r
−3
1
[
1−e−α(r1)2/4ν]2
. (10)
In this vortex [Kida and , 1998] the pressure drops in the core of the dust devil by
p−po
ρo ≃ −
(αΓ/2π)2
2r2 for r≥2.24
(ν
α
)1/2
. (11)
Measured pressure drops in the core of the dust devils are of order 100 Pa [Balme and Greeley, 2006]. The pressure drops to a local minimum at rmin given approximately by
rmin = 2
( Γ
2π
) 1 2 ( ν
r2
dα
)1/3
. (12)
The exponential growth of the vertical vorticity from the nonlinear interactions between the poloidal and toroidal velocities in the nonlinear dynamics is derived following the analysis of Onishchenko, et al. [2014].
2.2. Axisymmetric solutions of the 3D dust devil flows
In the current study of the waves in the atmosphere we neglect the influence of dissi-pative processes, i.e. viscosity, thermal conductivity, heat flow from outside, friction, etc. The initial set of equations is the equation of motion (18) and (14) and the transport equation (19) for the potential temperature θ=p1/γ/ρ:
dv
dt =−
1
and
dθ
dt = 0. (14)
Here ρ and p are the density and pressure respectively, d/dt = ∂/∂t+v∇ is the Euler (convective) time derivative,vis the velocity of matter,g=−gˆzis the gravity acceleration and ˆz is the unit vector directed along the vertical axis z. We use the ideal gas law p/ρT = const, where T is the temperature to complete the set of equations .
In terms of the vorticity vector, ω=∇ ×v, the dynamics reduces to ∂ω
∂t + (v· ∇)ω= (ω· ∇)v+
1
ρ2[∇ρ× ∇p]. (15)
As a result, from Eqs. (13) and (14) one obtains a system of two nonlinearly coupled equations for the poloidal stream function ψ and the normalized mass density fluctuation χ=gρ/ρ˜ 0 combine to give
∂ ∂t
(
∆∗
ψ+ dln (ρ0)
dz dψ dz
)
+1
rJ(ψ,∆
∗
ψ)
=−r∂χ
∂r +
r
ρ2
0
J(˜ρ,p˜) (16)
coupled to
r∂χ
∂t −ω
2
g ∂ψ
∂r +{ψ, χ}= 0 (17)
where
∆∗
=r ∂ ∂r 1 r ∂ ∂r + ∂2
∂z2, (18)
In obtaining Eq. (17) we neglect by the wave–pressure perturbations compared to the density perturbations, considering low–frequency waves when (ω2/c2
skr2)Lρ∂/∂z ≪
L−1
ρ = d(lnρ)/dz is the characteristic density inhomogeneity scale in vertical direction. Beforehand, we consider that |vz| ≫ |vr|, i.e. consider that∂/∂r ≫∂/∂z.
In the linear approximation one derives the growth of the vertical vorticity from initial poloidal flows. From equations (16) and (17) one finds that
∂2
∂t2
(
∆∗
ψ− ψ
4L2
ρ
)
=−ωg2
( r ∂ ∂r 1 r ∂ ∂r ) ψ. (19)
In the unstably–stratified layer (ω2
g < 0) and in the approximation ∂/∂r ≫ 1/Lρ, we obtain from Eq. (19) ψ ∝exp(γt) whereγ =|ωg|.
2.3. Exponential Growth of the Toroidal Rotation
Consider a simplified model for the stream function
ψ = αr
2z
2 ·exp
(
γt− r
2
r2
0
)
, (20)
wherer0 is the vortex radius. Then ∆∗ψ =−4α
(
2− rr22 0 )
ψ and
vr =−1
r ∂ψ
∂z =−
αr 2 ·exp
(
γt− r
2 r2 0 ) (21) and
vz =
1 r
∂ψ
∂r =αz
(
1−r 2 r2 0 ) ·exp (
γt− r
2
r2
0
)
. (22)
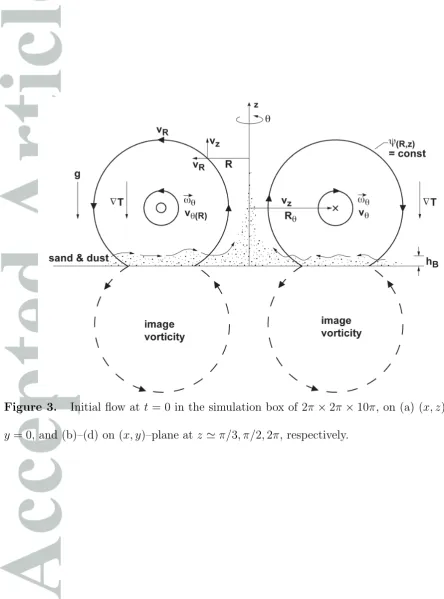
Thus, we have derived exponentially growing ascending flows vz > 0 in the vortex core region at r < r0 and the descending flow vz < 0 in the external region at r > r0. The computer simulations in Sec. 3 of the full hydrodynamics are consistent with this analytic result but show the flows can be pulsating in time.
ωφ= ∂vr
∂z − ∂vz ∂r = 1 r∆ ∗
ψ =−
(
r2
r2
0
) (
2− r 2
r2
0
)
ψ. (23)
∂ωz
∂t +vr
∂ωz
∂r =ωz
∂vz
∂z . (24)
Thus the parameterα corresponds to the horizontal vorticity at 2rz=r2
s, where r2s is the radius at t= 0. To derive the evolution of the vertical vorticity ωz we use
∂ωz
∂t +vr
∂ωz
∂r =ωz
∂vz
∂z . (25)
For the initial flowωz =ωz(0, r) is a large scale seed vorticity. Now we consider the initial state with a small seed initial toroidal rotation given by the vertical vorticity
ωz(0, r) = v0
R
[
1−exp
(
−r2
R2
)]
(26)
where R is the characteristic radius of the large–scale toroidal component of vorticity ωz. We consider that R ≫ r0. In the approximation r2/R2 ≪ 1 we have ωz(0, r) = Ωr2/R2. Taking into account (22) we derive an exponential growth of vertical vorticity given approximately by
ωz(r, t) = exp
[( 2α γ ) ·exp (
γt−r
2
r2
0
)]
. (27)
3. Simulation of the Rotational Spin–up of a Dust Devil
3.1. Outline of the simulations
In this subsection, we solve the compressible Navier–Stokes equations
∂ρ
∂t =−
∂(ρvj)
∂xj , (28)
∂(ρvi)
∂t =−
∂(ρvivj)
∂xj − ∂p ∂xi + 2 Re ∂ ∂xj (
Sij −1
3δij ∂vk ∂xk
)
−ρgδi,3, (29)
∂ET
∂t =−
∂
∂xj [(ET +p)vj] +
1
M2
0Pr Re(Γ−1)
∂2T
∂xj∂xj + 1 Re ∂ ∂xj { vi [(
Sij − 1
3δij ∂vk
∂xk
)]}
−ρv3g, (30)
ET = p
Γ−1 + 1
2ρvivi, (31)
p= 1
ΓM2 0
ρT, (32)
Sij = 1
2 ( ∂vi ∂xj + ∂vj ∂xi ) (33)
boundary condition at the other boundaries. We approximately cut out the vortex solution at the center of the computational box of the dust devil simulation by the Oseen’s vortex with an axial flow, embed the solution in the triply–periodic box and simulate its nonlinear evolution by the use of a pseudo–spectral code, which has been used inMiura [2002,2004], in order to see the evolution more closely with higher numerical precision.
particles are transported in the simulations. Although dynamics of Burgers vortex have been studied extensively, autonomous generation of a swirling flow due to the instability of the axial (poloidal) flow in the context of Secs. 2 and 3 is not well studied. Also, the particle transport of the test particles in the Burgers vortex is not sufficiently stud-ied in 3D. As we will see in the succeeding paragraph, numerical simulations with these boundary conditions which generate dust devil flows are a form of the Burgers vortex with complex axial flows. After we show the generation of the toroidal flow out of the poloidal flow due to the instability, we take out a central region of the dust devil–like flow and put in a triple–periodic condition so that the velocities can be resolved on a higher resolution grid. For simplicity in the second simulation, the temperature is uniform in the axial (z–direction).
3.2. Numerical simulations of dust devil generation by the unstable vertical
convection
small–amplitude perturbation. We also allow that the upward velocity is below or above the Mach number 0.1.
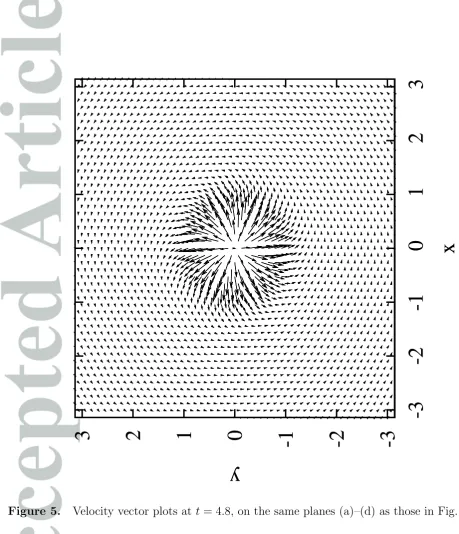
dynamics moves to complex structures which consist of multiple vortices. The complexity of flow is studied more closely in the next subsection.
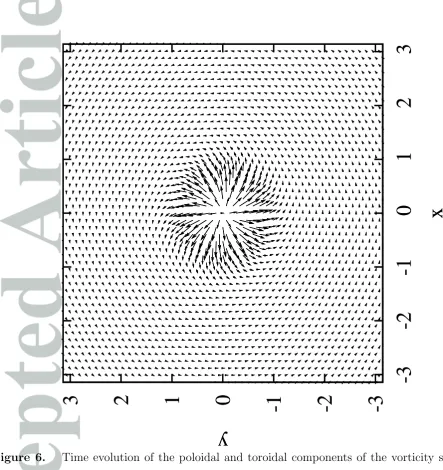
In Fig. 6, the time evolution of the poloidal and toroidal components of the vorticity squared, ΩH = ⟨ωr2⟩+⟨ωθ2⟩ and ΩZ = ⟨ωz2⟩ are shown. Here the brackets indicates the volume average ⟨·⟩ = ∫π
0 dr
∫2π
0 dθ
∫H/4
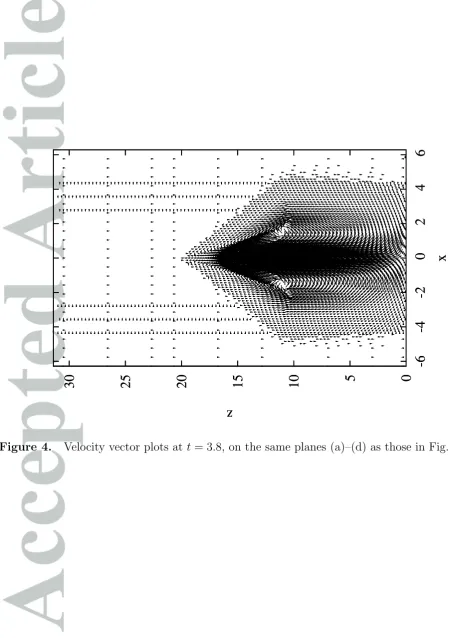
0 dz, where x = rcos(θ) and y = rsin(θ). Initially, ΩH is much larger than ΩZbecause of the initial condition. In the initial transient phase of the simulation t <1, the averaged horizontal vorticity ΩH decreases. Then ΩH increases because the vertical flow is enhanced by the buoyancy instability until the growth is saturated at t = 3. During the time evolution ΩZ is enhanced. The enhancement of ΩZ is essentially due the conversion of the vertical flow into the swirling motions on the horizontal plane while conserving energy.
3.3. Vortex core simulations for fine structures in dust devil
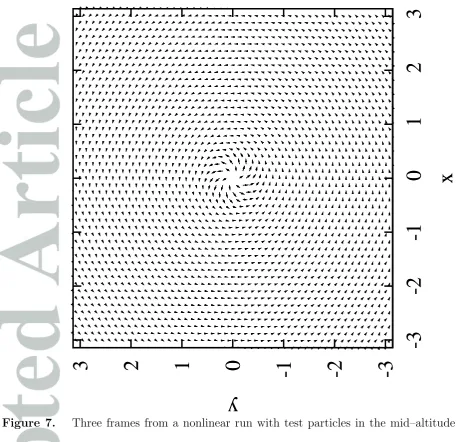
Next, we focus on the vortex deformation at the dust devil core. We trim the dust devil vortex solution at the center out of the computational box, approximately expressing the solution initially by the Oseen’s vortex (the Burgers vortex without the shear) with an axial flow, and embed the solution in the triply–periodic box. Then the evolution of the vortex is simulated by the use of the pseudo–spectral code in order to see the evolution.
[001] at early time has a weak helical modulation, the middle frame [150] shows a strong helical modulation and the right frame [223] at late time has again a smaller amplitude helical modulation. The time interval spans approximately four revolutions of the dust devil. The movies show that the structure fluctuates slowly in time as it rotates. Over the course of 4 rotations we see low mode number m = 2,3,4 corrugations develop and dissolve in the column. Here we give the first, middle and final time structures from the movie in Fig. 7 after several rotations and frame after several more rotations. The overall structure is stable for many rotations and these substructures of helical corrugations are found to come and go in time. We do not attempt to analyze this complex dynamics further in this work.
Thus, we see the complex nonlinear helical structure results from the combination of the negative buoyancy of the lower density hot air driven by the solar heating of the soil. Followed by the onset of the poloidal flow pattern. Once the poloidal flow velocity has significant energy then any seed perturbation in the symmetry of the flow results in the exponential growth and saturation of the rotation motion. This complex nonlinear structure is then robust and moves horizontally easily as small external sheared flows dictate. In the process the structure finds new low lying areas of heated air to drive the thermal convection engine for hundreds of rotations.
3.4. Electrically–charged dust particles and their dynamics
dominant mechanical drag force vector FD acting on the dust particles of mass m is
FD(r) = −
(
πd2ρ
8
)
CD|vR|vR, (34)
where vectorvRdenotes the relative velocity of the particle with respect to the fluid (air). The drag coefficient CD varies with Reynolds number Re =ρ|vR|d/µ approximately as
CD = 24
(
1 + 0.15 Re2/3 Re
)
. (35)
The forces on particles during tribocharging is an active area of research since the processes are poorly understood, but are used in a number of practical applications [Ireland and Jameson, 2013]. Ireland and Jameson give comparisons of the force formulas using data in cylindrical cyclone tribochargers.
For the dust, in addition to this collisional drag force, there are three forces from (1) the pressure gradient Fp over the diameter d of the dust particle, (2) the buoyancy force FB, and (3) the drag from the accumulation (mass accretion) of mass Fm. We follow Gu, et al. [2006] and take these forces as
Fp =−
(
πd2
4
)
∇p
FB =
πd3(ρp−ρ)
6 g, (36)
Fm = πd
3ρ
12 du
dt,
whereρp is the mass density of the dust particle andρ is the mass density of the air.
3.5. Hydrodynamics with test particles
but when there is an inward boundary velocityvr(r =R)<0, the vortex solutions give the hourly condition. We compare the results with vt(r =R, z) = 0 with driving tangential flowvt(r=R, z) = (2 m/s)(1−exp(−z)) as used byGu, et al. [2010].
Gu, et al. [2010] compare their results with wind tunnel data from Dong, et al. [2002], who express their data in terms of the parameterization of sand transport fluxq(z) given by
qn(z) =aexp
(
−zb
)
. (37)
Data from Gu’s simulation use the flux parameters as a = 0.01 g/ms and b = 10−20 cm with a scan over grain sizes giving that grains of size 100-250µm are most effectively lifted.
We are currently performing simulations using the hydrodynamic and magnetohydro-dynamic codes of Miura and Nakajima [2010], using the parameters given by Gu, et al. [2010]. From experience in Texas, we know that the dust storms in the panhandle and west Texas bring significant layers of dust even into homes in Austin and San Antonio. Dust storms can reduce visibility to 1 km [Goudie, 1983].
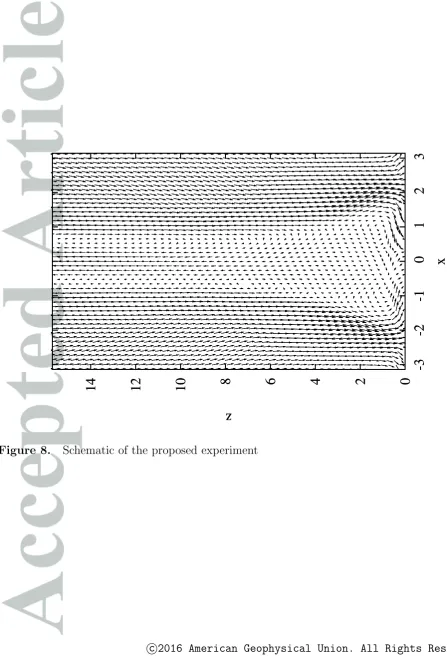
4. Proposed Laboratory Experiments
are to be contained in a glass cylinder of 0.75-1 m diameter and 1.5-2.0 m height. The cylinder will be closed at the bottom by a metallic electrode which will be temperature regulated. The desired temperature range will be from room temperature up to 400 K. The top of the cylinder will also be closed by a glass electrode with a conductive metallic layer which will be kept at room temperature. Each electrode will be independently biased (Vbias ∼ 0−5 kV) in order to study the influence of an electric field on the formation of dust devils. On the bottom electrode, a layer of calibrated dust particles will be spread (mono–sized particles or a mixture of small and large particles). The material and size of the dust particles as yet to be defined. The considered size range is 10-1000µm and the proposed materials are silica, melamine formaldehyde and polystyrene. Gas (dry air, nitrogen or argon) will be injected in the cylinder by a tube located a few centimeters above the particle layer and extracted from the system by another tube located below the top electrode. The pressure inside the cylinder will be controlled in the range 0.5-3 atm. Experiments in both flowing gas and static gas configurations will be performed.
In order to track the motion of the dust particles, a two–laser sheet illumination system will be installed. The first sheet will be horizontal and parallel to the lower electrode; its position will be adjustable. The dust particles will be imaged with a high–speed video camera placed above the transparent top electrode. The second laser sheet will be vertical and will be positioned to go through the cylinder axis. A second high–speed video camera will be used to record the particle motion from the side.
5. Conclusion
gradient the internal gravity waves are unstable and grow exponentially in amplitude. The limit on the growth occurs when the nonlinear coupling of the driven poloidal flows, meaning the vertical and radial velocity components in the cylindrical model of the dust devil, become sufficient to drive the toroidal flows. The poloidal flow has toroidal vorticity vector which through the 3D equations for the vorticity drives a toroidal flow producing a vertical vorticity. In the core of the structure the vortex is modeled with the Burgers vortex that includes the viscosity of the air as the dissipation mechanism. A steady nonlinear state is reached provided the vortex structure moves over freshly heated desert soil to maintain the strength of the thermal instability in the vertical flow in the core of the dust devil. A small external shear flow may serve as finite amplitude “kick” or perturbation to start the nonlinear rotation dynamics and determine the direction of rotation. In the field reports an approximately symmetric distribution of cyclonic and anti–cyclonic dust devils are recorded. The 3D nonlinear simulations are shown to verify this sequence of steps and allows one to visualize in detail with movies and with cross–sectional plots of the velocity vector flow fields both in the growing phase and the quasi–stationary nonlinear saturated states of the dust devil. The results show that there is a variety of nonlinear states available depending on the geometry and the parameters. However, the states found resemble well those reported in the field data summarized here. Thus, the simulation code may be useful for building models for the source rate of injecting dust into the atmosphere for global weather predictions for sub grid–scale sources of dust in general circulations models.
We derive the critical temperature gradient for the onset of the initial vertical convection that evolves from the buoyancy instability when the hot air near the sandy surface becomes lighter than the heavier cooler overlying air. Then we show that once there is sufficient amplitude or energy in the vertical convective cells or poloidal flows there is the onset of a toroidal rotational instability of the nonlinear parametric instability type from nonlinear interactions in this complex system. For a simple model of the poloidal convection we derive the formula for the growth rate of the toroidal rotation.
Acknowledgments.
This work was partially supported by Aix–Marseilles University and through the Insti-tute Mediterranean for Advance Research, grants to The University of Texas at Austin from the Department of Energy and the Applied Research Laboratory and through the Program of Russian Academy of Sciences N 15, and by RFBR through grant 15-05-07623. This work was also partially supported by JSPS KAKENHI Grant Number 23540583 and MEXT KAKENHI Grant Number 15H02218, Japan. Simulations were performed at the Institute for Fusion Science in Toki, Japan and at the Texas Advanced Computing Center [TACC] at The University of Texas in Austin. This work was partially supported by the U.S.-Japan Joint Institute for Fusion Theory (JIFT) program. The authors acknowl-edge assistance with the visualizations from Greg Foss at TACC. No original data was used in this paper. Computer simulations used in this paper can be requested from the corresponding author ([email protected]).
References
Arnas, C., A. Michau, G. Lombardi, L. Coue¨del, and Kishor Kumar K, Effects of the growth and the charge of carbon nanoparticles on direct current discharges,Phys. Plas-mas, 20, 013705 (2013), http://dx.doi.org/10.1063/1.4776681.
Balme, M., and R. Greeley, Dust devils on Earth and Mars,Geophys. Rev., 44, 3 (2006),
http://dx.doi.org/10.1029/2005RG000188.
Crozier, W. D., Dust Devil Properties,J. Geophys. Res., 75, 24, 4583–4585 (1970),http: //dx.doi.org/10.1029/JC075i024p04583.
DeMott, P. J., K. Sassen, M. R. Poellot, D. Baumgardner, D. C. Rogers, S. D. Brooks, A. J. Prenni, and S. M. Kreidenweis, African dust aerosols as atmospheric ice nuclei,
Geophys. Res. Letts., 30, 14 (2003),http://dx.doi.org/10.1029/2003GL01741.0. Dong, Z., X. Liu, H. Wang, A. Zhao, and X. Wang, The flux profile of a blowing sand
cloud: A wind tunnel investigation, Geomorphology, 49, 219–230 (2002).
Farrell, W. M.,et al., Electric and magnetic signatures of dust devils from the 2000D2001 MATADOR desert tests, J. Geophys. Res., 109, E03004 (2004), http://dx.doi.org/
10.1029/2003JE002088.
Farrell, W. M., P. H. Smith, G. T. Delory, G. B. Hillard, J. R. Marshall, D. Catling, M. Hecht, D. M. Tratt, N. Renno, M. D. Desch, S. A. Cummer, J. G. Houser, and B. Johnson, Electric and magnetic signatures of dust devils from the 2000–2001 MATADOR desert tests, J. Geophys. Res.: Planets (1991–2012), 109, E3, http:
//dx.doi.org/10.1029/2003JE002088.
Freier, G. D., The electric field of a large dust devil,J. Geophys. Res., 65, 10, 3504 (1960),
http://dx.doi.org/10.1029/JZ065i010p03504.
Goudie, A. S., Dust storms in space and time, Prog. Phy. Geog., 7, 4, 502–530 (1983),
http://dx.doi.org/10.1177/030913338300700402.
Greeley, R.,et al., Martian variable features: New insights from the Mars Express Orbiter and the Mars Exploration Rover Spirit,J. Geophys. Res., 110, E06002,http://dx.doi/
Greenwald, M., Boivin, R. L., Bonoli, P., Christensen, C., Fiore, C., Garnier, D., Goetz, J., Golovato, S., Graf, M., Granetz, R., Horne, S., Hsu, T., Hubbard, A., Hutchinson, I., Irby, J., Kurz, C., LaBombard, B., Lipschultz, B., Luke, T., Marmar, E., McCracken, G., Niemczewski, A., O’Shea, P., Porkolab, M., Rice, J., Reardon, J., Schachter, J., Snipes, J., Stek, P., Takase, Y., Terry, J., Umansky, M., Watterson, R., Wolfe, S., Bombarda, F., May, M., and Welch, B., Phys. Plasmas, 2, 2308 (1995), http://dx.
doi.org/10.1063/1.871254.
Gu, Z., W. Wei, and Y. Zhao, An overview of surface conditions in numerical simulation of dust devils and the consequent near–surface air flow fields, J. Atmospheric Sci., 63, 1630 (2006).
Horton, W., Turbulent Transport in Magnetized Plasmas, Chps. 13 & 17, pp. 308–335 & 443–446 (2012), ISBN:978-981-4383-53-0.
Houser, P., et al., J. Geophys. Res. (2003).
Ireland, P. M., Triboelectrification of particulate flows on surfaces: Part I – Experiments,
Technology, 198, 2, 189–198 (2010), http://dx.doi.org/10.1016/j.powtec.2009.
11.017.
Ireland, P. M., Triboelectrification of particulate flows on surfaces: Part II – Mechanisms and models, Powder Technology, 198, 2, 199–210, (2010), http://dx.doi.org/10.
1016/j.powtec.2009.11.008.
Ireland, P. M., and G. J. Jameson, Particle dynamics in cyclone tribochargers, J. Elec-trostatics, 71, 449–455 (2013).
(Tokyo, Japan, 2013).
Kahn, R. A., B. J. Gaitley, J. V. Martonchik, D. J. Diner, K. A. Crean, and B. Holben, Multiangle Imaging Spectroradiometer (MISR) global aerosol optical depth validation based on two years of coincident Aerosol Robotic Network (AERONET) observations,
J. Geophys. Res.: Atmospheres (1984–2012), 110, D10 (2005).
Kida, S. and H. Miura, Identification and analysis of vortical structures, Eur. J. Mech. B/Fluids, 17, 471-488 (1998).
Kok, J. F. and N. O. Renno, Enhancement of the emission of mineral dust aerosols by electric forces, Geophys. Rev. Lett., 33, 19 (2006), http://dx.doi.org/10.1029/
2006GL026284.
Lacks, D. J., and A. Levandowsky, Effect of particle size distribution on the polarity of triboelectric charging in granular insulator systems, J. Electrostatics, 65, 107–112 (2007),http://dx.doi.org/10:1016/j.elsat.2006.07.010.
Li, X., Huw Morgan, Drew Leonard, et al., Astrophys. J. Lett., 752, 2 (2012).
Miller, R. L., R. V. Cakmur, J. Perlwitz, V. Geogdzhayev, P. Ginoux, D. Koch, K. E. Kohfeld, C. Prigent. Mineral dust aerosols in the NASA Goddard Institute for Space Sciences Model E atmospheric general circulation Model E, J. Geophys. Res., 111, D06208 (2006), http://dx.doi.org/10.1029/2005JD005796.
Mishchenko, M. I., et al., Modeling phase functions for dust–like tropospheric aerosols using a shape mixture of randomly oriented poly–disperse spheroids, J. Geophys. Res., 102, 16,831–16,847 (1997).
Miura, H. and N. Nakajima, Nucl. Fusion, 50, 054006 (2010), http://dx.doi.org/10.
Miura, H., Excitations of vortex waves in weakly compressible isotropic turbulence, J. Turbulence, 5, 010 (2004).
Miura, H., Analysis of vortex structures in compressible isotropic turbulence,Comp. Phys. Commun., 147, 552–555 (2002) .
Miura, H. and S. Kida, Vorticity generation by shock-vorticity interaction, J. Phys. Soc. Jpn., 63, 4000–4010, (1994), http://dx.doi.org/10.1143/JPSJ.63.4000.
Oke, A. M. C., Tapper, N. J., Dunkerley, D. Willy-willies in the Australian landscape: The role of key meteorological variables and surface conditions in defining frequency and spatial characteristics,J. Arid Environ., 71, 201-215 (2007).
Onishchenko, O. G., Pokhotelov, O., Horton, W., Smolyakov, A., Kaladze, T., and Fedun, V., Rolls of the internal gravity waves in the Earth’s atmosphere, Ann. Geophys., 32, 181-186 (2014), http://dx.doi.org/10.5194/angeo-32-181-2014.
Renno, N. O., M. L. Burkett, and M. P. Larkin, A simple thermodynamical theory for dust devils, J. Atmos. Sci., 55, 3244–3252 (1998), http://dx.doi.org/10.1175/
1520--0469(1998)055<3244:ASTTFD>2.0.CO;2.
Renno, N. O., V. J. Abreu, J. Koch, P. H. Smith, O. K. Hartogensis, H. A. R. De Bruin, D. Burose, G. T. Delory, W. M. Farrell, C. J. Watts, J. Garatuza, M. Parker, and A. Carswsell, MATADOR 2002: A pilot field experiment on convective plumes and dust devils, J. Geophys. Res., 109, 2156-2202 (2004), http://dx.doi.org/10.1029/
2003JE002219.
Schmidt, D. S., R. A. Schmidt, and J. D. Dent, Electrostatic Force on Saltating Sand, 103, D8, 8997–9001 (1998), http://dx.doi.org/10.1029/98JD00278.
Twomey, S., Pollution and planetary albedo, Atmos. Environ., 8, 1251–1256 (1974). Wedemeyer–B¨ohm, S., E. Scullion, O. Steiner, et al., Nature, 486, 505 (2012).
Wedemeyer–B¨ohm, S., and L. Rouppe van der Voort, Small–scale swirl events in the quiet Sun chromosphere, Astron. Astrophys., 507, L9–L12 (2009).
Zhang, H., X-J. Zheng, and T. Bo, Electrification of saltating particles in wind-blown sand: Experiment and theory, J. Geophys. Res., 118, 21, 12,086–12,093 (2003), http:
0
5
10
15
20
25
30
-6
-4
-2
0
2
4
6
z
x
0
5
10
15
20
25
30
-6
-4
-2
0
2
4
6
z
[image:41.612.61.514.82.721.2]x
-3
-2
-1
0
1
2
3
-3
-2
-1
0
1
2
3
y
x
-3
-2
-1
0
1
2
3
-3
-2
-1
0
1
2
3
y
[image:42.612.64.524.86.621.2]x
-3
-2
-1
0
1
2
3
-3
-2
-1
0
1
2
3
y
x
-3
-2
-1
0
1
2
3
-3
-2
-1
0
1
2
3
y
[image:43.612.64.508.89.560.2]x
Figure 6. Time evolution of the poloidal and toroidal components of the vorticity squared,
⟨ω2
-3
-2
-1
0
1
2
3
-3
-2
-1
0
1
2
3
y
x
-3
-2
-1
0
1
2
3
-3
-2
-1
0
1
2
3
y
[image:44.612.66.523.57.499.2]x
0
2
4
6
8
10
12
14
-3
-2
-1
0
1
2
3
z
x
0
2
4
6
8
10
12
14
-3
-2
-1
0
1
2
3
z
[image:45.612.62.510.79.746.2]x
Table 1. Properties of quartz and sand dust particles
Dust particle radius 1µm 100µm Quartz sand mass density
ρm= 3 g/cm3 Capacitance
Cd= 4πϵ0rd
Cd= 10−16F Cd= 10−14F
Charge on grain for poten-tial of 10 V and number
Neof electrons
Qd= 10−
15
C→
Ne= 10
4 Q
d= 10−
12
C →
Ne= 10
6
Mass of grains and num-ber of SiO2 molecules
in grain
Md= 3×10⁻¹²g
NSiO2=Md/6
amu = 5×10¹⁰
Md= 3×10⁻⁶g
NSiO2=Md/60
amu = 5×10¹⁶ MassMa= of air
molecules
[70%N2+ 30%] O2
Ma= 4.2×10−
23
Ma= 4.2
×10−23g
Charge in volume Hd = 10 m by Rd = 10 m vol-ume Vd = 103m3 of dust for densitynd= 10
6
/cm3
Q= 10−15C/
grain×1011 grains = 1.1 × 10⁻⁴C
Dust density for 1011
grains in volume = 103m3
is 1.6 × 10⁸ grains/m3
= 160 grains per cc Potential drop to ground
fromHd= 100 m
V = 9×10⁹Q/
Hd= 9 kV
V = 900 kV Electric field from ground
to center of the charge cloud
E = V /hd =
1 kV/m
Table 2. Parameter of the proposed experiments
Cylinder height 1.5-2.0 m
Cylinder diameter 0.75-1 m
lower electrode metal
top electrode conductive glass
lower electrode temperature range 300-400 K upper electrode temperature 300 K
Electrode bias 0-1 kV
Particle size 10-1000 µm
Diagnostics laser sheet and high
![Figure 1.Top figure (a) is a schematic diagram of the vertical flow with two stagnation pointsgiven by Balme and Greeley [2006] who based the diagram on observations that sometimes show](https://thumb-us.123doks.com/thumbv2/123dok_us/7848654.177880/38.612.62.505.87.514/figure-gure-schematic-vertical-stagnation-pointsgiven-greeley-observations.webp)