An electrochemical impedance spectroscopy based nitrate sensor for practical application : a project report submitted in partial fulfillment of the requirements for the degree of Master of Engineering in Electrical and Electronics Engineering, School of E
110
0
0
Full text
(2) An Electrochemical Impedance Spectroscopy Based Nitrate Sensor for Practical Application A Project Report Submitted in Partial Fulfillment of the Requirements For the Degree of. Master of Engineering In. Electrical and Electronics Engineering By. Li Xie. School of Engineering and Advanced Technology Massey University Palmerston North New Zealand April 2016.
(3) Abstract Water contamination not only affects human health, but can also damage the ecological system and the natural environment. Agriculture is the backbone of New Zealand’s economy, however the sector has been identified as a primary source of nitrate contamination in many waterways. Therefore, monitoring of water quality in agricultural areas is paramount. The contemporary measurement methodologies applied for contaminant quantification are expensive, laboratory-based and timeconsuming so the development of a low-cost, convenient sensing system is required. An electrochemical impedance spectroscopy based nitrate sensing system has been developed for nitrate detection. The system is designed to measure the nitrate concentration in water is stand-alone, robust, real-time and low-cost. The microcontroller in the designed system was used to generate the excitation signal applied to the sensor; for data processing and controlling time interval for the switch on/off the automatic sample-intake pump. The data in the microcontroller is transmitted to a computer for data storage and calculation via wireless communication. As the sensor geometry used in the project is the interdigital type which is very sensitive to the temperature, therefore, the sensor was initially tested in the deionized water at variable temperatures. From the result of testing in various temperature ranges, the temperature correction factor was obtained for nitrate measurement. The calibration samples were prepared by the serial dilution of a nitrate stock solution using sodium nitrate (NaNO3) and ammonium nitrate (NH4NO3) with different concentrations. The sensor was immersed in the solution to observe the impedance change at various nitrate concentrations. The experimental result showed a good linear relationship between the concentration and real part of the measured impedance and the computational model for nitrate concentration was predicted based on the experimental results achieved. The sensor was also tested in the water samples collected from different local agricultural streams, and the results were validated with the applied laboratory testing results using contemporary techniques. The experimental results showed that the sensing system is more sensitive to the lower nitrate concentrations in the surface water. The system was prototyped and applied in the field. The real-time low-cost testing system displayed its potential for the in-situ continuous nitrate monitoring in the paddocks. i.
(4) Acknowledgements I would like to express my immense gratitude to my supervisor Prof. Subhas Chandra Mukhopadhyay for his great support, encouragement and help. He kept motivating me by giving me patient guidelines, advice and pointing me in the right direction throughout the work. I would like to express my appreciation to my co-supervisor Dr. Lucy Burkitt for her patient guidance and advice on agricultural nitrate contamination of waterways. I also would like to express my gratitude to Dr. Asif Zia for guiding me throughout the project. I would also thank Mr. Anindya Nag, Ms. Narsin Afsarimanesh, Mr. M. Eshrat Ealahi and Mr. Weizhong Shi for their active collaborations in the project. Thanks to Massey staff members Ms. Glenys Wallace, Mr. Ian Furkert, Mrs. AnnMarie Jackson, Mr. John Edwards, Mr. Anthony Wade, Mr. Morio Fukuoka, Mr. Ken Mercer and Mr. Collin Plaw for their technical assistance and support during my work. I also would like to thank the School of Engineering and Advanced Technology, Massey University who provided me with funds and the opportunity to pursue my Masters’ degree. I want to pay special gratitude to my beloved parents and husband for their unconditional love and support. To my lovely and wonderful daughters Stephanie and Jamie, thanks for your patience and understandings throughout the year.. ii.
(5) Table of Contents Abstract ......................................................................................................................... i Acknowledgements ...................................................................................................... ii Chapter 1: Introduction ................................................................................................ 1 1.1 Background of Project ........................................................................................ 1 1.2 Current Measurement Status .............................................................................. 3 1.2.1 Water Samples Collection ........................................................................... 4 1.2.2 Measurement System ................................................................................... 5 1.3 Aims and Objectives .......................................................................................... 6 1.4 Organization of the Thesis ................................................................................. 7 Chapter 2: Literature Review ....................................................................................... 9 2.1 Electrochemical Impedance Spectroscopy ......................................................... 9 2.2 Fiber Optic Sensor ............................................................................................ 10 2.3 Electrochemical Biosensor ............................................................................... 12 2.4 Microwave Sensors .......................................................................................... 13 2.5 Novel Interdigital Sensors ................................................................................ 14 2.6 Novel Electromagnetic Sensor ......................................................................... 17 2.7 Nitrate Detection Methods ............................................................................... 19 2.7.1 Electrochemical detection .......................................................................... 19 2.7.2 Ion Chromatography .................................................................................. 21 2.7.3 Flow Injection Analysis methods .............................................................. 22 2.8 Market Survey .................................................................................................. 23 Chapter 3: Design and Development of Nitrate Sensing System .............................. 27 3.1 Introduction ...................................................................................................... 27 3.2 System Overview ............................................................................................. 27 3.3 Interfacing to Microcontroller .......................................................................... 28 3.4 Power Supply Circuits ...................................................................................... 31 3.5 Generation of Excitation Supply of the Sensor ................................................ 33 3.6 Measurement of the Sensing Voltage ............................................................... 40 iii.
(6) 3.7 Measurement of the Sensor Impedance ............................................................ 47 3.8 Control of Water Pump .................................................................................... 49 3.9 Temperature Measurement ............................................................................... 50 3.10 Data Collection and Monitoring ..................................................................... 51 3.10.1 Serial Communication ............................................................................. 52 3.10.2 Wireless Communication ......................................................................... 53 3.10.3 Graphic User Interface ............................................................................. 57 3.11 Conclusion ...................................................................................................... 60 Chapter 4: Experiments, Results and Discussion....................................................... 61 4.1 Introduction ...................................................................................................... 61 4.2 Description of the Selected Sensor ................................................................... 61 4.3 Temperature Measurement ............................................................................... 62 4.3.1 Experimental Setup .................................................................................... 62 4.3.2 Results and Discussions ............................................................................. 64 4.4 Humidity Experiment and Results ................................................................... 69 4.5 Experimental Results with Water ..................................................................... 73 4.5.1 Preparation of Solution .............................................................................. 73 4.5.2 Results from LCR Measurement ............................................................... 75 4.5.3 Water Solution Tested by Designed Sensing System ................................ 77 4.6 Real Water Source Sample Testing .................................................................. 82 4.7 Experimental Test of Complete System ........................................................... 84 4.8 Conclusion ........................................................................................................ 86 Chapter 5: Conclusions and Future Works ................................................................ 88 5.1 Conclusions ...................................................................................................... 88 5.2 Future Works .................................................................................................... 91 References .................................................................................................................. 93. iv.
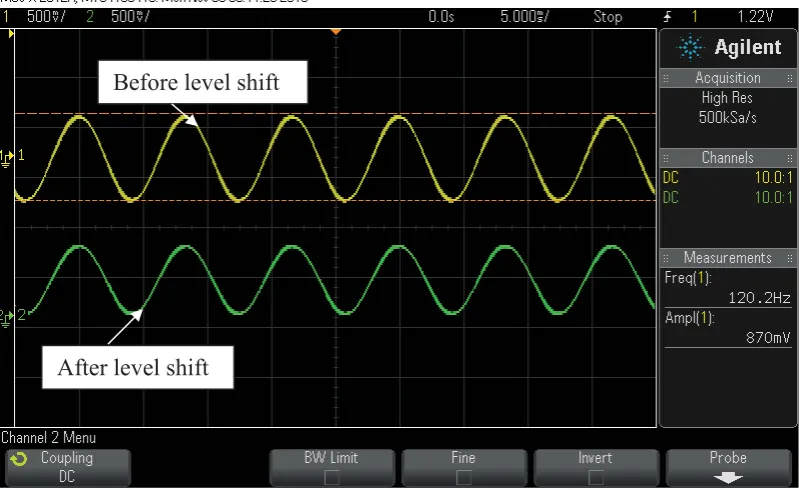
(7) Table of Figures Figure 1.1.1: Median nitrate concentrations measured in groundwater (1995-2008) [7] ...................................................................................................................................... 2 Figure 1.1.2: Summary of 10-year river condition trends reported in 2013 [8]........... 2 Figure 1.2.1: Water Sample Collection ........................................................................ 4 Figure 1.2.2: Technicon AutoAnalyzer currently used in the laboratory .................... 6 Figure 2.1.1: Randle’s equivalent circuit ................................................................... 10 Figure 2.5.1: Geometric structure of interdigital sensor ............................................ 14 Figure 2.5.2: Electric field for different pitch length [49] ......................................... 15 Figure 2.5.3: Geometry of excitation pattern for multi-sensing electrode ................. 15 Figure 2.5.4: Sensor configuration (1-5-50) .............................................................. 16 Figure 2.6.1: Schematic diagram of sensor connected in parallel [63] ...................... 17 Figure 2.6 2: Schematic diagram of sensor connected in series [63] ......................... 18 Figure 2.7.2.1: Schematic diagram of Ion Chromatography Method [83]................. 21 Figure 2.7.3.1: Technicon Auto-Analyzer working diagram [87] ............................. 22 Figure 3.2.1: Functional Block Diagram of the Sensing System ............................... 27 Figure 3.3.1: Arduino Fio Board ................................................................................ 28 Figure 3.3.2: The interfacing of the sensor to the microcontroller ............................ 30 Figure 3.3.3: Picture of the system prototype based on the microcontroller ............. 30 Figure 3.3.4: Serial Communication by Arduino Fio with XBee .............................. 31 Figure 3.4.1: Circuit for 3.3V voltage regulator application...................................... 32 Figure 3.4.2: Use of 555 to generate negative voltage ............................................... 33 Figure 3.5.1: Arrays for the hexadecimal of sinusoidal waveform ............................ 34 Figure 3.5.2: Timer 1 ISR code .................................................................................. 36 Figure 3.5.3: PWM output ......................................................................................... 37 Figure 3.5.4: Bandpass filter for generating smooth sinusoidal waveform ............... 38 Figure 3.5.5: Smooth sinusoidal waveform generated by combined PWM output and band pass filter ........................................................................................................... 38 Figure 3.5.6: Pseudo-linearity between current and voltage [24] .............................. 39 Figure 3.5.7: Circuit for generated input signal fed into sensor................................. 39 Figure 3.5.8: Input (excitation) signal applied to sensor after voltage divider .......... 40 Figure 3.6.1: Circuit for level shifting ....................................................................... 41 Figure 3.6.2: Excitation signal after shifting up ......................................................... 41 Figure 3.6.3: Circuit for processing the sensing voltage ............................................ 42 Figure 3.6.4: Distorted sensing voltage output .......................................................... 43 Figure 3.6.5: Sensing voltage (Vsensor) after filtering and amplifying ........................ 43 Figure 3.6.6: Precision rectifier circuit ...................................................................... 44 v.
(8) Figure 3.6.7: Output signal of half wave rectifier from Vpos ..................................... 45 Figure 3.6.8: Output signal of full wave rectifier from Vinmicro.................................. 45 Figure 3.6.9: Microcontroller code for ADC data collection ..................................... 46 Figure 3.6.10: Microcontroller code for calculating the amplitude of voltage .......... 46 Figure 3.7.1: Zero cross detector circuit .................................................................... 47 Figure 3.7.2: Outputs of zero cross detectors ............................................................. 48 Figure 3.7.3: Microcontroller code for capturing signals .......................................... 49 Figure 3.8.1: Control circuit for pump and solenoid valve ........................................ 49 Figure 3.8.2: Microcontroller code for controlling time interval of pump and valve 50 Figure 3.9.1: TMP36 connection ............................................................................... 50 Figure 3.10: Functional block diagram for data collect ............................................. 52 Figure 3.10.1.1: Serial communication frame formats .............................................. 52 Figure 3.10.2.1: XBees used in the experimental system .......................................... 54 Figure 3.10.2.2: Configuration of ZigBee coordinator .............................................. 55 Figure 3.10.2.3: Transmit data from microcontroller to ZigBee node ....................... 56 Figure 3.10.2.4: Data received in X-CTU terminal ................................................... 56 Figure 3.10.2.5: Description of received data ............................................................ 57 Figure 3.10.3.1: Steps for receiving sensor data ........................................................ 57 Figure 3.10.3.2: GUI Design by C# ........................................................................... 58 Figure 3.10.3.3: Method for converting bytes to hexadecimal value......................... 59 Figure 3.10.3.4: Code for converting hexadecimal value to decimal value ............... 59 Figure 3.10.3.5: C# code for storing data in txt file ................................................... 60 Figure 4.2.1: Uncoated sensor employed in the project ............................................. 62 Figure 4.3.1.1: Lab setup for sensor response at different temperature ..................... 63 Figure 4.3.2.1: Nyquist plot for testing MilliQ at various temperatures .................... 65 Figure 4.3.2.2: Real part of impedance vs. frequency in varying temperature .......... 65 Figure 4.3.2.3: Imaginary part of impedance vs. frequency in various temperature . 66 Figure 4.3.2.4: Relationship between the temperature and resistance part of impedance .................................................................................................................. 67 Figure 4.3.2.5: Comparison between the actual temperature and measured temperature................................................................................................................. 68 Figure 4.4.1: Experiment setup for temperature and humidity measurement ............ 69 Figure 4.4.2: Nyquist plot for testing varying humidity at 25oC ............................... 70 Figure 4.4.3: Resistance part of impedance vs. frequency in varying humidity at 25oC .................................................................................................................................... 70 Figure 4.4.4: Resistance of impedance against humidity at 25oC .............................. 71 Figure 4.4.5: Nyquist plot for testing varying humidity at 35oC ............................... 71. vi.
(9) Figure 4.4.6: Resistance part of impedance vs frequency in varying humidity at 35oC .................................................................................................................................... 72 Figure 4.4.7: Resistance of impedance against humidity at 25oC .............................. 72 Figure 4.5.1: Serial dilution procedure [120] ............................................................. 73 Figure 4.5.2.1: Nyquist plot for NH4NO3 at different concentration ......................... 76 Figure 4.5.2.2: Real part of Impedance vs. Frequency at different concentrations (NH4NO3) ................................................................................................................... 76 Figure 4.5.2.3: Imaginary part of Impedance vs. Frequency at different concentrations (NH4NO3)........................................................................................... 77 Figure 4.5.3.1: Experimental setup for water solution test by the designed system .. 78 Figure 4.5.3.2: Real part of imaginary comparison between system and LCR at low concentration (NH4NO3) ............................................................................................ 79 Figure 4.5.3.3: Imaginary part of imaginary comparison between system and LCR at high concentration (NH4NO3) .................................................................................... 79 Figure 4.5.3.4: Real part of imaginary comparison between system and LCR at low concentration (NaNO3)............................................................................................... 80 Figure 4.5.3.5: Imaginary part of imaginary comparison between system and LCR at high concentration (NaNO3) ...................................................................................... 80 Figure 4.5.3.6: Real part of imaginary comparison between system and LCR at concentration (NH4NO3) ............................................................................................ 82 Figure 4.6.1: Comparison between laboratory method and designed system for nitration measurement ................................................................................................ 84 Figure 4.7.1: Experimental setup for system testing .................................................. 85 Figure 4.7.2: GUI for real-time monitoring ............................................................... 86. vii.
(10) Lists of Tables Table 2.7 1: Electrochemical detection summary ...................................................... 20 Table 2.8.1: Summary of Commercial Nitrate Detection Products ........................... 26 Table 3.3.1: Summary of ATmega328P .................................................................... 29 Table 3.5.1: Advantages and disadvantages of different DAC methods ................... 34 Table 3.10.2.1: Feature of ZigBee Protocol ............................................................... 53 Table 4.3.1.1: Specification of Hioki 3522-50 LCR meter ........................................ 64 Table 4.3.2.1: Temperature Measurement ................................................................. 66 Table 4.5.1.1: Solution Concentration test result from laboratory and dilution factor .................................................................................................................................... 75 Table 4.6.1: The compared results between the designed system and laboratory measurement (Stream samples are represented by numbers followed by S and surface runoff samples are identified by their sample name) ................................................. 83. viii.
(11) Research Output Conference Proceedings 1. L. Xie, Zia A., Mukhopadhyay S.C, Burkitt L, “Electrochemical Impedimetric Sensing of Nitrate Contamination in Water”, Proceedings of the 9th International Conference on Sensing Technology, December 8-10, 2015, Auckland, New Zealand, pp. 257-262. 2. Zia A., Afsarimanesh N., L. Xie, Nag A., Al-Bahadly I.H, P.L. Yu, “ Improved Detection Limits for Phthalates by Selective Solid-phase Microextraction”, Proceedings of the 9th International Conference on Sensing Technology, December 8-10, 2015, Auckland, New Zealand, pp. 733-738 3. L. Xie, Zia A., Alahi M.E.E, Mukhopadhyay S.C, Burkitt L, “Practical Nitrate Sensor Based on Electrochemical Impedance Measurement”, Proceedings of 2016 IEEE International Instrumentation and Measurement Technology Conference, May 23-26, 2016, Taipei, Taiwan. Journal Publications: 1. S. Mukhopadhyay, A. Nag, A. Zia, X. Li, and J. Kosel, "Novel sensing approach for LPG leakage detection: Part I: Operating Mechanism and Preliminary Results", IEEE Sensor Journal. (Accepted). 2. S. Mukhopadhyay, A. Nag, A. Zia, X. Li, and J. Kosel, "Novel sensing approach for LPG leakage detection: Part II: Effects of particle size, composition and coating layer thickness", IEEE Sensor Journal. (Accepted). Conference Attendance: Venue: ICST 2015, Auckland, New Zealand Date: December 8-10, 2015 Conference Presentation Title: Electrochemical Impedimetric Sensing of Nitrate Contamination in Water Date: 9th December, 2015 Venue: ICST 2015, Auckland, New Zealand. ix.
(12) Chapter 1: Introduction 1.1 Background of Project In our planet, the water resource makes up 97% from the ocean and 3% from freshwater. Most of the freshwater (around 69%) is stored in the icecaps and glaciers, and there is only about 30% of total freshwater (around 1% of total water source) [1] found in the groundwater and surface water. Most freshwater comes from rainfall and snow which are dissolved from the atmosphere and flow into the sea or is absorbed by land or evaporates back in to the atmosphere. Moreover, freshwater extracted from rivers, lakes and ground are used for agriculture (70%), industrial processes (22%) and domestic use (8%) [2]. Freshwater is an essential natural resource which is necessary for all living organisms because it supplies drinking water and provides food and habitat. Freshwater also supports human recreational activities such as swimming, fishing and boating. Therefore, clean water is a key issue not only for human and animal health, but also the health of aquatic organisms. The degree of urbanization has grown exponentially in the last few decades. This has resulted in a rapid increase of contamination in the waterways. One of the most important of these contaminants is the nitrate salt. Nitrate-nitrogen (NO3-N) is the one of an essential element for the growth of all plants and animals in water as it is an important component for the supply of protein [3, 4]. It is also used in the agricultural sector to increase plant and therefore animal production. However, nitrate can become a contaminant if the concentration in the water rises above a certain threshold concentration, a common problem in surface and groundwater draining the agricultural areas all over the world [5, 6]. In New Zealand, the NO3-N concentrations in groundwater are commonly higher than the threshold concentration in the agricultural areas, with figure 1.1.1 showing median concentrations around the country from 1995 to 2008 [7]. Figure 1.1.1 indicates that 80% of monitoring sites had were classified as ‘good’ condition with nitrate concentrations of less than 5.65 mg/L and around 5% of sites had nitrate concentrations that exceed the limit of drinking water (11.3 mg/L). In agricultural regions such as Canterbury, Manawatu, Taranaki and Waikato, nitrate concentrations above 5.65 mg/L, were more common. 1.
(13) Figure 1.1.1: Median nitrate concentrations measured in groundwater (1995-2008) [7]. Figure 1.1.2 illustrates the trend in rivers condition, based on the monitoring sites in New Zealand. The nitrate concentration did not change over the 10 year analysis period at most of sites. Whereas, the nitrate concentration improved in 21% of the monitoring sites but 26% of sites got worse [8].. Figure 1.1.2: Summary of 10-year river condition trends reported in 2013 [8]. 2.
(14) Agricultural activities are the major sources of nitrate [9] in the waterways. The urine of agricultural livestock is the main source of nitrate contamination [10] and nitrates in the form of urine are excreted by many domestic animals. For example, cows are really inefficient users of nitrogen therefore excrete a large proportion (>70%) of nitrogen that they consume, in their urine [11]. This results in concentrated patches of nitrate, which are prone to leaching into the groundwater and subsequently surface water. The application of nitrogen-rich fertilizer to grass and crops can also increase nitrate contamination of waterways [10, 12, 13]. Another source of nitrate contamination is from the disposal of human and animal sewage and industrial wastes either to the land or via direct release in to waterways. Elevated NO3-N concentration in surface waters can stimulate the growth of unwanted algae and aquatic plants leading to water pollution. The purity of water in these bodies can be degraded to the point of it being unsuitable for drinking or any domestic use, even after following a standardized purification procedure. When the nitrate is reduced to nitrite in the nitrogen cycle, it will cause methemoglobinemia due to failure to transfer oxygen to the tissues [14]. If nitrate concentration exceeds 11.3 mg/L in drinking water, it can have devastating effects on infant health [15] because they are more vulnerable to methemoglobinemia than the others. In addition, the rumen microbes in ruminants such as cattle and sheep can reduce the nitrate into the toxic nitrite form [16] and these livestock may have the same signs of nitrate poisoning such as blue membranes, lack of coordination and vomiting.. 1.2 Current Measurement Status Currently, water quality is routinely monitored by the regional councils around New Zealand. However, this is done by a manual collection of water samples from the field. For example, water samples collected from Massey University’s Agricultural Experimental Station at Tuapaka, near Palmerston North are collected on a fortnightly basis and NO3-N concentrations measured using the colorimeter method by Technicon Auto-Analyzer, in a laboratory.. 3.
(15) 1.2.1 Water Samples Collection Tuapaka farm with a total area of 420 hectares is a hill country sheep and beef farm used for teaching and research. Parts of the farm are steep and difficult to access, particularly during winter, making water collection difficult and time consuming.. (a) Paddock down the hill. (b) Collect station up the hill. (c) Solar panel for power supply. Figure 1.2.1: Water Sample Collection. In figure 1.2.1 (a), there is a V-shape white board which was built to monitor stream flow which combined with nitrate concentration, allows the calculation of nitrate load (kg/ha) being lost in the waterway. One of the collection points as shown in figure 1.2.1 (b) and (c), the water comes from the uphill and flow into these box through the pipes. There is a counter outside each box used for calculating the flow rate of the stream for different weather condition (rainy or dry days give the different volume of water samples). The solar panel is used to supply power for the counter. 4.
(16) The water samples collected from the field may contain some soils, insects and so on. The unfiltered water may contain particles that may be conductive and dielectric in nature which could affect the impedance measurement. Particles size greater than 25 microns if enter the measurement system could cause the system to malfunction by short-circuiting the excitation and sensing electrodes on the sensor surface.. In. addition, the soil in the unfiltered water could create a mud layer on the sensing surface which can cause errors in the measurement values. Therefore, the water samples need to be filtered with a 0.22 micron filter before the water sample enters the measurement system. 1.2.2 Current Laboratory Measurement System Technicon Auto-Analyzer uses continuous flow system (CFS), where samples are taken automatically from the sample tray and the appropriate reagents are added via a pump. Samples are passed through a manifold for mixing, filtering and heating. The colorimeter then measures the absorbance of color in the reaction of the sample and is displayed on the recorder [17]. Figure 1.2.2 shows the Technicon Auto Analyzer used to determine both of nitrate and ammonium concentration in the laboratory by the current method. The Autoanalyzer is set up with heating bath at 28-29oC and uses 520 nm filters in the colorimeter. A red azo dye and an indo-phenol prussian blue dye is used to measure nitrate and ammonium respectively. Reagents used for NO3-N detection include a catalyst solution, sodium hydroxide solution, hydrazinium sulphate solution and so on (as shown in figure 1.2.2 (b)). Reagents are pumped into the system for about 30 minutes to ensure the system is flushed completely. In the sample tray (Figure 1.2.2 (a)), the prepared nitrate standard and water samples are put in the sample tray. The probe will take each sample in the preset time interval into the system. The samples and reagents are mixed together in the system (Figure 1.2.2 (c)) and the measurement is done by a colorimeter (Figure 1.2.2 (d)). This recorder baseline should be set along with the colorimeter baseline control before the measurement starts by standard calibration.. 5.
(17) Samples. Probe. (a) Sample Tray. (b) Chemical Reagents. (c) Detection part (colorimeter). (d) Measured result. Figure 1.2.2: Technicon AutoAnalyzer currently used in the laboratory. This method requires expensive equipment and trained staff to conduct measurements in addition to the limitation on water sample collection, which can only be collected periodically. This approach risks missing key changes in NO3-N concentration when river-flow rapidly rises or falls. Although high-frequency nitrate sample equipment is available, these cost in the order of $30-70,000.. 1.3 Aims and Objectives Through the importance of nitrate detection and the limitations of the current measurement options, the motivation of this project is to develop a sensing system which can be portable, suitable for in-situ measurement with a low cost for nitrate 6.
(18) detection in water and accurate. Considering the disadvantages of the current methodologies for detecting nitrate, this project aims to develop a sensing system based on the electrochemical impedance spectroscopy method using an interdigital sensor which can be installed in the field for continuous real-time monitoring. Objectives of the project are to: ¾ investigate the characterization of the impedance of the sensor in variable temperature and humidity condition ¾ characterize the impedance of the sensor to detect nitrate concentration ¾ develop a low-cost and in-situ sensing system ¾ evaluate the developed system with the commercially available system ¾ implement the real-time monitoring of nitrate contamination in water. 1.4 Organization of the Thesis This thesis has been organized into five chapters. The introduction of the project is described in Chapter 1, which describes the issue of nitrate contamination in New Zealand waterways, the source and effect of nitrate contamination in natural water resources, the current measurement procedures and methodology and the objectives of this project. In Chapter 2, market research on the commercially available nitrate sensor is undertaken. The literature review of methods and sensors used for nitrate detection are also reported in Chapter 2. The detailed design of the nitrate sensing system has been described in Chapter 3. It includes the system overview, interfacing to the microcontroller, generation of input excitation signal applied to the sensor, measurement of the impedance and phase difference, design for the pump and valve control and the implementation of ZigBee-based data transmission from the microcontroller to the computer via wireless communication and graphic user interface. The experimental results are discussed in Chapter 4. As the interdigital sensor is sensitive to the temperature and humidity in the measurement environment, an experiment with variable temperature and humidity was undertaken and used to characterize the impedance of the sensor in different temperature, humidity conditions. Both of uncoated sensor and Parylene coated sensor were tested in the water solution to investigate the sensor impedance in variable nitrate concentrations 7.
(19) by the designed system and LCR meter. Water samples collected from different groundwater sources were also measured by the designed system, and the results were evaluated with the colorimetric method conducted in the laboratory. Finally, options for the future refinement of the system are discussed and conclusions are drawn in Chapter 5.. 8.
(20) Chapter 2: Literature Review 2.1 Electrochemical Impedance Spectroscopy Electrochemical Impedance Spectroscopy (EIS) is a method to determine the current response of an electrochemical cell by applying a small sinusoidal signal. EIS method is widely used in various applications such as detection of bacterial endotoxin in food [18], determination of the corrosive behavior of materials [19, 20], analysis of electrical properties for controlling soymilk coagulation process [21], evaluation of impedance response to the Phthalate concentration [22] and other biosensing applications [23]. In EIS method, a periodic sinusoidal voltage is applied to the sensor, so there is a phase shift between the applied voltage and current flow through the sensor. Therefore, the total impedance can be divided into the real part and the imaginary part. Cole-Cole plot and Bode plot are two most important presentation methods to show the relationship between specific parameters. Cole-Cole plot is also known as Nyquist plot which represents the relationship between the real part of impedance (Rs) and imaginary part of impedance (X) in a particular frequency range. One disadvantage of Nyquist plot is that the frequency is not shown in the plot, so it is hard to understand visually which frequency value was used to record the points. In contrast, the frequency is plotted in the X-axes, and absolute impedance |Z| and phase angle Ɵ is plotted on the Y-axes in the Bode plot. It can clearly show the frequencydependent behavior of the electrochemical cell. The Randles equivalent circuit is the mostly used to express EIS evaluation in electrical model form. Randles equivalent circuit consists of series resistance Re, the parallel combination of double layer capacitance Cdl and charge transfer impedance Zw and charge transfer resistance Rt [24] as shown in figure 2.1.1. The Nyquist plot for Randles circuit without Zw is semi circle but there is diffusion on the semi-circle when Zw is added. This happens when the electrode is covered with other coatings, so the electrochemical reaction is influenced.. 9.
(21) Figure 2.1.1: Randles equivalent circuit. Where: x. Re: Series resistance. x. Cdl: Double layer capacitance. x. Rt: Charge transfer resistance. x. Zw: Charge transfer impedance. 2.2 Fiber Optic Sensor Fiber optic sensor [25] was developed quickly in the last three decades. It consists of three main elements: a light source to generate the light, optical fibers to pass through the light and a photodetector system to detect the optical signal. Fiber optic sensor can be divided into intrinsic and extrinsic sensors based on the use of fiber. The intrinsic sensor normally uses the phase-modulation techniques which require consistent light sources and only single mode fibers and the modulation happens using the fiber itself. In contrast, the fiber is used as a channel for transmitting in the extrinsic fiber optic sensor which is low cost and allows multimode fibers and inconsistent light sources. The extrinsic fiber optic sensor is widely used in remote sensing due to its small size, no requirement of electrical power, high-temperature operation and long working lifetime. The optical sensor is also extensively used to detect the nitrate and nitrite [26] because it has some advantages such as high selectivity and sensitivity, low cost and simple. The optical sensor based on the Lauth’s violet-triacetyl cellulose membrane film. was. developed. to. detect. nitration 10. concentration. using. absorption.
(22) spectrophotometry, and it could detect the nitrate concentration from 10.12 to 1012 ng/ml. Modified fiber optic sensor using fluorescing emission of suitable dyes was developed to detect the nitrate [27]. An extrinsic fiber optic sensor with Lophine as a sensitive layer to measure was used to detect nitrate in water [28]. It required the spectral wavelength between 300 and 1100 nm and it can detect the nitrate concentration between 1 and 70 mg/L with 20 millisecond response time. An investigation using a broad range of wavelengths between 350 nm and 2500 nm of fiber optic sensors has been carried out to measure the spectral absorption of nitrate ions in water [29]. The ideal wavelength of 575 nm was determined using spectroradiometer. The fiber grating sensor is usually fabricated with multiplexing of single fiber line, and it has high corrosion resistance and stability [25]. In addition, it can be easily embedded in an enormous diversity of material such as fiberglass, metals and thermoplastics. Researchers used fiber Bragg grating sensor to detect the nitrate concentration by analyzing the wavelength shift against the concentration of solution [30], and it achieved the maximum sensitivity at 1.322 x 10⁻³ nm/ppm. Fiber optic sensor is used in many other applications. For example, the fluorescent dye is used as sensing lay to detect the dissolved carbon dioxide (CO2) based on the pH modulation [31]. A pressure sensor fabricated directly on the tip of fiber with a thin silica diaphragm and a measure of 125 μm in diameter at 530/spl degree/C [32]. The fiber-optic temperature sensor based on the optoelectronic oscillator has been reported [33]. The refractive index of the fiber will change with a change in the temperature of the sensing fiber. Therefore, oscillator loop is changed by optical path length. The temperature is evaluated by tracking the peak of the oscillator. The fiber optic surface plasmon resonance is employed in the biology area like monitoring DNA hybridization and melting process using silica nano-bead signal amplification [34], detection of the urea in liquid [35]. Usually, three coating layers are used: silicon layer is used to protect silver layer from oxidation and enzyme layer from deactivation to improve the sensitivity. The resonance wavelength reduces with the increase in the urea concentration. The reported optic sensor can detect the urea concentration in the range of 0 - 160 nM and the sensitivity will decrease as the concentration is increased [35]. 11.
(23) 2.3 Electrochemical Biosensor The combination of biological component and transducer are created to convert biological phenomenon into an electrical signal, called biosensor [36]. The biosensor is consists of bioreceptor which recognizes the analyte and detect mode that can electrochemical, optical and so on. Escherichia coli is used as a whole-cell fluorescence-based biosensor to determine the nitrate concentration in the water without any interference with other electrons [37]. Most of the biosensors for nitrate detection are based on the nitrate reductase [38-40]. Novel enzyme-catalyzed oxygen removal system was developed for application in nitrate biosensor under ambient air. The oxygen removal system includes an oxidase enzyme, an oxidase-specific substrate, and catalase for dismutation [38]. To determine the nitrate on the electrochemical biosensor, the following materials were used: 10 ml mixture of EDTA, D-glucose, MV and MOPS at pH 7.0 in deionized water as a buffer, NaR as biorecognition element and GOx as oxygen reduction catalyst. The system can detect the nitrate concentration in the field condition, but the results were affected by deactivating NaR. Gokhale et al. developed an enzymatic biosensor for nitrate ion detection based on the nanostructured membrane [39]. Immobilized nitrate reductase in a conductive polymer matrix was used to generate an amperometric response. This biosensor strongly depends on the condition of electropolymerization and morphology of PEDOT nanowire arrays. It showed a good response to nitrate with the detecting limit of 0.16 ppm and sensitivity of around 92 μA/mM by applying oxidation potential at 1.1 V and 300 seconds for polymerization time. It also showed a linear relationship between the current density and concentration range of 200 ppb to 1100 ppb. Another research for nitrate detection based on simplified nitrate reductase (SNaR) by potential spectroscopy technique was done by Wang el at. [40]. Using thin-layer potential coulometry followed by spectroscopic technique to detect Griess reaction products. This spectroscopic Griess evaluation showed the high sensitivity of 8000 AU/M and reproducibility at linear range of 1 to 160 μM without using oxygen removal. Even if a high concentration of other common anions is presented, SNaR also displays high selectivity to nitrate. The advantages of using thin-layer include 12.
(24) restriction of a diffusion layer which makes the reduction of nitrate faster and more effective, and only small amount of sample required.. 2.4 Microwave Sensors Microwave sensing is another novel technology which has various applications like humidity detection [41], measurement of water solution concentration [42, 43], realtime monitoring of glucose in the diabetic patient [44], real-time monitoring in water [45, 46] and so on. Microwave sensing is based on the interaction between the material under test and resonating modes using high-frequency range (GHz). It used resonator support various mode but the TM010 was preferred mode because it can provide measurement in the simple, subtle way and the measuring error is reduced [42]. It can evaluate both organic and inorganic water solution and the sensitivity for detect NaCl is 0.4 dB/(mg/ml) within the concentration range of 0 to 1%. On the other hand, an etcheddisc microstrip resonator based on the electromagnetic field distribution was developed to determine the impurities in the water by measuring the dielectric constant of the water. This microstrip resonator showed some benefits like easy fabrication, simple structure, and low cost and so on [43]. In further research, a microwave sensor was developed to monitor the water composition in real-time monitoring [45, 46]. A flexible substrate with interdigitated silver metal pattern was designed as the sensing element, and the sensor could be installed in various places such as water pipe, tube or even curved surface. The sensor was tested under air, deionized and tap water to observe the changing in the resonant frequencies. There are two signals (reflected signal and transmitted signal) used for microwave analysis based on the conductivity and permittivity. It indicated that the narrow band analysis enables the most sensitive to nutrients in wastewater [46]. Therefore, the cylindrical resonant cavity was operated on TM010 mode with a frequency of 2.5 GHz and sample water flow into the cavity through PTFE pipe in the experiment. The system was designed to work at ambient temperature in order to reduce the interference of temperature with permittivity. The experimental results show the peak frequency was increased with the rise in the concentration. 13.
(25) 2.5 Novel Interdigital Sensors Interdigital sensors are finger-like structures on a solid substrate designed for singlesided access to the sample and based on the operation of a parallel plate capacitor. Figure 2.5.1 shows the geometric structure of the interdigital sensor. The planar fabric of the electrodes is formed to perform non-invasive, single-side measurement which offers significant advantages of the interdigital sensor. Other benefits include a simple autonomous operational system, high sensitivity [47] and non-destructive testing.. Figure 2.5.1: Geometric structure of interdigital sensor. When a time-dependent voltage signal is applied to the terminals, an electric field is generated between the electrodes of opposite polarity. The electric field passes through the material under test (MUT) and is modified by it. This electric field was used to evaluate some parameters of MUT such as impedance, chemical material, and density and so on [48]. The distance between two adjacent electrodes is called the pitch length. Figure 2.5.2 illustrates the penetration depth of electric field depends on the pitch length. Different pitch length (l1, l2, l3) gives different corresponding penetration depth. The penetration depth is increased with the rise in the pitch length but the electric field strength generated at adjacent electrodes will get weak as it is inversely proportional to pitch length [49].. 14.
(26) Figure 2.5.2: Electric field for different pitch length [49]. Figure 2.5.3 shows the geometry of excitation pattern for novel multi-sensing electrodes in the interdigital sensor. The electric field generated between excitation and sensing electrodes. Due to different pitch length and the penetration depth, it provides an almost uniform electric field on the sensing surface and thus increases the sensitivity of the interdigital sensor [50].. Figure 2.5.3: Geometry of excitation pattern for multi-sensing electrode. The interdigital sensors are fabricated based on the different configurations. Figure 2.5.4 shows the schematic diagram of the sensor configuration. 1-5-50 refers to the repeated pattern of five sensing electrode with respect to each excitation electrode with a distance of 50 microns between two consecutive electrodes [51].. 15.
(27) Figure 2.5.4: Sensor configuration (1-5-50). Due to the planar structure, some of the electric field-lines bulge out from one terminal to the adjacent terminal of opposite polarity. If any material is kept in close proximity to the sensing surface, the permittivity values of the penetrating electric field changes. This change is studied via different spectroscopic techniques to analyze the properties of the material. The interdigital sensors are used in varieties of applications in environmental monitoring [51-55], the manufacturing process [56], gas sensor [57], photosensitive detection [58], humidity and moisture sensing system [59-62] and so on. One of the applications was to develop an interdigital sensor based on the electrochemical impedance spectroscopy technique to explore the presence of phthalates in aqueous media [51-53]. The interdigital sensor with gold sensing electrodes was fabricated on a silicon substrate using micro-electrochemical system device fabrication technology. In additional, Parylene C polymer was used as the coating layer to protect the sensing electrode from oxidization. Another sensing system based on the interdigital sensor was developed to detect domoic acid [54, 55] in the seafood such as mussels, claws and oysters. Three different configurations of sensors had been designed and fabricated. All of three sensors have the same sensing surface area (4.75 mm x 5.00 mm) and the pitch length of 0.25 mm but the distance between two nearby positive and negative electrodes were changed. The first sensor was designed at 1-11-25, the second one. 16.
(28) was 1-5-25 and third one was 1-3-25. The first sensor has shown the better uniformity of electric field. The dielectric characterization of the interdigital sensor was used to evaluate epoxybased resin’s dielectric property which can observe the ionic conduction in the curing process in [56]. The movement of the peak in a dielectric loss means the different transition of the resin which can then be implemented for on-line cure monitoring.. 2.6 Novel Electromagnetic Sensor An electromagnetic sensor is a combination of meander coils with the interdigital sensor, thus show both inductive and capacitive properties. Yunus et al. [63] had developed a system to detect the nitrate based on the electromagnetic sensor. Two different types of connections between interdigital sensor and meander coils were discussed: parallel and series configuration. Figure 2.6.1 shows the schematic diagram of interdigital sensor and meander coils connected in parallel and figure 2.6.2 shows the series connection. Both the top view (left-hand side) and bottom view (right-hand side) were illustrated. One turn of the coil and five turns of meander coils connected to the interdigital sensor in parallel connection and series connection respectively. The Wattyl Killrust Incralac is used as an acrylic resin-based. The sensors were tested at two frequencies: 10 MHz and 500 kHz for nitrate detection. The sensor has more negative electrodes showed the most sensitive to nitrate and good correlation between the nitrate concentration and sensitivity.. Figure 2.6.1: Schematic diagram of sensor connected in parallel [63]. 17.
(29) Figure 2.6 2: Schematic diagram of sensor connected in series [63]. Further research to detect the nitrate concentration was based on the radial basis functions (RBF) neural network using planar electromagnetic sensor [64]. RBF has three layers: input layer, hidden layer and output layer. The input layer is the sensor node that measures impedance for detecting the nitrate; hidden layer provide the analyzed function, and the output layer is the linear combination of hidden functions. The planar electromagnetic sensor was immersed into the nitrate water sample and its output signal fed into the RBF Neural Network which can be analyzed to estimate different nitrate concentrations in water. It provided the detection range from 5.5 mg/L to 110 mg/L. Capacitive sensor based pH determination has been reported [65]. Applications of the interdigital sensor with meander coils includes inspection of printed circuit board, estimation of near-surface material properties, quality monitoring of dairy products and meat [66]. The exciting coil generates a magnetic field which passes through the conductor of the PCB. The eddy current is generated in the conductor which interacts with the generated magnetic field [67]. The resultant magnetic field produces induced voltage across the sensing coil. The voltage across the sensing coil was measured and analyzed so any defects existed in the PCB could be detected. The purpose of evaluating near-surface properties was to avoid unexpected accidents due to the material fatigue and aging [68]. Planar electromagnetic sensor is used for the nondestructive evaluation, and it can be used to measure the transfer impedance of coil for detection of any defects in the near-surface materials. The transfer impedance was calculated based on the finite element analysis, and results were obtained by an 18.
(30) off-line grid system which used to determine the near-surface material properties from real measured data [69]. Another application was to estimate the properties of the dielectric material in the diary product. The impedance changes with fat content in the milk [66]. The dielectric permittivity of fat has an effect on both of the resistance and reactance of impedance of the sensor. Both the magnitude and phase of the impedance were used for evaluation of the properties of the material under test. The frequency was another key element for the optimum result so the most precise frequency should be selected for measurement.. 2.7 Nitrate Detection Methods The techniques for the detection of nitrate are either simultaneously or sequentially. Simultaneous technique means the detection is independent of other analytes in one measurement [70] such as capillary electrophoresis [71-74] and electrochemical [7582]. 2.7.1 Electrochemical detection Electrochemical detection is based on the evaluation of potential, current or charge to characterize an analyte’s chemical reaction or determine its concentration. Zn (II), the complex-based coating on polymeric membranes, was developed to determine the nitrate concentration range from 5.0 x 10⁻⁵ to 1.0 x10⁻¹ M. This developed system based on the potentiometric sensor showed a fast response time of fewer than 25 seconds and an excellent detection limit of around 10-5 M [75]. Another potentiometric nitrate sensor was developed by Cuartero et al. [76]. This sensor consists of an all-solid-state nitrate selective electrode with lipophilic carbon nanotubes and a miniaturized reference electrode. It has the detecting limit of 5 x 10⁻⁷ M with the response time of 5 seconds. The amperometric method is used to measure the current at a given electrode to analyze the response of analyte as the current is changing with varying of concentration. Badea et al. [77] developed the electrochemical sensor to detect nitrate based on the Cellulose Acetate membrane. A three-electrode electrochemical sensor was designed based on nitrate-selective polypyrrole (Ppy) as working electrode [78, 79]. The working principles of this system are that a large number of nanopores will 19.
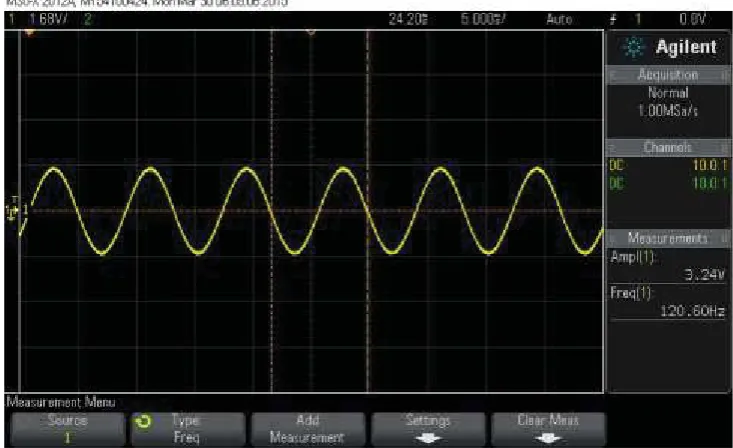
(31) be produced on the surface of the Ppy nanofiber when the working electrode is doping into the nitrate solution. The nitrate detection can be achieved by charge distribution within doped Ppy nanofibers [78]. Similarly, the nitrate was detected by using doped Ppy nanowires integrated with microfluidics [79]. The voltammetric method is also used to detect the nitrate concentration at a copper electrode [80, 82] without reagent electrodes. Based on the deposition of macroporous structure, the copper deposit showed selectivity for the nitrate ion with the detection range of 10 to 200 μM. Lonardi et al. [81] researched on nitrate sensor using silver nanoparticles embedded with polymethacrylic acid matrix electrode. The detection range is linear from 0-20 mM with limit of 0.5 mM by the voltammetric sensor. In [82], an in-situ copper plated boron-doped diamond microelectrode array was developed to detect nitrate with a limit of 0.76 μM. Table 2.7 1: Electrochemical detection summary. Working method Potentiometric Potentiometric. Working Electrode Zn(II) Lipophilic Carbon Nanotubes. Detection limit. Reference. 1 x 10⁻⁵ M. [75]. 5 x 10⁻⁷ M. [76]. Amperometric. Cellulose Acetate. 1 x 10⁻⁶ M. [77]. Amperometric. Ppy nanofibers. 1 x 10⁻⁴ M. [78]. Amperometric. Ppy nanowires. 4.5 x 10⁻⁶ M. [79]. Voltammetric. Copper. 1 x 10⁻⁵ M. [80]. 5 x 10⁻⁴ M. [81]. 7.6 x 10⁻⁷ M. [82]. Voltammetric Voltammetric. Silver nanoparticles Copper. Table 2.7.1 summarizes the electrochemical detection based on methods like potentiometric, amperometric and voltammetric. There are some advantages of electrochemical detection include: . Simple and cost effective 20.
(32) . Suitable for in-situ measurement. . Fast response and wide detection limit. On the other side, the disadvantages are: . The sensitivity relies on the working electrode. . Requires prepared reagent solutions. . Interference with other ions like phosphate, sulphate, chloride, etc. in the water. 2.7.2 Ion Chromatography Ion chromatography is used to measure the concentration of major anions in the water by separating their ionized samples based on their interface to a resin. The individual separation depends on their charge, species type and size. Sample solutions go through a pressurized column where the column constituents absorb the ions (called eluent). As the eluent runs through the column and the absorbed ions start separating from the column. The ionic concentration is determined by the retention time of different species as shown in figure 2.7.2.1 [83].. Figure 2.7.2.1: Schematic diagram of Ion Chromatography Method [83]. 21.
(33) Due to its high accuracy of measurement, it is widely used in determining nitrate concentration in process streams based on the conductometric detection [84], milk samples [85] and monitor the wastewater quality in the fertilizer industry [86]. However, the expensive equipment is required for this method, and it is designed for the bench top in the laboratory base. 2.7.3 Flow Injection Analysis methods The flow injection analysis technique has been used for the past forty decades. It is an automated method where the input sample is injected into the reagents carrier. The mixture of sample and reagents are pumped through the mixing coil into the detector. Figure 2.7.3.1 shows the schematic diagram of flow injection analysis methods.. Figure 2.7.3.1: Technicon Auto-Analyzer working diagram [87]. An automated system for monitoring multi-parameter was developed based on the sequential injection analysis [88]. The nitrate was detected by reducing to nitrite using the Griess-Ilovsvay method. It provides the detection limit of 0.0022 mg N/L for nitrate. The detection limit is depends on the machine/setup. In our lab, it has a detection limit of only 0.25 mg/L. As the next generation system of sequential injection analysis, the flow injection analysis is widely used for nitrate detection. A micro-potentiometric sensor is fabricated in a plasticized PVC membrane with bathophenanthroline nitrate to detect the nitrate concentration using flow injection analysis [89]. The developed sensor can detect the nitrate concentration in the range of 1.0 x 10⁻¹ to 1.0 x 10⁻⁶ mol/L with the limitation of low detection at 0.05 μg/mL. It can be used for determination of nitrate 22.
(34) in fertilizers, industrial wastewaters and pharmaceuticals. Research on the detection of nitrate in seawater based on flow injection analysis is also studied. The accuracy and sensitivity of the measurement are improved by using dual-wavelength spectrophotometry at low nitrate concentrations [90]. The flow injection analysis is also used to detect the nitrate and nitrite simultaneously. Luminol is used as a chemiluminescent reaction to detect the nitrite after oxidation and the nitrate is detected by non-toxic photolytic UV reduction. From this research, the nitrate can be -. detected from the range of 8 x 10⁻⁹ to 1 x 10⁻³ M NO3 [91]. A conventional flow injection system can only use one or more reagents are pumped into the stream of the sample which minimizing reagent consumption [92] and support the online monitoring [93]. The advantages of flow injection analysis include [90-93]: x. The high accuracy and sensitivity for measurement. x. Low use of the toxic materials. x. Low the reagent consumption. x. Supports online monitoring. However, there are some limitations of flow injection analysis method like: x. Very expensive equipment usually restricted to lab. x. Limited life of mechanical part such as valve and pump. x. Interference with other ions in the water sample. The spectrophotometric method is widely used to detect the NO3-N by using specific chemical reagents. For example, sulfanilic acid is used as reagent and nitrate concentration is determined by diazotization [94, 95]. In other research, Vanadium has been used for the reduction of nitrate ions by acidic Griess reaction [96]. Other detection methods include amperometric based biosensor [97], colorimetric [98, 99] and so on.. 2.8 Market Survey Hach is well-known as suppliers of an analytical instrument and chemical reagents for the laboratory-based purpose, especially for water quality and other liquid 23.
(35) solutions. Take IntelliCal ISENO3181 Nitrate Ion Selective Electrode (ISE) for nitrate detection as an example, it is designed by the solid-state PVC membrane with epoxy and solid gel ion exchange eliminates the frequency of replacing membrane. The ISE can only be used periodically in the lab or field and is not suited to continual measurement. It can detect the nitrate-nitrogen concentration from 0.1 to 14000 mg/L. It has an integrated temperature sensor which can measure the temperature range from 0-50oC. The price is at $2100. Hach Nitratax sc tank sensor is being used extensively internationally and in New Zealand. It uses the UV absorption measurement with reagent-free technique. There are three different models with the different detection range: 0.1 - 100 mg/L by Nitratax plus sc; 1.0 - 20 mg/L by Nitratax exo sc; and 0.5 - 20 mg/L by Nitratax clear sc. These models cost around $40k to 60k. “S::can” is Austria-based Company which provides varied product range for water and environmental monitoring. All “s::can” instruments are operated followed by the “plug & measure” principle, so all of them are ready to use with pre-calibrated works. The “spectro::lyser” UV monitors can be used to NO3-N detection. It is measured based on the UV-Vis spectrometry with the nitrate detection range from 0 - 20 mg/L. This instrument is also being used extensively internationally and in New Zealand. However, the whole set of the system is very expensive (around $60-70k). Hanna Instruments is focused on developing electro-analytical instrumentation. They provide the products like nitrate portable/benchtop photometer and nitrate ion selective electrode. For example, Hanna HI96728 is a portable checker to detect nitrate in freshwater based on the colorimetric method. A special Tungsten lamp is used as the light source and silicon photocell with narrow band interference filter at the wavelength of 525 nm used to detect the light. It uses the cadmium reduction method to determine the nitrate-nitrogen concentration range from 0.0 to 30.0 mg/L. The price is at around $350 NZD. Xylem is a world leader in providing compact instruments for water technology. It has a broad range of products under different brands. YSI is one of Xylem brand, which providing the environmental monitoring products. IQ SensorNet 182 is a modular water quality terminal which allowed connecting additional sensors such as 6884 Nitrate ISE sensor and it provides a continuously measurement of water quality parameters like pH, Dissolved oxygen, temperature, conductivity, ammonium, nitrate, 24.
(36) potassium, TOC (total organic carbon), COD (chemical oxygen demand), DOC (dissolved organic carbon share of TOC), BOD (biochemical oxygen demand) and SAC (spectral absorption coefficient). It has an easy-to-read digital display and wireless connection via radio transmission with a range of 100 meters. However, when it uses the nitrate sensor such as NitraLyt, the function of real-time monitoring is disabled. Another Xylem brand - WTW, it provides online measurement system TresCon Analyzer which can monitor Ammonium, Nitrate, and Nitrite continuously. A continuous water sample supply with low solids contents is required for operating this system. For nitrate detection, the UV light is absorbed by the nitrate ions and determines the nitrate concentration at a wavelength of 254 nm. ABB is a multinational corporation which mainly designs and manufactures power and automation products, including flow measurement, gas and liquid analyzer and environmental monitoring systems. For example, UV Nitrate Monitor AV455 provides a continuous analysis without chemical reagents. It can detect the nitrate concentration at the range of 0 to 100 mg/L at a wavelength of 220 nm. It requires low-maintenance and simple calibration with auto cleaning for the optical component. It uses de-nitrification as a process to reduce the nitrate concentrations for nitrate monitoring. ASA Analytics Inc. specializes in the manufacture of the automatic chemical analysis system. ChemScan 6101 Process Analyzer can monitor Ammonia, Phosphate, Nitrate-Nitrite and Phosphate in surface water based on the UVspectrometric method. The light is absorbed by nitrate ions and into 256 wavelengths of 200 to 450 nm. The detection range of nitrate is from 0.5 - 20 mg/L. Dionex Ion Chromatography with a UV/Visible absorbance detector is one product from Thermo Scientific. It is used to detect the nitrate and nitrite in drinking water with the detection limit of 10 ppb for nitrite and 15 ppb for nitrate. It is free from most ionic interferences due to the specificity of UV detection. The eluent is prepared by 1.8 mM sodium carbonate and 1.7 mM sodium bicarbonate for 1 L of eluent, diluting 10 mL of eluent concentration into 1000 mL of deionized water.. 25.
(37) Table 2.8.1: Summary of Commercial Nitrate Detection Products. Detection range. Model. Method of Detection. IntelliCal ISENO3181. Ion Selective Electrode 0.1 to 14000 mg/L. Nitratax plus sc. UV-photometric. 0.1 to 100 mg/L. S::can. UV-spectrometric. 0 - 20 mg/L. Hanna HI96728. Colorimetric. 0 to 30 mg/L. YSI 6884 Nitrate Sensor TresCon Analyzer UV Nitrate Monitor AV455 ChemScan 6101 Process Analyzer Dionex. (Nitrate). Ion Selective Electrode 0.0 - 200.0 mg/L UVspectrophotometric. 0.1 - 60 mg/L. Ion Exchange. 0 to 100 mg/L. UV-spectrometric. 0.5 - 20 mg/L. Ion Chromatography. Detection limit: 10 ppb. Table 2.8.1 summarizes the commercially available nitrate detection product/system in the market. Most of these products are used for the laboratory-based measurement. Hanna HI 96728 is a portable device, but it still needs to collect the sample and require the reagent for measurement of nitrate. The YSI IQ SensorNet 182 terminal provides the continuous monitoring, but it calls for a additional sensor for nitrate measurement.. 26.
(38) Chapter 3: Design and Development of Nitrate Sensing System 3.1 Introduction The objective of this chapter is to discuss the design and development of a low-cost sensing system for nitrate detection in natural waters using the interdigital sensor. The whole system consisted of a hardware circuit interfaced to microcontroller and data collection through wireless communication based on ZigBee protocol. It also included the microcontroller programming for data acquisition and control of pumps and the computer programming for Graphic User Interface (GUI), storage and analysis of data.. 3.2 System Overview The sensing system was developed for in-situ measurement of nitrate concentration. The developed system consists of a sensor and power supply, the signal processing circuit and control circuit, microcontroller. The functional block diagram of the system is illustrated in Figure 3.2.1.. Figure 3.2.1: Functional Block Diagram of the Sensing System. 27.
(39) The solar panel with the chargeable battery was used to supply the power to all components such as LM324, LM339, microcontroller, water pump with motor and solenoid valve. The water pump was used to take the water sample into the measurement container and to discharge the water sample. The solenoid valve was used to drain off the water sample from the container on the field. The microcontroller generated the PWM waveform which was filtered to get the excitation sinusoidal signal (input signal) at a frequency of 120 Hz (frequency selection was based on the experimental results). This excitation signal was applied to an interdigital sensor and output was fed into the signal smoothing circuit to eliminate the noise and amplify the signal. Both the input and output signals were fed into zero cross detector to get the phase difference between them and feed back to the microcontroller. The microcontroller also controlled the time interval to switch on/off the water pump and valve. All measured data were communicated to the main computer based on ZigBee protocol.. 3.3 Interfacing to Microcontroller The microcontroller board used in the project was Arduino Fio (Figure 3.3.1(a)) which is based on the ATmega328P to perform the signal generation, data acquisition and switch control of water pump and solenoid valve.. (b) Arduino Fio Pins Mapping. (a) Arduino Fio Board. Figure 3.3.1: Arduino Fio Board. Arduino Fio operates at 3.3 volts, and it has 14 digital pins and 8 analog pins which are used as input or outputs. It has two external interrupts pins (D2 and D3) and specific pins (D3, D5, D6, D9, D10, D11) for PWM output and controller by corresponding timers. Figure 3.3.1 (b) indicates the pins mapping between the 28.
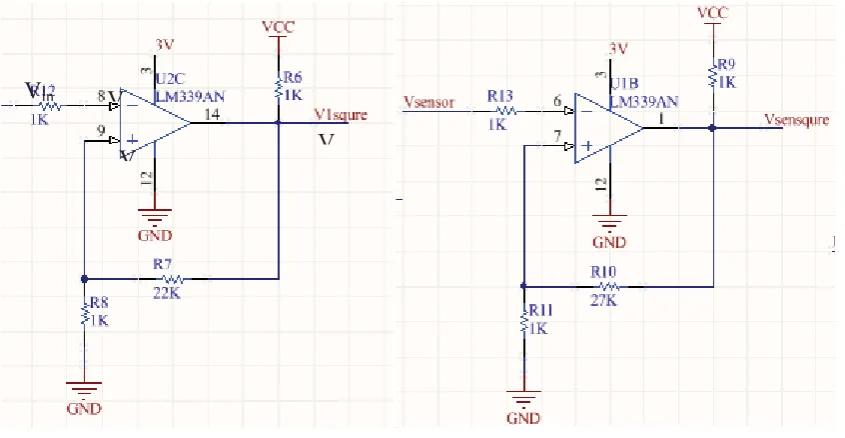
(40) hardware circuit and microcontroller board. The summary of ATmega328P is provided in Table 3.3.1. Table 3.3.1: Summary of ATmega328P. Operating Voltage. 3.3V. Input Voltage. 3.35 - 12V. Input Voltage for Charge. 3.7 - 7 V. Digital I/O Pins. 14 (of which 6 provide PWM output). Analog Input Pins. 8. DC Current per I/O Pin. 40 mA. Flash Memory. 32 KB (of which 2KB used by bootloader). SRAM. 2 KB. EEPROM. 1 KB. Clock Speed. 8 MHz. Width. 28 mm. Length. 65 mm. Weight. 9g. PWM output pins and. Timer 0: Pins 5 and 6. Timers. Timer 1: Pins 9 and 10 Timer 2: Pins 3 and 11. The objective of the interfacing sensor to the microcontroller is to measure the impedance of the sensor. In order to measure both the resistance and reactive part of the impedance, the input voltage (V1) and the voltage across the series resistance (V2) as shown in figure 3.3.2 were interfaced to the microcontroller via ADC inputs A0 and A1 respectively. To measure the phase difference between these two signals, the sinusoidal signals were first converted to square wave using zero-crossing 29.
(41) detectors (ZCD) and the waveforms from ZCD and then fed into digital inputs D2 and D3 respectively. With the help of the microcontroller, the time difference was measured and converted into phase angle in degree.. Figure 3.3.2: The interfacing of the sensor to the microcontroller. Figure 3.3.3 shows the picture of Printed Circuit Board (PCB) that involves voltage regulator, TLC555IP, the microcontroller, band-pass filter, LM324, LM338, MOSFET for control of pump and valve.. Figure 3.3.3: Picture of the system prototype based on the microcontroller. 30.
(42) The sinusoidal signal was produced using PWM output and a band-pass filter. Pin 6 of the microcontroller was used to generate the PWM output which was passed through a band-pass filter to reduce the noise and produce a smooth sinusoidal wave. The sinusoidal wave was used as the exciting source of the sensor. The sensor was not continuously dipped into the water as the water was pumped into a container at an interval of every 15 minutes. When the measurement was completed, the water was discharged from the container. The pumping in and out of the water was done through the pump and solenoid valve which were controlled by digital pin D12 and D13 respectively. Arduino Fio can communicate with a computer, another Arduino or other microcontroller [100]. The FTDI Basic was used for serial communication between Arduino Fio and computer which the Arduino software provided. The serial monitor showed the textual data sent from the microcontroller board. One of the advantages of using Arduino Fio is that there is an integrated socket for ZigBee (XBee). Digital pins D0 (RXI) and D1 (TXO) are used for serial communication between microcontroller and XBee. They receive and transmit TTL serial data and internally connect with DOUT and DIN pins respectively of Xbee (as shown in Figure 3.3.4).. Figure 3.3.4: Serial Communication by Arduino Fio with XBee. 3.4 Power Supply Circuits The solar panel with a rechargeable battery will be the main power source for the system but one 12-volt rechargeable battery was employed for the off-site experiment. The microcontroller, operational amplifier (LM324) and differential 31.
(43) comparator (LM339) were required to supply power at a voltage level at 3.3V which was necessary to reduce the voltage down to 3.3V by using a voltage regulator. There are different types of voltage regulators used for different purposes. The linear voltage regulator is the easiest type to use, and it can be divided into fixed and adjustable value voltage regulator. The advantages of linear regulator include low noise, low output voltage ripple, fast transient response and low cost but the excessive power dissipation is a major limitation [101]. The L78L33 is a linear fixed voltage regulator with the output voltage of 3.3V and output current up to 100mA which is sufficient for those components so it was employed for the experiment. Figure 3.4.1 shows the circuit for the voltage down from 12V to 3.3V by using L78L33 combined with a diode and capacitors. The diode (D1) was used to nullify the inverse voltage in the circuit and allow the current to flow in one direction. Capacitors (C3, C4, and C5) were used as decoupling capacitors to reduce the effect of noise.. Figure 3.4.1: Circuit for 3.3V voltage regulator application. On the other hand, the switch-mode power supply (SMPS) is also widely used for the application which requires high efficiency, high power density and low power dissipation [101]. SMPS is able to generate not only step-down output voltage but also step-up and reverse output voltage. The input signal applied to the sensor requires both the positive and negative magnitude of the alternating source, so the TLC555IP is employed to provide the negative power supply. The 555 IC is used in a variety of electronic applications such as a timer, pulse generation, and oscillators.. 32.
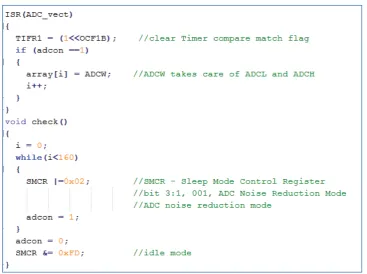
(44) Figure 3.4.2 shows the circuit that converted the positive input voltage to negative output voltage by using TCL55IP and other essential components. R17 is the pull-up resistor which was connected between VDD and discharging signal to make sure that the discharging signal is in either high or low state. R17, R18 and C6 made up a loop to generate the oscillatory output signal through charging and discharging of C6. When the output signal is high, C8 was charging, and D2 conducted the current to the ground but D3 was cut off. When the output signal went to low, the voltage across C8 went to zero as well. In this case, the polarity of D3 was changed so it could conduct the current and C9 started charging. Due to this opposite polarity, it generated the negative voltage.. Figure 3.4.2: Use of 555 to generate negative voltage. 3.5 Generation of Excitation Supply of the Sensor The direct digital synthesis (DDS) method is popularly used to generate wanted output at precise frequencies. DDS is implemented by breaking an analog waveform into discrete digital points which are stored in an array as a lookup table (LUT), and the use of phase accumulator is done to calculate a phase angle for LUT and then generate the digital value at different amplitude [102]. Figure 3.5.1 shows the microcontroller code that stored the hexadecimal value of sine waveform in the array as LUT.. 33.
Figure
![Figure 1.1.1: Median nitrate concentrations measured in groundwater (1995-2008) [7]](https://thumb-us.123doks.com/thumbv2/123dok_us/8396228.324644/13.595.203.439.77.372/figure-median-nitrate-concentrations-measured-groundwater.webp)
+7
Related documents
The Community is uniquely well placed to take the lead in joint activities carried out at the least cost for each participating Member State (e.g. nuclear safety,
If a Z-Wave device is not plugged into an AC outlet and the user attempts to control it, the LYNX Touch will recognize it as a Failed device and the Z-Wave Device Failed icon will
2 The theatrical portrait represented the merging of painting and theatre, and the universal popularity of the London stage at the time was no less significant to the genre than
Table 1 Details the static variables used to define the rearfoot, ankle, first ray, forefoot and hallux deformities investigated, the foot kinematic variab les used to compare feet
Multiple logistic regression analysis of data for the full analysis population was performed to explore the combined effect of baseline lung function and baseline symptom severity
Still the image compression technique based on 2-D discrete wavelet transform (DWT) has recently gained superiority above traditional JPEG based upon discrete
Methods: NOD-scid IL2R γ null mice engrafted with human peripheral blood mononuclear cells (hPBMC) derived from patients suffering from AD and healthy volunteers were treated with
This study explored the relationship between lifestyle balance, emotion regulation and relapse with 25 participants, aged between 18 and 55, actively seeking treatment through
