ScienceDirect
Available online at Available online at www.sciencedirect.comwww.sciencedirect.com
ScienceDirect
Energy Procedia 00 (2017) 000–000
www.elsevier.com/locate/procedia
1876-6102 © 2017 The Authors. Published by Elsevier Ltd.
Peer-review under responsibility of the Scientific Committee of The 15th International Symposium on District Heating and Cooling.
The 15th International Symposium on District Heating and Cooling
Assessing the feasibility of using the heat demand-outdoor
temperature function for a long-term district heat demand forecast
I. Andrić
a,b,c*, A. Pina
a, P. Ferrão
a, J. Fournier
b., B. Lacarrière
c, O. Le Corre
caIN+ Center for Innovation, Technology and Policy Research - Instituto Superior Técnico, Av. Rovisco Pais 1, 1049-001 Lisbon, Portugal bVeolia Recherche & Innovation, 291 Avenue Dreyfous Daniel, 78520 Limay, France
cDépartement Systèmes Énergétiques et Environnement - IMT Atlantique, 4 rue Alfred Kastler, 44300 Nantes, France
Abstract
District heating networks are commonly addressed in the literature as one of the most effective solutions for decreasing the greenhouse gas emissions from the building sector. These systems require high investments which are returned through the heat sales. Due to the changed climate conditions and building renovation policies, heat demand in the future could decrease, prolonging the investment return period.
The main scope of this paper is to assess the feasibility of using the heat demand – outdoor temperature function for heat demand forecast. The district of Alvalade, located in Lisbon (Portugal), was used as a case study. The district is consisted of 665 buildings that vary in both construction period and typology. Three weather scenarios (low, medium, high) and three district renovation scenarios were developed (shallow, intermediate, deep). To estimate the error, obtained heat demand values were compared with results from a dynamic heat demand model, previously developed and validated by the authors.
The results showed that when only weather change is considered, the margin of error could be acceptable for some applications (the error in annual demand was lower than 20% for all weather scenarios considered). However, after introducing renovation scenarios, the error value increased up to 59.5% (depending on the weather and renovation scenarios combination considered). The value of slope coefficient increased on average within the range of 3.8% up to 8% per decade, that corresponds to the decrease in the number of heating hours of 22-139h during the heating season (depending on the combination of weather and renovation scenarios considered). On the other hand, function intercept increased for 7.8-12.7% per decade (depending on the coupled scenarios). The values suggested could be used to modify the function parameters for the scenarios considered, and improve the accuracy of heat demand estimations.
© 2017 The Authors. Published by Elsevier Ltd.
Peer-review under responsibility of the Scientific Committee of The 15th International Symposium on District Heating and Cooling.
Keywords:Heat demand; Forecast; Climate change
Energy Procedia 121 (2017) 118–125
1876-6102 © 2017 The Authors. Published by Elsevier Ltd.
Peer-review under responsibility of the scientific committee of the International Conference on Improving Residential Energy Efficiency. 10.1016/j.egypro.2017.08.008
International Conference on Improving Residential Energy Efficiency, IREE 2017
10.1016/j.egypro.2017.08.008 1876-6102
© 2017 The Authors. Published by Elsevier Ltd.
Peer-review under responsibility of the scientific committee of the International Conference on Improving Residential Energy Efficiency.
Available online at www.sciencedirect.com
ScienceDirect
Energy Procedia 00 (2017) 000–000
www.elsevier.com/locate/procedia
1876-6102 © 2017 The Authors. Published by Elsevier B.V.
Peer-review under the responsibility of the scientific committee of Improving Residential Energy Efficiency International Conference, IREE 2017.
Improving Residential Energy Efficiency International Conference, IREE 2017
Thermal performance evaluation of an integrated photovoltaic
thermal-phase change material system using Taguchi method
Haoshan Ren
a,*, Wenye Lin
a, Zhenjun Ma
a, Wenke Fan
aaSustainable Buildings Research Centre (SBRC), University of Wollongong, Wollongong, NSW, 2522
Abstract
This paper presents the performance evaluation of an integrated photovoltaic thermal (PVT) collector-phased change material (PCM) thermal energy storage (TES) system. The PVT collectors can generate both electricity and low-grade thermal energy during the daytime, and the thermal energy generated can be temporarily stored in the PCM TES unit and used for space heating during the night-time. Taguchi method and analysis of variance are used for the simulation design and data analysis, respectively. The thermal performance of the proposed system was evaluated in terms of the useful energy stored in the TES system. The results showed that the outlet air temperature of the TES unit remained at least 2oC higher than the inlet air
temperature during the discharging process in the selected test day. The PCM type and the PCM charging air flow rate were the most important factors influencing the useful energy stored in the TES system.
© 2017 The Authors. Published by Elsevier B.V.
Peer-review under the responsibility of the scientific committee of Improving Residential Energy Efficiency International Conference, IREE 2017.
Keywords: Photovoltaic thermal collector; Phase change material; Thermal energy storage; Domestic space heating.
1.Introduction
Buildings are one of the major energy consumers and account for around 40% of total energy use worldwide in 2015 [1]. In the building sector, a significant amount of energy was used by heating, ventilation, and air conditioning (HVAC) systems. In order to reduce the energy consumption of building HVAC systems, many
* Corresponding author.
E-mail address: [email protected]
Available online at www.sciencedirect.com
ScienceDirect
Energy Procedia 00 (2017) 000–000
www.elsevier.com/locate/procedia
1876-6102 © 2017 The Authors. Published by Elsevier B.V.
Peer-review under the responsibility of the scientific committee of Improving Residential Energy Efficiency International Conference, IREE 2017.
Improving Residential Energy Efficiency International Conference, IREE 2017
Thermal performance evaluation of an integrated photovoltaic
thermal-phase change material system using Taguchi method
Haoshan Ren
a,*, Wenye Lin
a, Zhenjun Ma
a, Wenke Fan
aaSustainable Buildings Research Centre (SBRC), University of Wollongong, Wollongong, NSW, 2522
Abstract
This paper presents the performance evaluation of an integrated photovoltaic thermal (PVT) collector-phased change material (PCM) thermal energy storage (TES) system. The PVT collectors can generate both electricity and low-grade thermal energy during the daytime, and the thermal energy generated can be temporarily stored in the PCM TES unit and used for space heating during the night-time. Taguchi method and analysis of variance are used for the simulation design and data analysis, respectively. The thermal performance of the proposed system was evaluated in terms of the useful energy stored in the TES system. The results showed that the outlet air temperature of the TES unit remained at least 2oC higher than the inlet air
temperature during the discharging process in the selected test day. The PCM type and the PCM charging air flow rate were the most important factors influencing the useful energy stored in the TES system.
© 2017 The Authors. Published by Elsevier B.V.
Peer-review under the responsibility of the scientific committee of Improving Residential Energy Efficiency International Conference, IREE 2017.
Keywords: Photovoltaic thermal collector; Phase change material; Thermal energy storage; Domestic space heating.
1.Introduction
Buildings are one of the major energy consumers and account for around 40% of total energy use worldwide in 2015 [1]. In the building sector, a significant amount of energy was used by heating, ventilation, and air conditioning (HVAC) systems. In order to reduce the energy consumption of building HVAC systems, many
* Corresponding author.
E-mail address: [email protected]
2 Ren et al. / Energy Procedia 00 (2017) 000–000
energy efficient technologies have been investigated over the last two decades. The integration of phase change materials (PCMs) with photovoltaic thermal (PVT) collectors is attracting increasing attention, as PVT collectors can generate both electricity and thermal energy simultaneously, while the PCMs with high energy storage densities can be used as an effective solution to solve the mismatch between the thermal energy generation from the PVT collectors and building heating demand.
Nomenclature
A area of each control volume along the PVT length (m2)
cp specific heat (kJ/kg K)
Gt total horizontal solar radiation (W/m2)
h enthalpy (kJ/kg)
hc forced convection coefficient (kg/h m2 K)
hnc natural convection coefficient for stagnant air layer (kg/h m2 K)
hr radiation heat transfer coefficient (kJ/h m2 K)
hw wind convection coefficient (kJ/h m2 K)
Hfin fin height (m)
It global solar insolation on the PVT surface (kJ/h m2)
k thermal conductivity (W/m K)
m mass (kg)
ṁ air mass flow rate (kg/h)
M mass per unit area (kg/m2)
ݍሶ heat flux (W/m2)
T temperature (oC)
v velocity (m/s)
W PVT width (m)
Greek symbols
δ thickness (m)
ρ density (kg/m3)
Subscripts
amb ambient air
b bottom plate
f flowing air
fin longitudinal fin
g glass cover
pv photovoltaic plate
ref reference
A number of studies have reported the integration of PCM thermal energy storage (TES) units with PVT
collectors. For instance, Malvi et al. [2] numerically investigated a PVT system incorporating PCMs for dwelling
application. The simulation results indicated that the PV output of the proposed system was increased by 9% with an average water temperature rise of 20oC in comparison with a PV-only system. Fiorentini et al. [3] presented a
solar-assisted HVAC system in which the thermal energy generated by the PVT collector was stored in an
air-based PCM TES unit and used to regulate the building heating demand. Lin et al. [4] developed a PCM-enhanced
ceiling ventilation system integrated with air-based PVT collectors. The simulation results showed that this system can improve the indoor thermal comfort during winter time using the low-grade thermal heat generated from the
PVT collectors. Lin et al. [5] also investigated the potential of using thermal energy generated by the PVT
Haoshan Ren et al. / Energy Procedia 121 (2017) 118–125 119
ScienceDirect
Energy Procedia 00 (2017) 000–000
www.elsevier.com/locate/procedia
1876-6102 © 2017 The Authors. Published by Elsevier B.V.
Peer-review under the responsibility of the scientific committee of Improving Residential Energy Efficiency International Conference, IREE 2017.
Improving Residential Energy Efficiency International Conference, IREE 2017
Thermal performance evaluation of an integrated photovoltaic
thermal-phase change material system using Taguchi method
Haoshan Ren
a,*, Wenye Lin
a, Zhenjun Ma
a, Wenke Fan
aaSustainable Buildings Research Centre (SBRC), University of Wollongong, Wollongong, NSW, 2522
Abstract
This paper presents the performance evaluation of an integrated photovoltaic thermal (PVT) collector-phased change material (PCM) thermal energy storage (TES) system. The PVT collectors can generate both electricity and low-grade thermal energy during the daytime, and the thermal energy generated can be temporarily stored in the PCM TES unit and used for space heating during the night-time. Taguchi method and analysis of variance are used for the simulation design and data analysis, respectively. The thermal performance of the proposed system was evaluated in terms of the useful energy stored in the TES system. The results showed that the outlet air temperature of the TES unit remained at least 2oC higher than the inlet air
temperature during the discharging process in the selected test day. The PCM type and the PCM charging air flow rate were the most important factors influencing the useful energy stored in the TES system.
© 2017 The Authors. Published by Elsevier B.V.
Peer-review under the responsibility of the scientific committee of Improving Residential Energy Efficiency International Conference, IREE 2017.
Keywords: Photovoltaic thermal collector; Phase change material; Thermal energy storage; Domestic space heating.
1.Introduction
Buildings are one of the major energy consumers and account for around 40% of total energy use worldwide in 2015 [1]. In the building sector, a significant amount of energy was used by heating, ventilation, and air conditioning (HVAC) systems. In order to reduce the energy consumption of building HVAC systems, many
* Corresponding author.
E-mail address: [email protected]
ScienceDirect
Energy Procedia 00 (2017) 000–000
www.elsevier.com/locate/procedia
1876-6102 © 2017 The Authors. Published by Elsevier B.V.
Peer-review under the responsibility of the scientific committee of Improving Residential Energy Efficiency International Conference, IREE 2017.
Improving Residential Energy Efficiency International Conference, IREE 2017
Thermal performance evaluation of an integrated photovoltaic
thermal-phase change material system using Taguchi method
Haoshan Ren
a,*, Wenye Lin
a, Zhenjun Ma
a, Wenke Fan
aaSustainable Buildings Research Centre (SBRC), University of Wollongong, Wollongong, NSW, 2522
Abstract
This paper presents the performance evaluation of an integrated photovoltaic thermal (PVT) collector-phased change material (PCM) thermal energy storage (TES) system. The PVT collectors can generate both electricity and low-grade thermal energy during the daytime, and the thermal energy generated can be temporarily stored in the PCM TES unit and used for space heating during the night-time. Taguchi method and analysis of variance are used for the simulation design and data analysis, respectively. The thermal performance of the proposed system was evaluated in terms of the useful energy stored in the TES system. The results showed that the outlet air temperature of the TES unit remained at least 2oC higher than the inlet air
temperature during the discharging process in the selected test day. The PCM type and the PCM charging air flow rate were the most important factors influencing the useful energy stored in the TES system.
© 2017 The Authors. Published by Elsevier B.V.
Peer-review under the responsibility of the scientific committee of Improving Residential Energy Efficiency International Conference, IREE 2017.
Keywords: Photovoltaic thermal collector; Phase change material; Thermal energy storage; Domestic space heating.
1.Introduction
Buildings are one of the major energy consumers and account for around 40% of total energy use worldwide in 2015 [1]. In the building sector, a significant amount of energy was used by heating, ventilation, and air conditioning (HVAC) systems. In order to reduce the energy consumption of building HVAC systems, many
* Corresponding author.
E-mail address: [email protected]
2 Ren et al. / Energy Procedia 00 (2017) 000–000
energy efficient technologies have been investigated over the last two decades. The integration of phase change materials (PCMs) with photovoltaic thermal (PVT) collectors is attracting increasing attention, as PVT collectors can generate both electricity and thermal energy simultaneously, while the PCMs with high energy storage densities can be used as an effective solution to solve the mismatch between the thermal energy generation from the PVT collectors and building heating demand.
Nomenclature
A area of each control volume along the PVT length (m2)
cp specific heat (kJ/kg K)
Gt total horizontal solar radiation (W/m2)
h enthalpy (kJ/kg)
hc forced convection coefficient (kg/h m2 K)
hnc natural convection coefficient for stagnant air layer (kg/h m2 K)
hr radiation heat transfer coefficient (kJ/h m2 K)
hw wind convection coefficient (kJ/h m2 K)
Hfin fin height (m)
It global solar insolation on the PVT surface (kJ/h m2)
k thermal conductivity (W/m K)
m mass (kg)
ṁ air mass flow rate (kg/h)
M mass per unit area (kg/m2)
ݍሶ heat flux (W/m2)
T temperature (oC)
v velocity (m/s)
W PVT width (m)
Greek symbols
δ thickness (m)
ρ density (kg/m3)
Subscripts
amb ambient air
b bottom plate
f flowing air
fin longitudinal fin
g glass cover
pv photovoltaic plate
ref reference
A number of studies have reported the integration of PCM thermal energy storage (TES) units with PVT
collectors. For instance, Malvi et al. [2] numerically investigated a PVT system incorporating PCMs for dwelling
application. The simulation results indicated that the PV output of the proposed system was increased by 9% with an average water temperature rise of 20oC in comparison with a PV-only system. Fiorentini et al. [3] presented a
solar-assisted HVAC system in which the thermal energy generated by the PVT collector was stored in an
air-based PCM TES unit and used to regulate the building heating demand. Lin et al. [4] developed a PCM-enhanced
ceiling ventilation system integrated with air-based PVT collectors. The simulation results showed that this system can improve the indoor thermal comfort during winter time using the low-grade thermal heat generated from the
PVT collectors. Lin et al. [5] also investigated the potential of using thermal energy generated by the PVT
120 Ren et al. / Energy Procedia 00 (2017) 000–000 Haoshan Ren et al. / Energy Procedia 121 (2017) 118–125 3
indoor thermal performance of the house without using air conditioning systems in winter conditions, and the use
of the PCM can greatly reduce the indoor temperature fluctuations. Al Imam et al. [6] examined the performance
of a water-based PVT collector with a PCM layer under the absorber plate for thermal storage. The experimental results showed that the PVT thermal efficiency was in the range of 40-50% in winter, while that of the flat plate collectors without the PCM was around 35%.
This paper presents the performance evaluation of an integrated PVT-PCM TES system. A PCM model considering the hysteresis phenomenon during the phase change process was developed to simulate the thermal performance of the PCM TES unit. The thermal energy generated from the PVT collectors was temporarily stored in the PCM TES unit and then used later for space heating during winter. The thermal performance of the integrated PVT-PCM TES system was examined in terms of a performance indicator of the useful energy stored, based on a set of simulation trial tests designed using Taguchi method.
2.System modelling and methodology
2.1.System description and modelling
The integrated PVT-PCM TES system is illustrated in Fig. 1, in which the PVT collectors and a PCM TES unit are connected in series. During the daytime, the thermal energy generated from the PVT collectors can be stored in the PCM TES unit or can be directly used for space heating when there is a demand. During the night-time, the stored heat in the PCM TES unit can be used for space heating.
Fig. 1. (a) Schematic of the integrated PVT-PCM TES system and; (b) PCM brick considered in this study [7].
[image:3.544.104.410.312.406.2]A PVT collector with fins and a glass cover [8] was used in this study, as shown in Fig. 2. The glass cover was placed above the PV plate, creating an air gap between the two plates as the thermal insulation. The PV plate was attached to an absorber plate through an adhesive layer. A number of air channels where the heat transfer fluid flows through were created between the absorber and the bottom plate of the PVT collector, and fins were used to enhance the convection heat transfer in the air channels. The bottom plate was insulated in order to reduce the heat transfer between the PVT collectors and the roof-top of the building.
Fig. 2. Schematic of the PVT collector.
The performance of the PVT collector was simulated using a dynamic model developed in an earlier study [8], in which the PVT was first discretized into multiple control volumes along the air flow direction and further discretized vertically into six nodes including the glass cover, PV plate, absorber plate, fins, fluid air, and the bottom plate. The key governing equations of the glass cover and the fluid air are described in Eqs. (1) and (2),
4 Ren et al. / Energy Procedia 00 (2017) 000–000
respectively. The governing equations of the other nodes can be described in the same way. All the governing equations were solved with a Crank-Nicolson scheme. More details of this model can be found in [8].
ܣܿǡܯడ்డ௧ǡൌ
ߙܫ௧ܣ ݄ܣ൫ܶ௩ǡെ ܶǡ൯ ݄ǡ௩ିܣ൫ܶ௩ǡെ ܶǡ൯ ݄௪ܣ൫ܶെ ܶǡ൯ ݄ǡି௦௬ܣ൫ܶ௦௬െ ܶǡ൯ (1)
ܿǡߩοݔ൫ܹܪ൯డ்ǡ
డ௧ ܿǡ݉ሶ οݔ డ்ǡ
డ௫ ൌ
݄ǡିܣ൫ܶǡെ ܶǡ൯ ݄ǡିܣ൫ܶǡെ ܶǡ൯ ʹ݄ǡିܣ൫ܶǡെ ܶǡ൯ (2)
The PCM TES unit was simulated using a finite-difference model developed using an enthalpy method. The key assumptions used in the model development are as follows.
The convection heat transfer within the liquid PCM was neglected and the conduction heat transfer
within the PCM bricks was considered one-dimensional;
The specific heat capacity of the liquid PCM and solid PCM beyond the phase change region was
assumed to be identical and constant;
The conduction heat transfer between the adjacent PCM bricks and the radiation heat transfer from the
surfaces inside the TES unit were neglected;
In each air channel, the air temperature variation only existed along the air flow direction;
The air velocities in all air channels separated by the PCM layers were the same; and
There was no natural convection of air within the TES unit.
The schematic of the nodes in the modelling of the PCM TES unit is presented in Fig. 3. A number of PCM arrays were arranged in parallel to form the PCM TES unit, in which the air channels were created between the PCM arrays. Each PCM layer consisted of multiple PCM bricks (see Fig. 1), based on which the PCM TES unit was divided into multiple sections containing both air nodes and PCM bricks, along with the air flow direction (see Fig. 3). The governing equations for the energy balance of each PCM node and each air node are expressed in Eqs. (3) and (4), respectively. The left-hand side term in Eq. (3) represents the energy storage rate in a single PCM node, while the right-hand side term represents the conductive heat transfer among the PCM nodes across the air flow direction. The boundary condition in Eq. (3) is the convection heat transfer to the air flowing through the air channels. The left-hand side term in Eq. (4) represents the energy storage rate of an air node, and the first right-hand side term represents the energy change rate of the air node along the air flow direction and the other one represents the convection heat gain from the PCM nodes above and beneath the air nodes.
Fig. 3. Schematic of the nodes in the modelling of the PCM TES unit.
[image:3.544.144.404.520.605.2]indoor thermal performance of the house without using air conditioning systems in winter conditions, and the use
of the PCM can greatly reduce the indoor temperature fluctuations. Al Imam et al. [6] examined the performance
of a water-based PVT collector with a PCM layer under the absorber plate for thermal storage. The experimental results showed that the PVT thermal efficiency was in the range of 40-50% in winter, while that of the flat plate collectors without the PCM was around 35%.
This paper presents the performance evaluation of an integrated PVT-PCM TES system. A PCM model considering the hysteresis phenomenon during the phase change process was developed to simulate the thermal performance of the PCM TES unit. The thermal energy generated from the PVT collectors was temporarily stored in the PCM TES unit and then used later for space heating during winter. The thermal performance of the integrated PVT-PCM TES system was examined in terms of a performance indicator of the useful energy stored, based on a set of simulation trial tests designed using Taguchi method.
2.System modelling and methodology
2.1.System description and modelling
The integrated PVT-PCM TES system is illustrated in Fig. 1, in which the PVT collectors and a PCM TES unit are connected in series. During the daytime, the thermal energy generated from the PVT collectors can be stored in the PCM TES unit or can be directly used for space heating when there is a demand. During the night-time, the stored heat in the PCM TES unit can be used for space heating.
Fig. 1. (a) Schematic of the integrated PVT-PCM TES system and; (b) PCM brick considered in this study [7].
A PVT collector with fins and a glass cover [8] was used in this study, as shown in Fig. 2. The glass cover was placed above the PV plate, creating an air gap between the two plates as the thermal insulation. The PV plate was attached to an absorber plate through an adhesive layer. A number of air channels where the heat transfer fluid flows through were created between the absorber and the bottom plate of the PVT collector, and fins were used to enhance the convection heat transfer in the air channels. The bottom plate was insulated in order to reduce the heat transfer between the PVT collectors and the roof-top of the building.
Fig. 2. Schematic of the PVT collector.
The performance of the PVT collector was simulated using a dynamic model developed in an earlier study [8], in which the PVT was first discretized into multiple control volumes along the air flow direction and further discretized vertically into six nodes including the glass cover, PV plate, absorber plate, fins, fluid air, and the bottom plate. The key governing equations of the glass cover and the fluid air are described in Eqs. (1) and (2),
respectively. The governing equations of the other nodes can be described in the same way. All the governing equations were solved with a Crank-Nicolson scheme. More details of this model can be found in [8].
ܣܿǡܯడ்డ௧ǡ ൌ
ߙܫ௧ܣ ݄ܣ൫ܶ௩ǡെ ܶǡ൯ ݄ǡ௩ିܣ൫ܶ௩ǡെ ܶǡ൯ ݄௪ܣ൫ܶെ ܶǡ൯ ݄ǡି௦௬ܣ൫ܶ௦௬െ ܶǡ൯ (1)
ܿǡߩοݔ൫ܹܪ൯డ்ǡ
డ௧ ܿǡ݉ሶ οݔ డ்ǡ
డ௫ ൌ
݄ǡିܣ൫ܶǡെ ܶǡ൯ ݄ǡିܣ൫ܶǡെ ܶǡ൯ ʹ݄ǡିܣ൫ܶǡെ ܶǡ൯ (2)
The PCM TES unit was simulated using a finite-difference model developed using an enthalpy method. The key assumptions used in the model development are as follows.
The convection heat transfer within the liquid PCM was neglected and the conduction heat transfer
within the PCM bricks was considered one-dimensional;
The specific heat capacity of the liquid PCM and solid PCM beyond the phase change region was
assumed to be identical and constant;
The conduction heat transfer between the adjacent PCM bricks and the radiation heat transfer from the
surfaces inside the TES unit were neglected;
In each air channel, the air temperature variation only existed along the air flow direction;
The air velocities in all air channels separated by the PCM layers were the same; and
There was no natural convection of air within the TES unit.
[image:4.544.39.487.113.191.2]The schematic of the nodes in the modelling of the PCM TES unit is presented in Fig. 3. A number of PCM arrays were arranged in parallel to form the PCM TES unit, in which the air channels were created between the PCM arrays. Each PCM layer consisted of multiple PCM bricks (see Fig. 1), based on which the PCM TES unit was divided into multiple sections containing both air nodes and PCM bricks, along with the air flow direction (see Fig. 3). The governing equations for the energy balance of each PCM node and each air node are expressed in Eqs. (3) and (4), respectively. The left-hand side term in Eq. (3) represents the energy storage rate in a single PCM node, while the right-hand side term represents the conductive heat transfer among the PCM nodes across the air flow direction. The boundary condition in Eq. (3) is the convection heat transfer to the air flowing through the air channels. The left-hand side term in Eq. (4) represents the energy storage rate of an air node, and the first right-hand side term represents the energy change rate of the air node along the air flow direction and the other one represents the convection heat gain from the PCM nodes above and beneath the air nodes.
Fig. 3. Schematic of the nodes in the modelling of the PCM TES unit.
[image:4.544.146.401.467.586.2]122 Haoshan Ren et al. / Energy Procedia 121 (2017) 118–125
Ren et al. / Energy Procedia 00 (2017) 000–000 5
�����
����� �� � ����
������
���
�������� ����������� ������������
��� �� ���� ����� ������������
(3)
����� �� � ����
����� �� �
�����������
�������������� (4)
2.2.Performance indicator
A performance indicator, named as useful energy stored (UES), was developed and used to evaluate the amount of the useful thermal energy stored in the PCM TES unit, which was considered to be useful for space heating. It was defined as the useful thermal energy stored in the PCM based on a reference enthalpy, as expressed in Eq. (5).
The reference enthalpy was assumed as the enthalpy of a PCM at 20oC.
��� � ��� � ����� (5)
2.3.Simulation design using Taguchi method
In this study, Taguchi method was used to design trial simulations based on an orthogonal array in order to obtain the maximum amount of the information on the thermal performance of the system with a minimum number of simulation exercises. Analysis of variance (ANOVA) was used to investigate the response significance of the individual factors and identify the percentage contribution of each factor to the objective function. The sum of squares of factors, the pure sum of squares of factors, the variance of factors and percentage contribution of factors were the key statistic parameters used in ANOVA [9]. Five parameters, including the PCM type, the thickness of the PCM brick, the length of the PCM TES unit, the PCM charging air flow rate, and the size of the air gap between the glass cover and the PV cell in the PVT collector were selected as the control factors for performance analysis since these variables have been reported to be critical to the performance of PVT collectors and PCM TES units [10-12]. The PCMs considered in this study were SP24E and SP26E available from Rubitherm with a melting
range of 24-25oC and 25-27oC, respectively [7]. Other control factors were designed to have three levels as
summarised in Table 1. An L18 (21×37) orthogonal array was used to design the simulation cases and the resulted
orthogonal array is shown in Table 1.
Table 1.Control factors and their corresponding factor levels.
Factor level Type of PCM Thickness of the
PCM brick (mm) Length (m) Air flow rate (kg/h) Size of the air gap (mm)
1 SP24E 10 3.0 1000 5
2 SP26E 20 4.5 1500 12
3 30 6.0 2000 20
3.Results and discussions
3.1.Setup the tests
The thermal performance of the proposed system was evaluated under Melbourne winter weather conditions. The useful energy stored during the daytime was used as the objective response for performance evaluation.
The PVT collectors were assumed to be installed on a Solar Decathlon house [4] with an installation area of 4 m
(L)×10 m (W). The configuration of the PCM TES unit used was similar to that of Charvát et al. [10]. The storage
capacity of the TES unit was determined based on two days of the heating demand of the house [3] and therefore the same amount of the PCM was used when varying the thickness of the PCM brick and the length of the TES
unit. The size of the air channels was determined based on the recommendations from Dolado et al. [11]. The
number of the air channels was therefore determined based on the given thickness of the PCM brick and the length
6 Ren et al. / Energy Procedia 00 (2017) 000–000
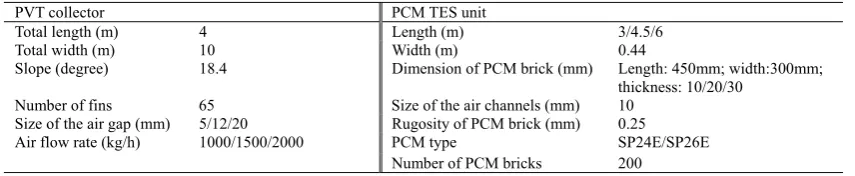
of the TES unit. The specifications of the PVT collector and the PCM TES unit are summarised in Table 2. As the solar radiation may not be strong during the early morning and late afternoon in winter, it was assumed that the PCM TES unit was charged using the thermal energy collected by the PVT from 9:00 to 16:00. During this period, if the temperature of the outlet air from the PVT collectors was lower than the equivalent temperature of the PCM TES unit, the charging process will be suspended and it will be restarted once the outlet air temperature from the PVT collectors was high enough. The discharging process was assumed to be from 16.00 to 9:00 of next day. It is noted that the equivalent temperature of the PCM TES unit was obtained according to the average enthalpy of the PCM TES unit which was the average enthalpy of all PCM nodes in the TES unit. The inlet air temperature of the
PCM TES unit during the discharging process was assumed as 20oC in this study by assuming that the return air
from the indoor space can be used for thermal discharge. The simulations were carried out for three days and the results of the last day were presented to demonstrate the performance of the proposed integrated system. Fig. 4 shows the ambient air temperature and the total horizontal solar radiation (Gt) of the selected last day.
Fig. 4. Weather data used for performance evaluation.
Table 2. Specifications of the PVT collectors and the PCM TES unit.
PVT collector PCM TES unit
Total length (m) 4 Length (m) 3/4.5/6
Total width (m) 10 Width (m) 0.44
Slope (degree) 18.4 Dimension of PCM brick (mm) Length: 450mm; width:300mm;
thickness: 10/20/30
Number of fins 65 Size of the air channels (mm) 10
Size of the air gap (mm) 5/12/20 Rugosity of PCM brick (mm) 0.25
Air flow rate (kg/h) 1000/1500/2000 PCM type SP24E/SP26E
Number of PCM bricks 200
3.2.Results of model validation
To validate the model of the PCM TES unit developed, the experimental data reported by Lopez et al. [13] was
used and the results are presented in Fig. 5. The model developed was modified in order to have the same
configuration as that of the experimental setup used by Lopez et al. [13] through reducing the number of the air
channels to two and assuming that the external surface of the TES unit was well-insulated. It can be seen that the simulated outlet air temperature from the PCM TES under both charging and discharging processes matched well with that of the experimental data, indicating that the model developed can provide an acceptable estimation.
Fig. 5. Model validation (a) charging process, (b) discharging process.
0 1 2 3 4 5 6 7 8 9 10 11
0 5 10 15 20 25 30 35 40
Time / h
Te
m
perat
ure
/
C
Tair,in Tair,out , experiment
Tair,out , modelling
0 1 2 3 4 5 6 7 8 9 10 11
0 5 10 15 20 25 30 35 40
Time / h
Te
m
perat
ure
/
C
Tair,in Tair,out , experiment
Tair,out , modelling
(a)
[image:5.544.92.448.484.531.2]�����
����� �� � ����
������
���
�������� ����������� ������������
��� �� ���� ����� ������������
(3)
����� �� � ����
����� �� �
�����������
�������������� (4)
2.2.Performance indicator
A performance indicator, named as useful energy stored (UES), was developed and used to evaluate the amount of the useful thermal energy stored in the PCM TES unit, which was considered to be useful for space heating. It was defined as the useful thermal energy stored in the PCM based on a reference enthalpy, as expressed in Eq. (5).
The reference enthalpy was assumed as the enthalpy of a PCM at 20oC.
��� � ��� � ����� (5)
2.3.Simulation design using Taguchi method
In this study, Taguchi method was used to design trial simulations based on an orthogonal array in order to obtain the maximum amount of the information on the thermal performance of the system with a minimum number of simulation exercises. Analysis of variance (ANOVA) was used to investigate the response significance of the individual factors and identify the percentage contribution of each factor to the objective function. The sum of squares of factors, the pure sum of squares of factors, the variance of factors and percentage contribution of factors were the key statistic parameters used in ANOVA [9]. Five parameters, including the PCM type, the thickness of the PCM brick, the length of the PCM TES unit, the PCM charging air flow rate, and the size of the air gap between the glass cover and the PV cell in the PVT collector were selected as the control factors for performance analysis since these variables have been reported to be critical to the performance of PVT collectors and PCM TES units [10-12]. The PCMs considered in this study were SP24E and SP26E available from Rubitherm with a melting
range of 24-25oC and 25-27oC, respectively [7]. Other control factors were designed to have three levels as
summarised in Table 1. An L18 (21×37) orthogonal array was used to design the simulation cases and the resulted
orthogonal array is shown in Table 1.
Table 1.Control factors and their corresponding factor levels.
Factor level Type of PCM Thickness of the
PCM brick (mm) Length (m) Air flow rate (kg/h) Size of the air gap (mm)
1 SP24E 10 3.0 1000 5
2 SP26E 20 4.5 1500 12
3 30 6.0 2000 20
3.Results and discussions
3.1.Setup the tests
The thermal performance of the proposed system was evaluated under Melbourne winter weather conditions. The useful energy stored during the daytime was used as the objective response for performance evaluation.
The PVT collectors were assumed to be installed on a Solar Decathlon house [4] with an installation area of 4 m
(L)×10 m (W). The configuration of the PCM TES unit used was similar to that of Charvát et al. [10]. The storage
capacity of the TES unit was determined based on two days of the heating demand of the house [3] and therefore the same amount of the PCM was used when varying the thickness of the PCM brick and the length of the TES
unit. The size of the air channels was determined based on the recommendations from Dolado et al. [11]. The
number of the air channels was therefore determined based on the given thickness of the PCM brick and the length
of the TES unit. The specifications of the PVT collector and the PCM TES unit are summarised in Table 2. As the solar radiation may not be strong during the early morning and late afternoon in winter, it was assumed that the PCM TES unit was charged using the thermal energy collected by the PVT from 9:00 to 16:00. During this period, if the temperature of the outlet air from the PVT collectors was lower than the equivalent temperature of the PCM TES unit, the charging process will be suspended and it will be restarted once the outlet air temperature from the PVT collectors was high enough. The discharging process was assumed to be from 16.00 to 9:00 of next day. It is noted that the equivalent temperature of the PCM TES unit was obtained according to the average enthalpy of the PCM TES unit which was the average enthalpy of all PCM nodes in the TES unit. The inlet air temperature of the
PCM TES unit during the discharging process was assumed as 20oC in this study by assuming that the return air
[image:6.544.58.486.357.445.2]from the indoor space can be used for thermal discharge. The simulations were carried out for three days and the results of the last day were presented to demonstrate the performance of the proposed integrated system. Fig. 4 shows the ambient air temperature and the total horizontal solar radiation (Gt) of the selected last day.
Fig. 4. Weather data used for performance evaluation.
Table 2. Specifications of the PVT collectors and the PCM TES unit.
PVT collector PCM TES unit
Total length (m) 4 Length (m) 3/4.5/6
Total width (m) 10 Width (m) 0.44
Slope (degree) 18.4 Dimension of PCM brick (mm) Length: 450mm; width:300mm;
thickness: 10/20/30
Number of fins 65 Size of the air channels (mm) 10
Size of the air gap (mm) 5/12/20 Rugosity of PCM brick (mm) 0.25
Air flow rate (kg/h) 1000/1500/2000 PCM type SP24E/SP26E
Number of PCM bricks 200
3.2.Results of model validation
To validate the model of the PCM TES unit developed, the experimental data reported by Lopez et al. [13] was
used and the results are presented in Fig. 5. The model developed was modified in order to have the same
configuration as that of the experimental setup used by Lopez et al. [13] through reducing the number of the air
[image:6.544.98.454.564.662.2]channels to two and assuming that the external surface of the TES unit was well-insulated. It can be seen that the simulated outlet air temperature from the PCM TES under both charging and discharging processes matched well with that of the experimental data, indicating that the model developed can provide an acceptable estimation.
Fig. 5. Model validation (a) charging process, (b) discharging process.
0 1 2 3 4 5 6 7 8 9 10 11
0 5 10 15 20 25 30 35 40
Time / h
Te
m
perat
ure
/
C
Tair,in Tair,out , experiment
Tair,out , modelling
0 1 2 3 4 5 6 7 8 9 10 11
0 5 10 15 20 25 30 35 40
Time / h
Te
m
perat
ure
/
C
Tair,in Tair,out , experiment
Tair,out , modelling
(a)
124 Ren et al. / Energy Procedia 00 (2017) 000–000 Haoshan Ren et al. / Energy Procedia 121 (2017) 118–125 7
[image:7.544.58.485.190.378.2]3.3.Results of thermal performance evaluation
Table 3 summarises the Taguchi experiments and the corresponding results of each trial test. The results of ANOVA are presented in Table 4. It can be found that the air flow rate in the charging process was ranked as the most significant factor with a percentage contribution of 69.77% (Table 4), and the PCM type was the second significant factor (20.93%). The other factors such as the thickness of the PCM brick, the length of the PCM TES unit, and the size of the air gap were found insignificant, which indicated that the change of these three factors has a limited impact on the useful energy stored in the PCM TES unit under the test range studied.
Table 3. Results of the trial tests. Test
No. Type of the PCM used PCM brick (mm) Thickness of the Length of the TES unit (m) PCM charging air flow rate (kg/h) Size of the air gap (mm) Useful energy stored (kWh)
1 SP24E 10 3.0 1000 5 23.527
2 SP24E 10 4.5 1500 12 33.932
3 SP24E 10 6.0 2000 20 30.845
4 SP24E 20 3.0 1000 12 18.619
5 SP24E 20 4.5 1500 20 33.890
6 SP24E 20 6.0 2000 5 27.047
7 SP24E 30 3.0 1500 5 31.466
8 SP24E 30 4.5 2000 12 31.436
9 SP24E 30 6.0 1000 20 19.467
10 SP26E 10 3.0 2000 20 22.246
11 SP26E 10 4.5 1000 5 13.625
12 SP26E 10 6.0 1500 12 29.645
13 SP26E 20 3.0 1500 20 27.456
14 SP26E 20 4.5 2000 5 21.583
15 SP26E 20 6.0 1000 12 17.113
16 SP26E 30 3.0 2000 12 23.956
17 SP26E 30 4.5 1000 20 16.926
18 SP26E 30 6.0 1500 5 26.988
Table 4. Analysis of variance table.
Control factors Degree of
freedom Sum of squares Variance Variance ratio Pure sum of squares contribution Percentage
Type of the PCM used 1 142.759 142.759 34.891 138.667 20.93%
Thickness of PCM brick 2 5.509 2.754 0.673 -2.674 -0.40%
Length of the TES unit 2 1.765 0.883 0.216 -6.418 -0.97%
PCM charging air flow rate 2 470.498 235.249 57.496 462.315 69.77%
Size of the air gap 2 9.332 4.666 1.140 1.148 0.17%
All other/error 8 32.733 4.092 1.000 69.557 10.50%
Total 17 662.595 38.976 100.00%
From Table 3, it can be observed that a higher useful energy stored in the TES system (i.e. higher than 30 kWh) was obtained in the trial tests 2, 3, 5, 7, and 8 when the PCM SP24E was used, and a higher useful energy stored in the TES system was also achieved when the charging air flow rate was 1500 kg/h (i.e. trial tests 2, 5, and 7). From the above results, it seems that the PCM type of SP24E and the air flow rate of 1500 kg/h were the best levels considered in this study.
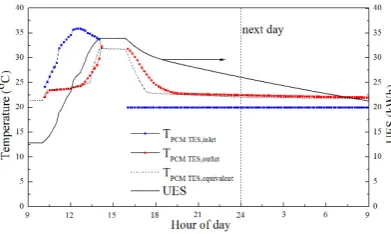
Among all trial simulations, the highest useful energy stored in the TES system was achieved under the test condition specified in the trail test 2. The inlet and outlet air temperatures of the PCM TES unit, the equivalent temperature of the PCM TES unit, and the accumulated useful energy stored in this test case are presented in Fig. 6. It can be observed that the charging process started at around 10:00 and stopped at around 14:10 in the test day as the outlet air temperature of the PVT collectors (i.e. the inlet air temperature of the TES unit) was lower than the equivalent temperature of the PCM TES unit from 9:00 to 10:00 and from 14:10 to 16:00. It is noted that the inlet and outlet air temperatures of the PCM TES unit during the time periods of 9:00-10:00 and 14:10-16:00 were not illustrated as there was no thermal energy was charged into the TES unit. During the discharge process, the outlet air temperature and the equivalent temperature of the PCM TES unit first dropped rapidly due to the sensible heat release and then dropped very slowly due to the phase change of the PCM. In this test day, the outlet air
8 Ren et al. / Energy Procedia 00 (2017) 000–000
temperature of the PCM TES unit remained at least 2.0oC higher than the inlet air temperature of 20oC during the
whole discharge process.
The above results showed that the performance of the TES unit is highly influenced by the key design variables and these key design variables should be selected carefully in order to satisfy the specific requirements of a particular application such as the storage capacity and the heat charging/discharging rate.
Fig. 6. Results of the trial test 2.
4.Conclusions
This paper investigated the performance evaluation of an integrated PVT-PCM TES system using Taguchi method. A performance indicator, named as the useful energy stored in the PCM TES unit, was used as the objective response for Taguchi experiments. Five factors, including the PCM type, the thickness of the PCM brick in the TES unit, the length of the PCM TES unit, the PCM charge air flow rate, and the size of the air gap between the glass cover and the PV cell of the PVT collector, were considered as the control factors. The results showed that the PCM type and the PCM charging air flow rate are the significant factors that influence the useful energy stored in the PCM TES unit. Among the test ranges defined and the PCM types considered, the PCM SP24E and the charging air flow rate of 1500kg/h could provide a better indoor thermal performance in terms of the useful energy stored. The results from this study can be used to facilitate the design of the PVT-PCM integrated systems.
References
[1] U.S. Energy Information Administration, http://www.eia.gov/consumption/ (accessed 26.10.2016).
[2] Malvi CS, Dixon-Hardy DW, Crook R. Energy balance model of combined photovoltaic solar-thermal system incorporating phase change material. Solar Energy. 2011;85(7):1440-6.
[3] Fiorentini M, Cooper P, Ma Z. Development and optimization of an innovative HVAC system with integrated PVT and PCM thermal storage for a net-zero energy retrofitted house. Energy and Buildings. 2015;94:21-32.
[4] Lin W, Ma Z, Sohel MI, Cooper P. Development and evaluation of a ceiling ventilation system enhanced by solar photovoltaic thermal collectors and phase change materials. Energy conversion and management. 2014;88:218-30.
[5] Lin W, Ma Z, Cooper P, Sohel MI, Yang L. Thermal performance investigation and optimization of buildings with integrated phase change materials and solar photovoltaic thermal collectors. Energy and Buildings. 2016;116:562-73.
[6] Al Imam MF, Beg RA, Rahman MS, Khan MZ. Performance of PVT solar collector with compound parabolic concentrator and phase change materials. Energy and Buildings. 2016;113:139-44.
[7] Rubitherma PCMs, www.rubitherm.com (accessed 26.10.2016).
[8] Fan W, Kokogiannakis G, Ma Z, Cooper P. Development of a dynamic model for a hybrid photovoltaic thermal collector–Solar air heater with fins. Renewable Energy. 2017;101:816-34.
[9] Roy RK. A primer on the Taguchi method. 2nd ed. Michigan: Society of Manufacturing Engineers; 2010.
[10] Charvát P, Klimeš L, Ostrý M. Numerical and experimental investigation of a PCM-based thermal storage unit for solar air systems. Energy and Buildings. 2014 ;68:488-97.
[11] Dolado P, Lazaro A, Marin JM, Zalba B. Characterization of melting and solidification in a real scale PCM-air heat exchanger: Numerical model and experimental validation. Energy Conversion and Management. 2011;52(4):1890-907.
[12] Duffie JA, Beckman WA. Solar engineering of thermal processes. 4th ed. New York: Wiley; 2013.
[image:7.544.72.468.401.485.2]3.3.Results of thermal performance evaluation
Table 3 summarises the Taguchi experiments and the corresponding results of each trial test. The results of ANOVA are presented in Table 4. It can be found that the air flow rate in the charging process was ranked as the most significant factor with a percentage contribution of 69.77% (Table 4), and the PCM type was the second significant factor (20.93%). The other factors such as the thickness of the PCM brick, the length of the PCM TES unit, and the size of the air gap were found insignificant, which indicated that the change of these three factors has a limited impact on the useful energy stored in the PCM TES unit under the test range studied.
Table 3. Results of the trial tests. Test
No. Type of the PCM used PCM brick (mm) Thickness of the Length of the TES unit (m) PCM charging air flow rate (kg/h) Size of the air gap (mm) Useful energy stored (kWh)
1 SP24E 10 3.0 1000 5 23.527
2 SP24E 10 4.5 1500 12 33.932
3 SP24E 10 6.0 2000 20 30.845
4 SP24E 20 3.0 1000 12 18.619
5 SP24E 20 4.5 1500 20 33.890
6 SP24E 20 6.0 2000 5 27.047
7 SP24E 30 3.0 1500 5 31.466
8 SP24E 30 4.5 2000 12 31.436
9 SP24E 30 6.0 1000 20 19.467
10 SP26E 10 3.0 2000 20 22.246
11 SP26E 10 4.5 1000 5 13.625
12 SP26E 10 6.0 1500 12 29.645
13 SP26E 20 3.0 1500 20 27.456
14 SP26E 20 4.5 2000 5 21.583
15 SP26E 20 6.0 1000 12 17.113
16 SP26E 30 3.0 2000 12 23.956
17 SP26E 30 4.5 1000 20 16.926
18 SP26E 30 6.0 1500 5 26.988
Table 4. Analysis of variance table.
Control factors Degree of
freedom squares Sum of Variance Variance ratio Pure sum of squares contribution Percentage
Type of the PCM used 1 142.759 142.759 34.891 138.667 20.93%
Thickness of PCM brick 2 5.509 2.754 0.673 -2.674 -0.40%
Length of the TES unit 2 1.765 0.883 0.216 -6.418 -0.97%
PCM charging air flow rate 2 470.498 235.249 57.496 462.315 69.77%
Size of the air gap 2 9.332 4.666 1.140 1.148 0.17%
All other/error 8 32.733 4.092 1.000 69.557 10.50%
Total 17 662.595 38.976 100.00%
From Table 3, it can be observed that a higher useful energy stored in the TES system (i.e. higher than 30 kWh) was obtained in the trial tests 2, 3, 5, 7, and 8 when the PCM SP24E was used, and a higher useful energy stored in the TES system was also achieved when the charging air flow rate was 1500 kg/h (i.e. trial tests 2, 5, and 7). From the above results, it seems that the PCM type of SP24E and the air flow rate of 1500 kg/h were the best levels considered in this study.
Among all trial simulations, the highest useful energy stored in the TES system was achieved under the test condition specified in the trail test 2. The inlet and outlet air temperatures of the PCM TES unit, the equivalent temperature of the PCM TES unit, and the accumulated useful energy stored in this test case are presented in Fig. 6. It can be observed that the charging process started at around 10:00 and stopped at around 14:10 in the test day as the outlet air temperature of the PVT collectors (i.e. the inlet air temperature of the TES unit) was lower than the equivalent temperature of the PCM TES unit from 9:00 to 10:00 and from 14:10 to 16:00. It is noted that the inlet and outlet air temperatures of the PCM TES unit during the time periods of 9:00-10:00 and 14:10-16:00 were not illustrated as there was no thermal energy was charged into the TES unit. During the discharge process, the outlet air temperature and the equivalent temperature of the PCM TES unit first dropped rapidly due to the sensible heat release and then dropped very slowly due to the phase change of the PCM. In this test day, the outlet air
temperature of the PCM TES unit remained at least 2.0oC higher than the inlet air temperature of 20oC during the
whole discharge process.
[image:8.544.171.367.143.260.2]The above results showed that the performance of the TES unit is highly influenced by the key design variables and these key design variables should be selected carefully in order to satisfy the specific requirements of a particular application such as the storage capacity and the heat charging/discharging rate.
Fig. 6. Results of the trial test 2.
4.Conclusions
This paper investigated the performance evaluation of an integrated PVT-PCM TES system using Taguchi method. A performance indicator, named as the useful energy stored in the PCM TES unit, was used as the objective response for Taguchi experiments. Five factors, including the PCM type, the thickness of the PCM brick in the TES unit, the length of the PCM TES unit, the PCM charge air flow rate, and the size of the air gap between the glass cover and the PV cell of the PVT collector, were considered as the control factors. The results showed that the PCM type and the PCM charging air flow rate are the significant factors that influence the useful energy stored in the PCM TES unit. Among the test ranges defined and the PCM types considered, the PCM SP24E and the charging air flow rate of 1500kg/h could provide a better indoor thermal performance in terms of the useful energy stored. The results from this study can be used to facilitate the design of the PVT-PCM integrated systems.
References
[1] U.S. Energy Information Administration, http://www.eia.gov/consumption/ (accessed 26.10.2016).
[2] Malvi CS, Dixon-Hardy DW, Crook R. Energy balance model of combined photovoltaic solar-thermal system incorporating phase change material. Solar Energy. 2011;85(7):1440-6.
[3] Fiorentini M, Cooper P, Ma Z. Development and optimization of an innovative HVAC system with integrated PVT and PCM thermal storage for a net-zero energy retrofitted house. Energy and Buildings. 2015;94:21-32.
[4] Lin W, Ma Z, Sohel MI, Cooper P. Development and evaluation of a ceiling ventilation system enhanced by solar photovoltaic thermal collectors and phase change materials. Energy conversion and management. 2014;88:218-30.
[5] Lin W, Ma Z, Cooper P, Sohel MI, Yang L. Thermal performance investigation and optimization of buildings with integrated phase change materials and solar photovoltaic thermal collectors. Energy and Buildings. 2016;116:562-73.
[6] Al Imam MF, Beg RA, Rahman MS, Khan MZ. Performance of PVT solar collector with compound parabolic concentrator and phase change materials. Energy and Buildings. 2016;113:139-44.
[7] Rubitherma PCMs, www.rubitherm.com (accessed 26.10.2016).
[8] Fan W, Kokogiannakis G, Ma Z, Cooper P. Development of a dynamic model for a hybrid photovoltaic thermal collector–Solar air heater with fins. Renewable Energy. 2017;101:816-34.
[9] Roy RK. A primer on the Taguchi method. 2nd ed. Michigan: Society of Manufacturing Engineers; 2010.
[10] Charvát P, Klimeš L, Ostrý M. Numerical and experimental investigation of a PCM-based thermal storage unit for solar air systems. Energy and Buildings. 2014 ;68:488-97.
[11] Dolado P, Lazaro A, Marin JM, Zalba B. Characterization of melting and solidification in a real scale PCM-air heat exchanger: Numerical model and experimental validation. Energy Conversion and Management. 2011;52(4):1890-907.
[12] Duffie JA, Beckman WA. Solar engineering of thermal processes. 4th ed. New York: Wiley; 2013.
![Fig. 1. (a) Schematic of the integrated PVT-PCM TES system and; (b) PCM brick considered in this study [7]](https://thumb-us.123doks.com/thumbv2/123dok_us/8400202.325479/3.544.104.410.312.406/fig-schematic-integrated-pvt-pcm-brick-considered-study.webp)