The impact of 170 years of flow regulation
on processes and patterns in an eastern
Tasmanian river system
Anne Watson B.Sc. (Hons)
A thesis submitted in fulfilment of the requirements for the
degree of Doctor of Philosophy
School of Zoology
University of Tasmania
Sandy Bay, Tasmania
“No river can be more dangerous and uncertain than the Macquarie – in winter an impetuous torrent; in summer a mere chain of occasional stagnant ponds; and yet, in all probability, this stream …should impart life and vigour to one of the finest
districts in the island, and will be made available for so desirable a purpose” (D. Burn, 1840)
Permanent pool on the Macquarie River,
with Tooms River entering on the right, above the gravel bar.
i
Declaration of Originality
This thesis contains no material which has been accepted for a degree or diploma by this University or any other institution, except by way of background information and duly acknowledged in the thesis. To the best of my knowledge and belief no material has been previously published or written by another person except where due
acknowledgement is made in the text of the thesis, nor does the thesis contain any material that infringes copyright.
Anne Watson 31 October 2011
Authority of Access
This thesis may be made available for loan and limited copying and communication in accordance with the Copyright Act 1968.
Anne Watson 31 October 2011
Statement regarding published work contained in this thesis
The publishers of the papers comprising Chapter 6 hold the copyright for that content, and access to the material should be sought from the respective journals. The remaining non-published content of the thesis may be made available for loan and limited copying and communication in accordance with the Copyright Act 1968.ii
Statement of Co-Authorship
Publications produced as part of this thesis:
Chapter 6.1: Watson, A. and Barmuta, L.A. (in review) Stable isotope analyses demonstrate that long-term river regulation results in unexpected shifts in food webs, Freshwater Biology.
Chapter 6.2: Watson, A. and Barmuta, L.A. (2011) Feeding preference trials confirm unexpected stable isotope results: freshwater
macroinvertebrates do consume macrophytes, Marine and Freshwater Research 62: 1248-1257.
The following individual and institutions contributed to the publication of research undertaken as part of this thesis:
Associate Professor Leon. A. Barmuta (University of Tasmania and Tasmanian Aquaculture and Fisheries Institute) assisted with guidance and supervision of all aspects of the Ph.D. and in producing publishable manuscripts.
The undersigned agrees with the above stated proportion of work
undertaken for each of the above submitted peer-reviewed manuscripts contributing to this thesis:
iii
Abstract
The flow regime of Tooms River, a tributary of the unregulated Macquarie River in eastern Tasmania, was modified in 1840 by a shallow dam in its upper reaches, resulting in reversed seasonality of high and low flows: a classic, long-term example of a river subjected to “anti-drought”, but without the confounding thermal effects of impoundment stratification. I found surprisingly large differences between sites on this regulated
branch and sites on the adjacent unregulated branch of the Macquarie, which persisted for 8 km downstream despite tributary inflows. This 2-year comparative study coincided with a prolonged supra-seasonal
drought, which enabled examination of the effects of reduced stream flow on both regulated and unregulated examples of confined rivers in a
naturally variable climatic regime. The regulated sites remained distinct from the unregulated sites, in terms of riparian litter fall, biofilm
abundance and macro-invertebrate diversity.
This is one of very few studies of the long-term effects of flow regulation (e.g. see Kondolf and Batalla 2005; Sheldon and Thoms 2006b), and differs from the majority of regulated river studies in that the effects of regulation of Tooms River are not confounded by land use practises or thermal stratification of the reservoir. However, this impoundment is typical of small irrigation impoundments in Mediterranean and semi-arid climate zones. The ecological consequences of drought and
“anti-drought” in a region with a naturally variable flow regime may inform management of biodiversity in other regulated rivers in similar climate zones. Human population increases and climate change pressure on water supplies are likely to increase the demand for many more dams of this size and type of flow alteration (Benstead et al. 1999). The
determination of the long-term effects of flow regulation is essential, so that future decisions on water allocations can be based on better
Abstract
iv
Prolonged regulation of the flow regime of Tooms River has had major effects. Regulation has not only reversed the seasonality of flow, but has also dramatically reduced flow variability, resulting in contraction of the stream channel immediately downstream of the dam, and the
establishment of mature eucalypts close to the channel, in contrast to the shrubby riparian vegetation maintained by the variable flow regime of the Macquarie River. The timing of allochthonous litter inputs to the benthos was altered, with peak litterfall delayed until irrigation demand fell at the end of summer. In addition, there was reduced lateral
connectivity, with movement of leaf litter between the riparian zone and the benthos dependent on overland flow. As predicted by other studies, biofilms were more abundant in the regulated river, but the closed canopy immediately downstream of the dam did not suppress autochthonous productivity, against expectations. Chlorophyll a
analyses indicated an autotrophic system, dominated by cyanobacteria and diatoms, in contrast to filamentous algae and diatoms in the
unregulated river.
Macroinvertebrate communities were significantly different between rivers, but also between sites within rivers, with a depauperate fauna closest to the dam. There was partial recovery of regulation effects at the downstream regulated site, but the invertebrate fauna remained distinct to the unregulated river. In contrast to the majority of studies, there was little difference in invertebrate species richness or evenness between sites or rivers, but diversity was marginally higher at the unregulated sites. Invertebrates from the adjacent Macquarie River were expected to colonise lentic habitats in the regulated river during the drought, but this did not eventuate, suggesting that there may be significant barriers to dispersal or colonisation.
Abstract
v
rivers. Vascular macrophytes dominated unregulated river diets, while cyanobacteria were more important in the regulated river. Feeding preference trials for the dominant terrestrial leaf species and for
macrophytes showed few preferences for terrestrial leaves, despite large differences in toughness, C: N ratios and tannin content. Unlike other Australian and overseas studies, most invertebrates showed a clear preference for the macrophyte Triglochin procerum. This was supported by the stable isotope analyses and suggests that the prevalence of macrophytes in invertebrate diets may be underestimated in many food web studies.
vi
Acknowledgements
This thesis began as a simple project, and evolved into a monster which has dominated my life and that of my family and friends for far too long. Firstly, special thanks to my partner, Kerry, for his constant love and enthusiasm, for many days of field assistance, and for financial support when my scholarship ran out. Secondly, thanks to my supervisor and mentor, Assoc. Professor Leon Barmuta, who was always encouraging, even when I ignored his excellent advice to avoid working with
macroinvertebrates. He showed amazing dexterity with R, and could always find something interesting to examine at a field site, however bad the weather. Dr Alastair Richardson gave feedback on several chapter drafts, while Dr Jenny Davis gave invaluable advice while Leon was on leave in 2007.
Very special thanks to the staff of the Tasmanian Department of Primary Industries, Parks, Water and Environment. Danielle Warfe sourced the major project funding via the TEFlows project, which was supported by NRM North and NRM South under the National Action Plan for Salinity and Water Quality (Project number NAP08). Adam Uytendaal provided support and advice after Danielle moved to a wetter and warmer climate, and also attracted the leeches away from myself and Mike Male over the 4 long days it took to survey the river channels. Scott Hardie took over when Adam moved to an island without leeches. Shivaraj Gurung modelled the hydrology for the ungauged Macquarie River sites. Kathryn Jerie suggested the Tooms River - Macquarie River comparison, which gave this project a strong focus when the drought intervened in the original flood study, while Lois Koehnken helped interpret the mysteries of geomorphology.
Contents
vii
expensive stable isotope and nutrient analyses. Hickman Holloway Constructions donated the Astroturf for the litter fall study and the Watson family (unrelated) kindly allowed me unrestricted access to Tooms River across their property, Blanket Bottom. The School of Zoology and Australian Society for Limnology subsidised my 2007
presentation to the Limnology Conference in Queenstown, New Zealand. Professor B.F.J. Manly made his software available for computing the selectivity index for the feeding preference trial and Hugh Fitzgerald, of the School of Plant Science, conducted the tannin assays.
The field component of this project would have been impossible without assistance from family, friends and student volunteers. Thank you to Ashley Edwards for organising the student volunteer programme, and (in alphabetic order) to Jarrod Adcock, Kaylene Allan, Phil Bonney, Simon Brain, Ryan Burrows, David Carpenter, Lisa Cawthen, Simon Curtis, Danait Ghebrezgabhier, Tom Jackson, Emma Kingston, Mike Male, Raphaela Matuszek, Raylea Parr, Sarah Pyke, Hayley Ricardo, Jacqui Shelton, Christiane Smethurst, Adam Uytendaal and Karen, Kerry, Michelle, and Tim Watson, who all helped with field work,
sometimes in trying conditions and always with 4½ long hours of travel time. Michelle also corrected many ambiguities in this thesis and gave invaluable editorial advice on chapter and paper drafts.
Thanks also to fellow postgrads, honours students and researchers, for making the long days at the microscope or computer go faster,
8
Contents
Declarations...i
Declaration of Originality...i
Authority of Access...i
Statement regarding published work contained in this thesis...i
Statement of Co-Authorship...ii
Abstract...iii
Acknowledgements...vii
Chapter 1 General introduction...1
1.1 Ecological background...1
1.2 General effects of river regulation...4
1.3 Aims and scope of this thesis...11
1.4 Thesis structure...14
Chapter 2 The influence of river hydrology on channel morphology and site characteristics...17
2.1 Abstract...17
2.2 Introduction...17
2.3 Study design...18
2.4 Study sites...19
2.5 Catchment climate...22
2.6 Hydrology...25
2.6.1 Methods...25
2.6.2 Results...27
2.6.3 Discussion...30
2.7 Hydraulic modelling...31
Contents
2.7.2 Tooms River sites...33
2.8 Vegetation and site descriptions...33
2.8.1 Macquarie River sites...35
2.8.2 Tooms River sites...40
2.9 Context of this study...46
Chapter 3 Riparian vegetation dynamics in response to flow regulation...47
3.1 Abstract...47
3.2 Introduction...47
3.3 Methods...52
3.3.1 Study area riparian vegetation...52
3.3.2 Riparian litter fall...55
3.3.3 Terrestrial cellulose decomposition...60
3.3.4 Soil characteristics...63
3.4 Results...63
3.4.1 Initial standing stock of leaf litter...63
3.4.2 Riparian litter fall...66
3.4.3 Cellulose decomposition potential...73
3.4.4 Canopy cover...75
3.4.5 Soil characteristics...75
3.5 Discussion...76
3.6 Conclusion...82
Chapter 4 Benthic resource dynamics in response to flow regulation...85
4.1 Abstract...85
4.2 Introduction...85
4.2.1 Autochthonous resources...86
Contents
4.3 Methods...91
4.3.1 Autochthonous resources...91
4.3.2 Vascular macrophytes...95
4.3.3 Suspended organic material...95
4.3.4 Dissolved nutrients...95
4.3.5 Allochthonous resources...96
4.3.6 Statistical methods for the survey data...98
4.4 Results...100
4.4.1 Autochthonous resources...100
4.4.2 Vascular macrophytes...107
4.4.3 Total suspended solids...110
4.4.4 Nutrient concentrations...110
4.4.5 Allochthonous resources...111
4.5 Discussion...125
4.5.1 Autochthonous resources...126
4.5.2 Allochthonous resources...130
4.6 Conclusion...134
Chapter 5 Macroinvertebrate community responses to flow regulation and drought...139
5.1 Abstract...139
5.2 Introduction...139
5.2.1 The effects of flow regulation on aquatic invertebrates...140
5.2.2 The effects of drought on aquatic invertebrates...143
5.2.3 Aims of this study...148
5.3 Methods...149
5.3.1 Field protocol...149
Contents
5.4 Results...154
5.4.1 Univariate measures...156
5.4.2 Multivariate measures...158
5.4.3 Ephemeroptera-Plecoptera-Trichoptera (EPT) taxa abundance...166
5.4.4 Functional feeding group abundance...169
5.5 Discussion...169
5.5.1 Regulation effects on faunal communities...171
5.5.2 Recovery of faunal communities with distance from the dam...173
5.5.3 Faunal differences between the Macquarie sites...174
5.5.4 The temporal changes due to drought in the unregulated Macquarie River...176
5.5.5 The temporal changes due to drought in the regulated Tooms River...176
5.5.6 Limitations of assessing regulation effects from invertebrate community composition...177
5.6 Conclusion...178
Appendix i: Macroinvertebrate indicator taxa for each study site....181
Chapter 6 The importance of allochthonous and autochthonous resources to the macroinvertebrate food webs...183
6.1 Stable isotope analysis of riverine food webs...183
6.1.1 Abstract...185
6.1.2 Introduction...186
6.1.3 Methods...188
6.1.4 Results...194
6.1.5 Discussion...205
6.2 Macroinvertebrate feeding preferences...211
Contents
6.2.2 Introduction...212
6.2.3 Methods...214
6.2.3.1 Stable isotope analyses...215
6.2.3.2 Feeding preference trials...217
6.2.4 Results...223
6.2.4.1 Stable isotope analyses...223
6.2.4.2 Feeding preference trials...223
6.2.5 Discussion...228
Chapter 7 General discussion...235
7.1 The impact of flow regulation on Tooms River...235
7.2 Assessing the impact of flow regulation on invertebrate diversity...242
7.3 Management of anti-drought in regulated rivers...243
7.4 Management to optimise ecosystem services...244
Bibliography...245
Appendix 1: Standing stock of riparian leaf litter SIMPER analyses by site...282
Appendix 2: Riparian leaf mass SIMPER analysis by site and collection round...284
Appendix 3: Taxonomic references...290
Appendix 4: Invertebrate total abundances, functional feeding groups and flow preferences by site...294
1
Chapter 1 General introduction
Climate change is predicted to increase the frequency and severity of
both droughts and floods in eastern Australia (Grose et al. 2010). While
higher rainfall is predicted for eastern Tasmania, the increase in air
temperature due to the more southerly migration of the East Australia
Current is likely to increase evaporation rates, leading to a decrease in
annual runoff into rivers and increased flash flooding with greater soil
hydrophobicity. At the same time, community pressure has increased
to build more dams, chiefly for agricultural irrigation. As elsewhere,
climate change is being used as a further justification for more, often
smaller impoundments to either mitigate or take advantage of
opportunities presented by climate change (e.g.
http://www.tidb.com.au/). However Graf (1999), among others,
suggests that climate change is likely to have less impact on riverine
ecosystems than has already occurred as a result of flow regulation,
which prompted this investigation of the impacts of a smaller
impoundment on a Tasmanian river, which has regulated flow for
irrigation for over 170 years. The size of this impoundment and type of
flow alteration is likely to typify dozens of other proposals in similar
climate zones around the world (cf. Benstead et al. 1999).
1.1 Ecological background
Climate and geology are the major drivers of the physical components of
riverine ecosystems (Poff and Hart 2002), with the interaction between
these factors controlling water movement, soil formation and riparian
vegetation growth (Petts 1984). Within this context, the flow regime is
the fundamental force controlling the river channel, substrate and
sediment transport (Graf 1988), which in turn influence riparian
communities (Junk et al. 1989) and aquatic biota (Ward 1992).
Although there is unidirectional longitudinal flow within a river, there is
General introduction
2
area, as well as vertical connectivity with the hyporheos, groundwater
and atmosphere, with the strength of these connections varying along a
river’s length (Ward and Stanford 1983b; Ward 1989; Stanford and
Ward 1993; Walker et al. 1995; Ward and Stanford 1995a) (Fig. 1.1).
Loss of this connectivity influences organic material pathways, nutrient
flows, and aquatic animal food resources and migration (Bunn and
[image:16.595.133.467.240.494.2]Arthington 2002).
Fig. 1.1 Characteristics of river channels and riparian zones for 3 contrasting river reaches (Ward and Stanford 1995b). The strength of connections
between longitudinal (horizontal arrows), vertical and riparian (oblique arrows) zones in each reach type are indicated by the size of the arrows.
The riparian zone is the interface between the stream channel and the
surrounding landscape (Gregory et al. 1991), an ecotone with
characteristics of both environments (Nilsson and Svedmark 2002).
Here, “riparian vegetation” refers to the plant community which is
susceptible to changes in the water table or overbank flows (Naiman
and Décamps 1997) in response to fluvial and geomorphic processes
(Merritt et al. 2010). It includes vegetation which either shades at least
General introduction
3
1991). The flow regime strongly influences the establishment and
growth of riparian vegetation (Hupp and Osterkamp 1996; Nilsson and
Svedmark 2002), by controlling soil moisture gradients and
biochemistry, which impact on physical attributes and species
composition of the plant community (Merritt et al. 2010).
The riparian zone can have a major influence on the balance between
allochthonous and autochthonous resources in the stream, and hence
the biota dependent on those resources (Fisher and Likens 1973;
Cummins 1979; Vannote et al. 1980; Cummins et al. 1984; Junk et al.
1989). This transfer of nutrients and biota between the riparian zone
and the stream is recognised as an important energy pathway (Vannote
et al. 1980; Junk et al. 1989; Thorp and Delong 1994). In confined
rivers with forested catchments, control of light and shade by the
riparian canopy affects in-stream productivity (Bunn et al. 1999) and
the production and movement of nutrients (Pusey and Arthington
2003), and may be the major influence on aquatic communities (Bis et
al. 2000).
Variation in the natural flow regime influences the availability of
in-stream and riparian habitats, food resources and nutrient flows, and
has a strong influence on biodiversity (Poff et al. 1997; Richter et al.
1997; Puckridge et al. 1998; Hart and Finelli 1999). In this way, flow
variability drives ecological variation (Puckridge et al. 1998; Bunn and
Arthington 2002; Junk and Wantzen 2004), with small pulses in flow
important at different habitat scales (Puckridge et al. 1998). Life history
strategies of aquatic species may have evolved in response to this
variation, with seasonal or predictable flow and temperature cueing
reproduction in many species, as well as metamorphosis and emergence
in many insects (Bunn and Arthington 2002; Humphries and Baldwin
2003). However, as Ward and Stanford (1995b) pointed out (Fig.1.1), all
these factors are influenced by the position of the study reach in the
General introduction
4
1.2 General effects of river regulation
River regulation is defined in this study as the “anthropogenic control of
flow in lotic habitats” (Stanford and Ward 1979). McMahon and
Finlayson (2003) described regulation for irrigation supply in seasonal
climates as “anti-droughts”, because the natural, seasonal low flows
and cease-to-flow events are replaced by persistent low flows. They
contend that this will have far greater impacts on ecosystem health,
diversity and community structure than droughts or floods, while
Naiman et al. (1995) nominated flow regulation as the greatest challenge
to riverine ecological sustainability.
The majority of rivers worldwide has been regulated in some form (WCD
2000; Nilsson et al. 2005), with some dams thousands of years old
(Baxter 1977). However, the worldwide boom in dam building began in
the 1930s, with demand for irrigation, water supply and increasingly,
hydro electricity production (Graf 1999). Graf (1999) estimated that
there were at least 75 000 dams in the US alone, with many more likely
to have been built since that date. Over 60% of the rivers in the
northern third of the world have some form of flow regulation (Dynesius
and Nilsson 1994). Vörösmarty et al. (1997) have calculated that 61%
of the worlds’ fresh water runoff is captured by large dams over 15 m
high. However, this does not include approximately 800 000 small
dams (WCD 2000) or the millions of farm dams (Naiman et al. 2005),
which are likely to have a significant impact on river runoff. An
irrigation dam built on the Wimmera River in Victoria in the 1850s was
the first engineered dam in mainland Australia (Ingle-Smith 1998), but
since then at least 446 large dams over 10 m high (Kingsford 2000) and
many thousands of smaller weirs have been built. This includes over
3600 locks and weirs in the Murray-Darling River system alone
General introduction
5
Many studies have examined the effects of dams on downstream
ecosystems (e.g. Nilsson et al. 1991; Kondolf 1997), but these have
largely focussed on large dams, many of which were built in the late
20th century. Similarly, Benke (1990) only considered rivers longer than
200 km in his paper, which lamented the loss of free-flowing rivers in
the USA. This focus is typical of regulation studies, which seem to
consider that only large dams on major rivers can have a strong impact
(Bergkamp et al. 2000; Nilsson et al. 2005). This is partly because the
effects of larger impoundments are more immediate and tend to be
closer to populated areas (Stromberg et al. 2007). However, the effects
of dams are often confounded by the increased agricultural, industrial
or urban development that can follow dam construction (Baxter 1977)
and this can make it difficult to untangle the effects of regulation effects
per se from the other changes in catchment land use. For example,
agriculture expanded onto the previous floodplain of an impounded
Californian river, displacing the natural riparian vegetation and
confounding regulation effects (Gordon and Meentemeyer 2006).
The international peer-reviewed literature is heavily focussed on
hydro-electric and multiple impoundments (e.g. Angradi 1994; Pomeroy et al.
2000; Vinson 2001). Within Australia, the focus has been on the large
floodplain rivers of the southeast, such as the Murray-Darling River
system (e.g. Sheldon and Walker 1997; Baldwin et al. 2009), most of
which were regulated in the late 19th- to mid- 20th century (Walker
1985). Graf (1999) suggested that many dams have not been in place
long enough for full downstream effects to emerge. There is now a focus
in the USA and Europe to remove some of the older, and typically
smallest, dams. For example, Hart et al. (2002) reviewed downstream
effects of the removal of 20 dams, ranging from 2 – 17 m high and in
age from 27 – 162 years. Although Poff and Hart (2002) suggested that
small dams may have limited ecosystem effects, Benstead et al. (1999)
General introduction
6
Benstead et al. (1999) further emphasised the lack of ecological studies
on small dams and noted that future irrigation projects in developing
countries are likely to involve small dams in more marginal climate
zones.
Dam construction has an immediate effect on river flow, initially
increasing sedimentation of the channel (Williams and Wolman 1984),
but ultimately reducing energy and material transfer from the upper to
lower reaches of the river. Subsequent changes to the channel form
and productivity gradient are a slow process which may not reach
equilibrium for up to a century (Petts 1984). The loss of sediment
behind the dam increases the kinetic energy and erosional power of the
water below the dam. These effects can be transmitted a considerable
distance downstream, and may dramatically reduce sedimentation rates
on floodplains or at the river delta (Petts 1984). Conversely, reduced
stream power can also increase sedimentation in the river, which can
smother interstitial spaces and hyporheic habitats (Kondolf 1997).
Where the channel is incised, the river can contain a greater discharge
before overbank flows occur, reducing floodplain inundation frequency
(Bergkamp et al. 2000). The degree of channel adjustment is a function
of the post-dam discharge, sediment supply and substrate size (Grant et
al. 2003). This has been estimated by Petts (1980) to extend
downstream until the impoundment comprises less than 40% of the
overall catchment. However, Gregory and Park (1974) showed that
channel contraction on the River Tone in the UK extended until the
total catchment was more than 4 times the size of the impoundment.
According to Walker (1985), any recovery from impoundment is likely to
be confounded by other anthropogenic effects.
While some impacts are common to all impoundments, other factors
depend on the size of the reservoir and the overall purpose of regulation
(Camargo and Voelz 1998) and whether the impoundment is in the
General introduction
7
2003). In contrast to flood control and hydro-electric supply dams,
irrigation dams decrease flows in winter when the reservoir is filling and
increase flows in the normal dry season (e.g. Fig. 1.2), when irrigation
demand is highest (e.g. Petts 1984; Reich et al. 2009). In this case,
floods can only occur through dam spillage when the storage is at
maximum capacity, while natural, seasonal low flows are suppressed by
water releases in summer (Petts 1984; Kondolf and Batalla 2005).
More importantly, irrigation impoundments ultimately reduce
downstream discharge, because, unlike hydro-electric supply dams,
abstracted water is not directly returned to the river (Kondolf et al.
1996; Bergkamp et al. 2000; Nilsson et al. 2005). In semi-arid areas,
drainage from irrigation can also increase salinity in downstream
[image:21.595.98.449.279.493.2]reaches (Bergkamp et al. 2000).
Fig. 1.2 Mean monthly flow (m3.sec-1) for Putah Creek, a tributary of the
Sacramento River in California, contrasting pre-impoundment discharge with flow after the 1956 construction of Monticello Dam. IR is the Impounded Runoff Index, where an IR of 1.0 indicates that water is retained for 1 year in the
General introduction
8
The high surface area to volume ratio of the reservoir results in warmer
temperatures, and subsequent thermal stratification of deep, sheltered
water bodies (Petts 1984; WCD 2000). In addition, the different
densities of water entering and stored in the reservoir can produce
density currents and chemical stratification (Petts 1984). The water
temperature below the dam depends on whether warm surface water or
cold bottom water, typical of hydro-electric storages, is released (Vinson
2001; Poff and Hart 2002).
Irrigation impoundments in Mediterranean climates typically feature a
reversed flow regime, loss of summer low flows and reduced flood
frequency. This impacts on the abundance and community structure of
the riparian vegetation (Merritt and Cooper 2000; Nilsson and Berggren
2000; Stromberg et al. 2007), algal communities (Ryder et al. 2006) and
aquatic macroinvertebrates (Boulton and Lloyd 1992), which in turn
affect nutrient cycling (Ahearn et al. 2005) and riparian seedling
recruitment (Rood and Mahoney 1990; Auble and Scott 1998).
Moreover, the lack of disturbance may be reflected in reduced
resistance and resilience of invertebrate communities to stochastic
events in regulated systems (e.g. references in Reice et al. 1990).
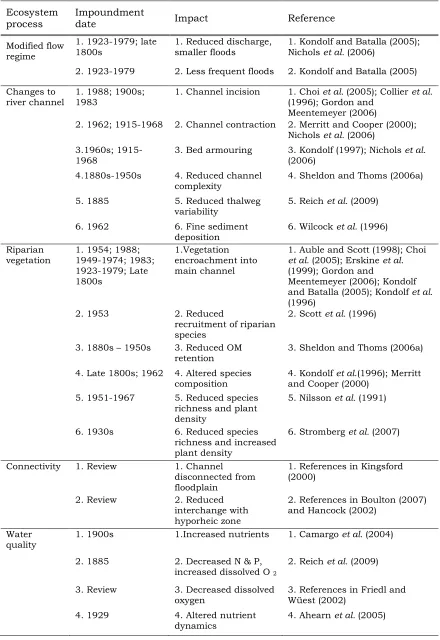
The effects of river regulation have been well documented (Table 1.1),
with an excellent early review by Petts (1984) and more recent reviews
by Bergkamp et al. (2000); Bunn and Arthington (2002); Lloyd et al.
General introduction
[image:23.595.79.519.110.750.2]9
Table 1.1 Examples of published studies of river regulation. Many impoundments impact on several ecosystem processes, with the earliest studies of dams built in the late 1800s.
Ecosystem process
Impoundment
date Impact Reference
Modified flow regime
1. 1923-1979; late 1800s
1. Reduced discharge, smaller floods
1. Kondolf and Batalla (2005); Nichols et al. (2006)
2. 1923-1979 2. Less frequent floods 2. Kondolf and Batalla (2005) Changes to
river channel
1. 1988; 1900s; 1983
1. Channel incision 1. Choi et al. (2005); Collier et al.
(1996); Gordon and Meentemeyer (2006)
2. 1962; 1915-1968 2. Channel contraction 2. Merritt and Cooper (2000); Nichols et al. (2006)
3.1960s; 1915-1968
3. Bed armouring 3. Kondolf (1997); Nichols et al.
(2006) 4.1880s-1950s 4. Reduced channel
complexity
4. Sheldon and Thoms (2006a)
5. 1885 5. Reduced thalweg variability
5. Reich et al. (2009)
6. 1962 6. Fine sediment deposition
6. Wilcock et al. (1996) Riparian
vegetation
1. 1954; 1988; 1949-1974; 1983; 1923-1979; Late 1800s 1.Vegetation encroachment into main channel
1. Auble and Scott (1998); Choi
et al. (2005); Erskine et al.
(1999); Gordon and
Meentemeyer (2006); Kondolf and Batalla (2005); Kondolf et al.
(1996) 2. 1953 2. Reduced
recruitment of riparian species
2. Scott et al. (1996)
3. 1880s – 1950s 3. Reduced OM retention
3. Sheldon and Thoms (2006a)
4. Late 1800s; 1962 4. Altered species composition
4. Kondolf et al.(1996); Merritt and Cooper (2000)
5. 1951-1967 5. Reduced species richness and plant density
5. Nilsson et al. (1991)
6. 1930s 6. Reduced species richness and increased plant density
6. Stromberg et al. (2007)
Connectivity 1. Review 1. Channel disconnected from floodplain
1. References in Kingsford (2000)
2. Review 2. Reduced interchange with hyporheic zone
2. References in Boulton (2007) and Hancock (2002)
Water quality
1. 1900s 1.Increased nutrients 1. Camargo et al. (2004)
2. 1885 2. Decreased N & P, increased dissolved O 2
2. Reich et al. (2009)
3. Review 3. Decreased dissolved oxygen
3. References in Friedl and Wüest (2002)
4. 1929 4. Altered nutrient dynamics
General introduction
10
Table 1.1 (continued) Examples of published studies of river regulation. Many impoundments impact on several ecosystem processes, with the earliest studies of dams built in the late 1800s.
Algae and biofilms
1. 1915-1968; 1920s
1.Increased algae 1. Nichols et al. (2006); Sheldon and Walker (1997)
2. 1961 2.Dense periphyton growth
2. Voelz and Ward (1989)
3. 1962 3. Reduced algal growth
3. Wootton et al. (1996) 4. 1880s – 1930s 4. Different diatom
taxa
4. Growns and Growns (2001)
Invertebrate communities
1. 1907-1974; 1953; 1966; 1970; 1963
1. Reduced diversity 1. Growns and Growns (2001); Jackson et al. (2007); Munn and Brusven (1991); Takao et al.
(2007); Vinson(2001) 2. 1907-1974;
1953; 1915 - 1968
2. Reduced EPT abundance
2. Growns and Growns (2001): Jackson et al. (2007); Marchant and Hehir (2002): Nichols et al.
(2006) 3. 1907-1974;
1966; 1915-1968
3. Increased tolerant taxa
3. Growns and Growns (2001); Marchant and Hehir (2002): Munn and Brusven (1991); Nichols et al. (2006) 4. Review; 1980;
1905-1970
4. Fewer rheophilic taxa
4. Brittain and Saltveit (1989); Pardo et al. (1989); Ward and Garcia de Jalón (1991)
The impacts of flow regulation will also depend on the amount of
associated land use change, which varies between studies and can often
produce unpredicted effects (Friedl and Wüest 2002). Therefore, it is
important to distinguish the effects of regulation from other anthropogenic
changes (Brandt 2000). A realistic appraisal can not be made of the
effectiveness of changes to management of the flow regime unless the
direct effects of flow regulation can be distinguished from the confounding
effects produced by subsequent land use changes.
As Grant et al. (2003) pointed out, there is a need for conceptual models
which organise and synthesise this knowledge. Petts (1984) went some
way towards this goal by proposing a three stage model of impoundment
impacts, based on the influence of hydrology on sediment supply,
consequent geomorphic changes, and biotic effects. Burke et al. (2009)
used a three-stage approach to assess the 1st- and 2nd-order effects of
regulated hydrology and channel hydraulics on riparian vegetation
recruitment, while Naiman et al. (2000) added biological feedback
[image:24.595.79.518.108.369.2]General introduction
11
Grant et al. (2003) approached modelling from the perspective of
geomorphology, suggesting that geology controls catchment-scale
impacts, which then influence hydrology at the basin-scale. Naiman et
al. (2005) used both the hydrological regime and position of the stream
reach in the river catchment in an attempt to model the changes to
riparian vegetation with flow regulation, while Bunn and Arthington
(2002) proposed four principles to model the effects of different flow
regimes on aquatic diversity. These concepts were combined in the
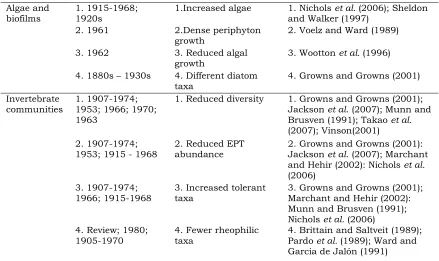
ecological limits of hydrologic alteration (ELOHA) model(Poff et al. 2010),
which uses the geomorphology and hydrology of individual streams to
[image:25.595.141.463.314.588.2]predict the effects of flow modification (Fig. 1.3).
Fig. 1.3 The ELOHA frame-work uses three steps to develop a hydrologic
framework for a river reach. Baseline conditions and predicted post-regulation alterations to the reference conditions are used to classify each stream reach and identify the alterations to the flow regime (Poff et al. 2010).
1.3 Aims and scope of this thesis
The overall aim of this thesis was to examine the long-term ecological
effects of “anti-drought” flow regulation of a river in a cool temperate
General introduction
12
and abundance of biota in a river (Hynes 1970a). Consequently, rather
than directly examining riverine fauna, the main focus of this study was
on the availability and abundance of the basal resources which ultimately
fuel the riverine food web. The macroinvertebrate community structure
and their use of resources were also examined, to further understand the
ecosystem effects of resource availability.
Lloyd et al. (2003) suggested that studies of many regulated rivers were
flawed by the lack of appropriate reference sites, or the confounding
effects of geology, reservoir stratification or land use. Smaller
impoundments have been largely ignored in the published literature (e.g.
Walker 1985; Baldwin et al. 2009) with the emphasis in reviews on recent
high-impact impoundments. However, irrigation for agriculture comprises
over 65% of water use worldwide, with over half the large dams
constructed primarily for irrigation (WCD 2000). The majority of these are
of short-term impoundments (Table 1.1), which are unlikely to predict the
effects of long-term impoundment.
This study attempts to redress some of these issues by contrasting the
regulated and unregulated branches of an eastern Tasmanian river
system, where regulation for irrigation has been in place for over 170
years. Because the availability of resources is considered a major factor
in aquatic invertebrate presence or absence (e.g.Wallace et al. 1997), and
hence the abundance of higher level predators, particular emphasis was
paid to riparian zone litter accession and benthic resources, and to the
macroinvertebrate response to availability of these resources. While the
pre-impoundment condition of the regulated Tooms River has not been
quantified due to the age of the impoundment (1840), this study is
unusual in that reference study sites were available on the adjacent,
unregulated upper Macquarie River, with the same geology, riparian
vegetation and land use, and there was little anthropogenic impact on
Tooms River beyond regulation. Moreover, Tooms Lake is shallow, so does
General introduction
13
differences which confound many regulation studies (e.g. Angradi 1994).
On this basis, the differences in ecological response measures between the
rivers can be strongly linked to modification of the flow regime.
Poff et al. (2010) considered that there was a lack of studies on the
impacts of flow regulation on riparian productivity and in-stream
retention. This thesis adds to the knowledge base, concentrating on some
of the impacts of river regulation for irrigation or water conservation, and
generally follows Petts’ (1984) proposal of successional impacts, while
integrating the appropriate aspects of the ELOHA principles. In contrast
to ELOHA, which uses recent data to predict future impacts of flow
alteration, historical flow records have been used to examine the
differences in the flow regime between the two rivers, and consider the
impact of that regime on ecosystem variables.
The original study design was event-based, with some sampling protocols
designed to cover high flow events and articulated with the TEFlows
project (DPIPWE 2010). The sampling programme was subsequently
reoriented to take advantage of the “supra-seasonal drought” (Lake 2003)
which coincided with the 3 years of fieldwork in this study. This provided
an unique opportunity to examine whether any differences between the
Macquarie and Tooms Rivers diminished under the influence of low flows
in each river, particularly as higher irrigation demands are likely to
exacerbate future low flows.
The unusually low flows in Tooms River were expected to influence algae
and biofilms abundance, and potentially impact on litter accession to the
benthos, with reduced connectivity between the riparian zone and wetted
channel. As a result, it was hypothesised that there would be a
convergence of aquatic biota towards a common species assemblage, more
General introduction
14
1.4 Thesis structure
Chapter 2 describes the climate and hydrology of the two rivers
(frequency, magnitude and seasonality of flow events) and the
second-order impacts (Petts 1984) of the modified flow regime on channel
geomorphology and the riparian vegetation at each study site. Chapter 3
explores the influence of the riparian vegetation on riparian litter
dynamics at each site. Artificial turf mats were used to monitor patterns
of riparian litter over 2 years, while cellulose decomposition potential
assessed the influence of decomposition on litter accumulation.
Chapter 4 examines the influence of the riparian vegetation structure on
allochthonous and autochthonous benthic resources, which was tested
with a quarterly monitoring programme at each study site, laboratory
trials of leaf buoyancy and a field study of cellulose decomposition.
Because water quality differed between the rivers, suspended sediments
and nutrients were examined to support interpretation of the differences
between the regulated and unregulated rivers.
The third-order impact of flow regulation and the additional impact of the
drought on the macroinvertebrate community structure were explored
with quarterly collections of macroinvertebrates from each river (Chapter
5). Chapter 6 examines the use of allochthonous and autochthonous
resources by the benthic food web, with field and laboratory trials. Stable
carbon and nitrogen isotopes were used to analyse macroinvertebrate
diets over 2 years (Ch. 6.1), and laboratory feeding preference trials
examined and corroborated the stable isotope results (Ch. 6.2). Chapters
6.1 and 6.2 have been submitted for publication and have been formatted
to comply with the requirements of the individual journals. There is some
duplication of information from previous chapters, particularly in the
introductions and methods sections.
Chapter 7 is a synthesis and discussion of the results in the context of the
General introduction
15
conceptual model of the interactions between the flow regime and the
measured ecosystem variables. This is intended to inform water
managers of the likely consequences of long-term impoundment of similar
forested rivers in Mediterranean climate zones and proposes some
16
Chapter 2 The influence of river hydrology on channel
morphology and site characteristics
2.1 Abstract
A river’s flow regime (hydrology) influences its geomorphology, with consequent impact on the structure of the riparian vegetation and instream resource
availability. This chapter examines the 1st- and 2nd- order effects of flow
regulation, by contrasting upstream and downstream sites on the regulated Tooms River and unregulated Macquarie River in eastern Tasmania. The climate of the catchment is discussed and the study sites introduced. A range of flow metrics were used to analyse the hydrology of the two rivers. Tooms River has a stable, but seasonally reversed flow regime, with few floods and no zero flow periods. The unregulated Macquarie River has a highly variable flow regime, with irregular but powerful floods and frequent cease to flow periods. The river planform was surveyed at each site to examine the influence of the flow regime on the geomorphology. The stable flow regime in Tooms River has produced an incised channel, with mature trees close to the waters edge, whereas the
Macquarie River has a defined riparian zone with vegetation distinct from the surrounding woodland.
2.2 Introduction
Under a natural flow regime, the channel form is produced by the
downstream movement of sediments. The river loses kinetic energy, or
erosional power with sediment transport, with turbulence, or with friction
with the substrate, stream banks or riparian vegetation. Damming a river
can remove or reduce sediment flow, increasing the kinetic energy of the
water (Kondolf 1997). This can influence the geomorphology of the
channel and banks, either eroding or depositing sediments, with
consequences for aquatic and riparian vegetation (e.g. Nilsson and
Berggren 2000). The hydrology of a river acts on and with the channel
morphology to influence sediment and nutrient transport, habitat
availability for aquatic biota, and the presence and abundance of food
Hydrology and study sites
17
This chapter introduces the climate and physical characteristics of the
study sites, and examines the hydrology and geomorphology of the two
rivers. These factors set the scene for the following chapters, which
explore the influence of the different flow regimes on riparian vegetation
dynamics, benthic resources and macroinvertebrate communities.
2.3 Study design
The Macquarie River, in eastern Tasmania, rises in the Eastern Tiers, just
south of Lake Leake, at an elevation of 575 m. It has a total length of
about 180 km, and a total catchment of 4 241 km2 (DPIW 2008). This
study examines the headwaters of the Macquarie River, with a total length
of about 40 km, upstream of the junction with Tooms River. Tooms River
is a regulated tributary of the Macquarie, rising at an elevation of 463.5
m, with a total pre-impoundment length of about 25 km and catchment of
approximately 80 km2 (Croome and Tyler 1972) (Table 2.1). The two
Macquarie River sites were chosen on the basis that they have been
classified as having high naturalness (CFEV 2005) and represent genuine
reference conditions for each of the Tooms River sites (sensu Stoddard et
al. 2006).
While the headwaters of Tooms River have been heavily modified by the
impoundment, Stoddard et al.’s (2006) ‘minimally disturbed’ category can
be applied to the upstream Macquarie site, which has had no modification
from what would have been the pre-European settlement (1803) state of
Tooms River. The two downstream sites, in contrast, have both been
modified by low-impact agriculture, primarily year-round low density
sheep grazing (< 0.5.ha-1). The major physical difference between these
Hydrology and study sites
18
Table 2.1 Location and physical characteristics of each study site. Base data from CFEV© and The List, © State of Tasmania, and field measurements.
Macquarie River Tooms River
Site variables
Upstream site CB
Downstream site IF
Upstream site TL
Downstream site BB
Latitude 42o09’2.97”S 42o09’51.03”S 42o12’41.70”S 42o11’31.69”S
Longitude 147o49’59.04”E 147o42’43.73”E 147o46’21.07”E 147o43’50.60”E
Catchment area (km2) 85. 9 169.3 62.3 75.6
Orientation ENE-WSW E-W ENE-WSW SSE-NNW
Discharge (m2.sec-1) 0 - 130 0 – 131.3 0.002 – 22.4 0.002 – 22.6 Mean annual runoff
(ML.y-1) 23669.40 41499.71 13860.94 15780.16
Altitude (m) 408 290 448 282
Mean bankful width
(m) 8.9 5.1 2.8 5.5
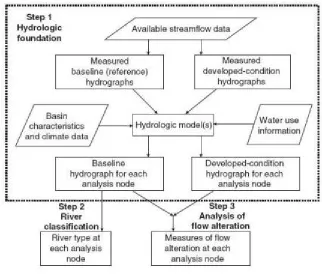
2.4 Study sites
Two sites were selected on each of the upper Macquarie and Tooms Rivers,
paired by one site in the headwaters of each river and a second site in the
downstream alluvial valleys (Fig. 2.1). Potential study sites were limited by
the availability of access, but were chosen to be as comparable as possible
in terms of the key features of adjacent vegetation, land use, geomorphology
and in-stream substrate. The upstream Tooms River site, “Tooms Lake”
(TL), was within the lakeside water reserve, approximately 1 km
downstream of the dam. The downstream Tooms site, “Blanket Bottom”
(BB), was just above the junction with the Macquarie River and was
selected as the most distant reach from the dam and therefore the most
likely to show recovery from impoundment. The upstream Macquarie River
site, “Colonels Bridge” (CB), was far enough from the headwaters to have
perennial flow, had unmodified riparian vegetation and access from an
abandoned forestry road. The downstream Macquarie site, “Island Flats”
(IF), was close to the junction with Tooms River, was readily accessible and
provided an unregulated comparison with the downstream Tooms site,
which had a similar grazing history. The understory of each downstream
site had a mixture of introduced and native grasses and rough grazing land.
Agricultural activity was predominantly low density (< 0.5. ha-1) dryland
Hydrology and study sites
[image:33.595.101.529.115.342.2]19
Fig. 2.1 Location of study sites, where CB and IF are the upstream and
downstream Macquarie sites, and TL and BB are the upstream and downstream Tooms sites, respectively. The upper Macquarie River is shown in dark green. Tooms River is in red, connecting Tooms Lake with the lower Macquarie in bold dark red. The colours indicate the naturalness of the river reaches, with high naturalness shown in green and low naturalness shown in red. Orange indicates moderate naturalness. Most minor tributaries are shown in light green. Map modified from base data by CFEV and the LIST, © State of Tasmania.
All sites have similar geology, dominated by Jurassic dolerite with some
Triassic sandstones (Jerie et al. 2003b) and satisfy Ward and Stanford’s
(1995b) definition of a ‘mountain headwater reach’ (Fig.1.1). Both rivers
are bedrock controlled, with the constrained channels diverted by dolerite
intrusions. In common with many rivers of east coast Tasmania, the
Macquarie River responds rapidly to rainfall events, resulting in a highly
variable (or ‘flashy’) flow regime (DPIPWE 2010). This is likely to have
been the original condition for the present Tooms River.
The original Toombs Marsh was first dammed in 1840 as a secure water
supply for farmer-settlers in the Ross area (Croome and Tyler 1972;
Mason-Cox 1993). The dam failed to fill in the first winter, but was
destroyed by floods in the second year and again in 1863 and 1900
N
Tooms Lake
Hydrology and study sites
20
(Mason-Cox 1993), demonstrating the flashy flow regime. Tooms Lake
currently has an area of approximately 6 km2, a mean depth of 3.6 m and
volume of 24 000 ML. The earth-filled dam has been approximately 4 m
high since at least 1864, with a concrete spillway (DPIW 2008). Water is
released from the dam via a sluice gate at the base of the dam wall (Fig.
2.2), which supplies irrigation for downstream agriculture and domestic
water supply for the town of Ross, under the management of the Elizabeth
Macquarie Irrigation Trust. Water is released from the dam in summer
and other times of low flow, to augment flows in the Macquarie River.
There is an environmental flow requirement of 4.1 ML.day-1 at Fosterville,
over 50 km downstream of the Tooms River - Macquarie River junction
and upstream of the Elizabeth River junction with the Macquarie (DPIW
[image:34.595.188.423.354.624.2]2008).
Fig. 2.2 Tooms River outlet in the Tooms Lake dam wall in February 2008, with discharge recorded as 0.18 m3.sec-1 by the downstream gauge.
Hydrology and study sites
21
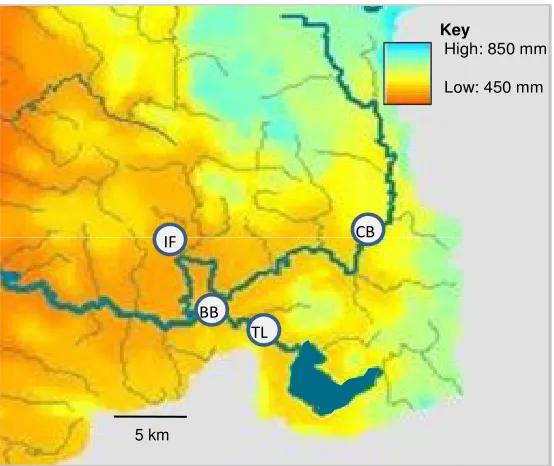
2.5 Catchment climate
The Macquarie catchment has a cool temperate climate, with low to
medium rainfall restricted by mountain ranges to the west and east of the
[image:35.595.167.444.175.408.2]catchment (Fig. 2.3).
Fig. 2.3 Mean annual rainfall (mm) distribution across the upper Macquarie catchment. The driest areas are indicated by red tones, blue tones indicate the highest rainfall areas. The major rivers and Tooms Lake are shown in dark blue. Figure modified from DPIW (2008).
Although the maximum temperature rarely exceeds 30o C, the average
annual rainfall of 520 mm is in deficit to annual evaporation of about
1000 mm p.a. (Bureau of Meteorology 2010) (Fig. 2.4).
Key
High: 850 mm
Low: 450 mm
TL
CB BB
IF
TL
Hydrology and study sites
22
Fig.2.4 Mean monthly rainfall and pan evaporation (mm) for the upper Macquarie catchment 1970 – 2008 (modified from DPIW (2008)).
Rainfall is fairly evenly spread throughout the year (Fig. 2.4), with lowest
rainfall in late summer and highest rainfall in spring, although heavy rain
can be directed into the catchment in any season when a low pressure
system forms off the east coast (Bureau of Meteorology 2010). Rainfall
was assumed to be similar across the study sites, although there can be
high within-catchment rainfall variation in eastern Australia (Croke and
Jakeman 2001). Incomplete precipitation records were available from rain
gauges at Tooms Lake and Mt Morriston, approximately 13 km
downstream of the study sites. Missing data were replaced with data
directly interpolated from gauges at Lake Leake, 15 km north of the study
sites, Swansea 15 km to the east and Ross, approximately 25 km to the
west.
Rainfall during 2006 – 2008 was the lowest in recorded history for eastern
Tasmania (Fig. 2.5), with total precipitation for this area only 1050 mm
during this period (Bureau of Meteorology 2010). 0 20 40 60 80 100 120 140 160 180
Jan Feb Mar Apr May Jun Jul Aug Sep Oct Nov Dec
Hydrology and study sites
[image:37.595.99.505.60.390.2]23
Fig. 2.5 Rainfall deficiency for Tasmania during the 2006-2008 study period. Map produced by the National Climate Centre (NCC 2009). Darker colours indicate higher severity of rainfall deficit, with lowest rainfall on record shown in red. Average rainfall conditions were experienced in areas without colour.
The upper Macquarie River flowed intermittently through 2006 – 2007,
but ceased to flow between December 2007 and November 2008. Over
this period, the upstream Macquarie site, CB, was reduced to small
groundwater-fed pools, whilst the downstream site, IF, dried out
completely. In contrast, continuous low flow was maintained in Tooms
River to augment the lower Macquarie River. Although abstraction for
irrigation is prohibited when the Tooms Lake storage falls below 9 000
ML, discharge was maintained at minimal levels to satisfy environmental
Hydrology and study sites
24
2.6 Hydrology
2.6.1 Methods
Changes to the hydrological regime impact on sediment and nutrient
transport to produce first-order regulation effects (Petts 1984). River
hydrology for this study was derived from data published online (WIST
2010), which showed records from a stream gauge immediately below
Tooms Lake; a discontinued gauge at Longmarsh, approximately 1 km
upstream of the Macquarie River sites; and a gauge at Trefusis,
approximately 12 km downstream of the Tooms - Macquarie junction.
The gauge at Trefusis replaced the flow gauge at Longmarsh in 1990.
The variability of flow in the two rivers was examined with selected
metrics devised by Puckridge et al. (1998) and employed by Growns and
Marsh (2000) in the analysis of the hydrology of southeastern Australian
streams. Puckridge et al. (1998) recommended using data series of at
least 15 years to calculate flow metrics. Initially, flow for the two
Macquarie sites for the period 1970 – 2009 was calculated with a
rainfall-runoff model. However, this data set was considered unreliable because
the model did not detect the observed or recorded cease-to-flow periods in
this river. Models are recognised as poorly representing low flow periods
(Smakhtin 2001), and downstream gauges may not reflect the conditions
in the upper catchment (Niadas 2005).
Comparable gauged data were available for both rivers for the period May
1975 – October 1990 from the Tooms River and Longmarsh gauges, which
satisfied Puckridge et al.’s (1998) criterion. Mean, median, minimum and
maximum discharges for the Macquarie River (Table 2.1) were calculated
from the Longmarsh and Tooms gauge records for the full 15 year data
set. Additional flow metrics were calculated from the available gauged
data, using the formulae in Microsoft Excel 2007 (Growns and Marsh
Hydrology and study sites
25
for that day was excluded from both data sets. This constituted less than
0.4% of the total values.
Because annual rainfall in eastern Tasmania has declined since 1990
(Bureau of Meteorology 2010), an additional data set was generated for
the ungauged Macquarie River for the period 2000 – 2009. This was
calculated by subtracting the mean daily flows recorded by the gauge at
Tooms Lake, from mean daily flows recorded at Trefusis on the
downstream Macquarie River. The data were corrected for the time lag
between recording stations (12 h), and for input from minor tributaries
with recorded historic mean daily flows from the discontinued gauging
weir at Longmarsh. The adjusted 2000 – 2009 data were used to plot a
time series of mean daily flow and to calculate flow frequency curves.
Data were plotted using the ggplot2 package (Wickham 2009) in R version
2.11.0 (R Development Core Team 2010). Analysis of variance (ANOVA)
examined the strength of the variation between rivers.
Flow metrics were calculated for each river, rather than for individual
sites, because there were no major tributaries between upstream and
downstream sites on each river to significantly modify the flow. Water
abstraction for irrigation was prohibited for much of the study period,
reducing releases from Tooms Lake, although some flow was maintained
to meet downstream environmental flow allocations. However, the
property adjacent to the downstream Macquarie River site has licensed
water rights (DPIW 2008) and is likely to abstract water from the
upstream broadwater pool, reducing flow at this site. There are also likely
to be unmetered water abstractions from the Macquarie River between
Hydrology and study sites
26
2.6.2 Results
The establishment of hydrological metrics was recommended by Poff et al.
(2010) as the first stage in determining the impact of flow regulation on
ecological variables. The Macquarie River has a highly variable flow
regime, with frequent periods of low or zero flow. Lowest flows are
typically in summer, but can occur at any time of the year (Fig. 2.6). The
drought period of 2006 – 2008 produced very low discharge, with 412 zero
flow days (37.6%) during this period. In contrast, figure 2.6 shows that
high and low flows were seasonally reversed in Tooms River. Lowest flows
were in winter, but the river was never completely dry. High flows were
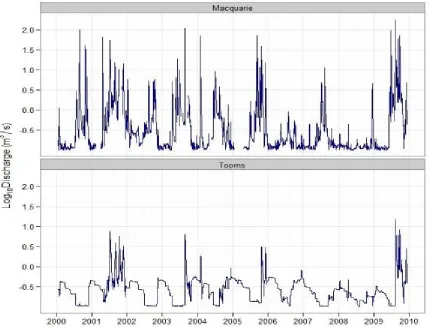
[image:40.595.91.520.332.659.2]rare and restricted to periods of high rainfall when the full dam spilled.
Hydrology and study sites
27
Analysis of flow frequency from 2000-2009 shows that mean daily
discharge in both rivers equaled or exceeded 0.01 m3.sec-1 (cumecs) for
80% of the time. However, Tooms River did not have the rare high flows
shown for the Macquarie River, but had more flow at the low discharge
end of the scale. Sixty percent of the time discharge was 0.1 cumecs in
Tooms, but less than 0.05 cumecs in the Macquarie (Fig. 2.7).
Fig. 2.7 Flow frequency as log10 modelled mean daily discharge (m3.sec-1) for the
Macquarie (red) and Tooms (blue) Rivers, where the lines indicate the percentage of time that the flow was equal to, or higher than the discharge shown on the y-axis, in the decade between 2000 and 2009.
There is an abrupt shift in the low frequency zone for Tooms River, where
infrequent floods occur as the dam spills, and another abrupt shift for
both rivers in the high frequency region (Fig. 2.7). The low frequency of
high flows in the Macquarie River is indicative of the effects of heavy rain
in a small catchment, while the abrupt change to the high frequency of Percentage of time flow equalled or exceeded
M
e
a
n
d
a
ily
d
is
c
h
a
rg
e
(
m
3 s
−
1 )
10-4 10-3 10-2 10-1 100 101 102
Hydrology and study sites
28
low flow is indicative of the intermittency of the Macquarie River, and long
periods of very low flow in Tooms River. Tooms River discharge was
significantly lower and less variable in winter 2007 than in winter 2006
(ANOVA, F (1, 184) = 94.53, p < 0.0001). Discharge was also significantly
lower in the summer irrigation period 1 November 2007 – 31 March 2008
than in the same period for 2006 - 2007 (F (1, 263) = 132.03, p < 0.0001).
The long, flat curve for Tooms River (Fig. 2.7) shows that flow regulation
maintains moderate flows for most of the year (DPIW 2008). Median
discharge (Q50), calculated from gauged 1975-1990 data, was higher in
Tooms River than in the Macquarie River (Table 2.2), while minimum flow
(Q90) in Tooms River was 0.1 m3.sec-1 and zero in the Macquarie. Analysis
of flow-duration indices shows that base flow (Q90 /Q50) contributed a
greater proportion of the flow in Tooms River (Gordon et al. 1992),
indicating the maintenance of low flows typical of regulated rivers
(McMahon and Finlayson 2003), while the flood peak (Q10 /Q50) was
almost twice as high in the Macquarie River. The maximum flow (Q max)
was almost 6 times higher in the Macquarie, but discharges higher than
85 m3.sec-1 were only recorded twice in the 15 year period, while there
was zero flow for up to 170 days per year (mean of 56 days). February
and March were the driest months, with the Macquarie River completely
dry for eight of the fifteen Februarys. The longest period without flow in
this data series was from December 1983 to mid-June 1984, although the
river was dry for 10 months in 2008. The coefficient of variability (CV)
and flow variability character (Puckridge et al. 1998) of the Macquarie
River were significantly higher than the values for Tooms River, indicating
Hydrology and study sites
29
Table 2.2 Flow-duration analysis of the Macquarie and Tooms Rivers, based on gauged flows for 1975-1990. The variable Q represents discharge, where Q10 = is the
90th percentile value and the discharge that is exceeded 10% of the time. Metrics are expressed in m3.sec.-1, except for the coefficient of variation (CV)*, which is
dimensionless.
Flow metric Flow variable Macquarie River m3.sec -1
Tooms River m3.sec -1
Q min Minimum flow 0 0.002
Q max Maximum flow 130.59 22.40
Q10 High flow index 1.85 1.04
Q50 Median flow 0.13 0.30
Q90 Low flow index 0 0.01
Q90 /Q50 Base flow index 0 0.04
Q10 /Q50 Flood peak 14.37 3.51
(Q10 – Q90) /Q50 Flow variability 14.37 3.46
Std.dev. flow values mean flow
Coefficient of
variation (CV)* 4.33 2.35
Mean/median Skewness of flow 7.02 1.96
Because the base flow value (Q90) for the Macquarie River is zero, the flood
peak and flow variability indices for this river are identical. Indices of flow
variability are calculated against median discharge, while the CV is
calculated against mean discharge. The value for skewness of flow
indicates the extent to which the mean value deviates from the median
value, with a higher value indicating greater flow variation (Growns and
Marsh 2000).
2.6.3 Discussion
Walker (1985) claimed that Tasmanian rivers were hydrologically distinct
from mainland Australian rivers, due to mountainous terrain and high
rainfall. Several other publications use average Tasmanian rainfall to
classify the state’s river flows (e.g. DPIE 1987). However, Tasmania has a
strong west-east rainfall gradient (Langford 1965), so that the Macquarie
River system in the central east is more typical of many south-eastern
Australian rivers than of a typical Tasmanian river, with low rainfall and
seasonally intermittent flow. Kennard et al. (2010) classified the
Hydrology and study sites
30
Victorian and northern NSW coastal rivers. However, this classification
was based on flow records from the gauge at Trefusis (see section 2.5.1),
so was heavily influenced by the regulated flow regime. In contrast to the
published classifications of this river (e.g. Kennard et al. 2010), the
Macquarie River should be classified as “intermittent runoff” using Poff’s
(1996) river classification criteria, according to the flow metrics reported
in this chapter, and is therefore typical of many rivers in semi-arid areas
of Australia.
2.7 Hydraulic modelling
Hydraulic models were developed for all sites with HEC-RAS 4.0.0
software (Hydrologic Engineering Center 2008) to assess the second order
impact of the hydrologic regime on the channel morphology (Petts 1984).
Surveyed contours were used to construct a channel profile for each study
reach, which allowed modelling of the extent of measured or historic flow
levels. Nine to 14 transects were surveyed at each site, to the upper edge
of the historic river channels, within the limits of sightlines. Intermediate
transects were interpolated by HEC-RAS where the program could not
connect steady flow between surveyed transects. The Macquarie River
sites were surveyed with a dumpy level and staff. The Tooms River sites
were surveyed at a later date with a Total Station (Leica Geosystems AG,
Heerbrugg, Switzerland) and prism. By convention, the right bank is
taken as looking downstream. The Macquarie sites were completely dry
during the survey, so the model was calibrated by comparing modelled
and observed water surface heights for discharge measured on a single
sampling occasion. Three-dimensional profile plots of active channel and
bankful discharges were constructed to examine inundation patterns at
each site.
2.7.1 Macquarie River sites
Although Hamlet et al. (2005) define the upstream Macquarie site, CB, as
Hydrology and study sites
31
channel, probably a result of prehistoric flows (Jerie et al. 2003a) (Fig.
2.8). Bedrock and large boulders intersperse with shallow pools (< 1.0 m
deep). The right bank has a much steeper gradient than the left bank,
which forms a narrow floodplain.
The channel at the downstream Macquarie site, IF, is incised and confined
where flow is constricted by a bridge at the top of the reach (Fig. 2.9). A
pool (~ 750 mm deep) has formed below this constriction. The bottom of
the reach is characterised by low gradient. The right bank is a flat
floodplain extending to Punch’s Marsh. Water is channelled into a
secondary channel on the left bank at moderate flows (~1.3 cumecs).
Fig. 2.8 The x-y-z profile at base flow (0.01 cumecs) of the upstream Macquarie River site Colonels Bridge (CB). The river flows from top to bottom of the panel. The active channel bank stations are shown by the red lines, with surveyed transects in black, and the water level indicated in blue.
Legend
Water level
Transects