Rochester Institute of Technology
RIT Scholar Works
Theses
Thesis/Dissertation Collections
2004
Development of a human visual system with the
ability to detect inconsistent events
Jeremiah D. Brazeau
Follow this and additional works at:
http://scholarworks.rit.edu/theses
This Thesis is brought to you for free and open access by the Thesis/Dissertation Collections at RIT Scholar Works. It has been accepted for inclusion in Theses by an authorized administrator of RIT Scholar Works. For more information, please [email protected].
Recommended Citation
Development of a Human Visual System with
the Ability to Detect Inconsistent Events
Jeremiah D. Brazeau
Department of Computer Science
Rochester
In
stitute of Technology
A thesis, submitted to the Faculty of the Golisano College of Computing
and
Information Sciences
in
partial fulfillment of the requirement for the
degree
of Master
of Science in Computer Science.
Approved by:
1
/
/
Advisor: Dr. Roger Gaborski
Roger Gaboski
4/!9j:Pi/J()
f
Reader: Dr. Michael Van Wie
Michael Van Wie
L( /
I~
loy
Observer: Dr. Edith Hcmaspaandra
Edith Hemaspaandra
ft/tr/O~
Thesis/ Dissertation Author Permission Statement
Title of thesis or dissertation: D,,\g"\c'(ffijot a~ 0. \\umo,() ~\'\\'d ~~stem i"/i±h +1'\.1:# Anlli±~~CJ O",uc± -s:...(!Co.,S,'",*eM )::.\i<::()1s
Name of author:
"3"e.fe..m;(JJ
D,
'DCC\L(o" \) Degree: MeIster oj. ,)c'i<-\')(.:Program:
CO
mp0kC ;,',('\(.0('(;',College:
ex"
,
i;~;,C\oo Co\k~ oS- Com~(}±\D::s
Cl.1\d. :r(\~a'-md-',on Se ,,,-occ=,I understand that I must submit a print copy of my thesis or dissertation to the RIT Archives, per CUlTent RIT guidelines for the completion of my degree. I hereby grant to the Rochester Institute of Technology
and its agents the non-exclusive license to archive and make accessible my thesis or dissertation in whole
or in part in all forms of media in perpetuity, I retain all other ownership rights to the copyright of the thesis or disseltation. I also retain the right to use in future works (such as articles or books) all or part of
this thesis or dissertation.
Print Reproduction Permission Granted:
I, '~(em;<J, C). ~CC>.7g,c".) , hereby grant permission to the Rochester Institute Technology to reproduce my print thesis or disseltation in whole or in part. Any reproduction will not be for commercial use or profit.
Jeremiah D. Brazeau
Signature of Author: _ _ _ __ __ _ _ _ _ _ _ _ _ _ _ _ Date:
Print Reproduction Permission Denied:
I, ' hereby deny permission to the RIT Library of the
Rochester Institute of Technology to reproduce my print thesis or dissertation in whole or in patt.
Abstract
Current research has shown that it is possible to create a general purpose
learning
system that models the first few layers ofthe human visual system.Thegoal ofthis thesis isto build uponthatidea and produce a computational
model capable of
learning
different aspectsof visual information. Simulationsshow that the system is capable of
learning
anddistinguishing
different types of motion. Results also give one explanation, consistent with current experiments,
explaining how the human visual system learns information and asAcknowledgements
I would like to take the opportunity to thank the people who have supported
Contents
Abstract i
Acknowledgements ii
Contents iii
List of Figures vii
List of Tables xiv
1 Introduction 1
1.1 Approach 3
2 Background 5
2.1
Processing
Visual Information 52.1.1 The Layout of the Human Visual System 6
2.1.2 Motion
Processing
112.2 Models of Self
Learning
122.2.1 Self
Organizing
Maps 132.2.2 Hebbian
Learning
152.3
Early
Development ofthe Visual System 16Confenfs iv
2.3.1 Genetic Influences 16
2.3.2 Environmental Influences 17
2.3.3
Activity
Before Sight 192.4 Conclusion 20
3 Discussion of Related Work 21
3.1 Computation Models for
Learning
Orientation 213.1.1 von Malsburg's Method: Hebbian
Learning
223.1.2 Linsker's Method: Information Maximization 22
3.1.3 SOM Models 24
3.1.4 Correlation-based
learning
models 253.1.5 RF-LISSOM 25
3.1.6 HLISSOM 26
3.1.7 Conclusion 26
3.2 Computation Models for
Learning
Motion 273.2.1 Complete Motion
Processing
Models 273.2.2 One Extention ofHLISSOM 28
3.2.3 Layer Specific Models 28
3.3 Conclusion 29
4 A Model of Motion Processing: DS-LISSOM 30
4.1 Overview 31
4.2
Modeling
Retinal Activations 344.3
Processing
from the Retina to LGN 364.4
Modeling
VI 39Contents v
4.6
Training
the System 434.7
Inconsistency
Detection 444.8
Conclusion
465
Development
of Visual Preferences 475.1 Formation of Selective Neurons 47
5.1.1
Orientation
Selectivity
495.1.2 Motion
Selectivity
495.2
Finding
Inconsistencies 515.2.1
Finding
Changes in Orientation 545.2.2
Finding
Changes in Motion 565.2.3
Long
TermMemory
565.2.4
Working
with Natural Images 645.3 Conclusion 66
6 DS-LISSOM: A Users Guide 67
6.1 Explanation of the GUI 67
6.2 A simple example 69
6.3
Using
Different Data 707 Conclusion and Future Work 72
7.1
Modeling
More ofthe Visual System 727.1.1 More about VI 73
7.1.2
Modeling
MT 737.1.3
Modeling
MST 73Contenrs
A Source Code 75
75 A.l Vision System
A.2 GUI Creation 75
A.3 DS-LISSOM 81
1 17 A.4 Helper Functions
A.5 Rainbow Colormaps liy
List of Abbreviations *-*^
List
of
Figures
2.1 The above images are examples ofON-center and OFF-center
cells which are types of retinal ganglion cells. These cells ex
ist between the back of the retina and the lateral geniculate
nucleus
(LGN)
62.2
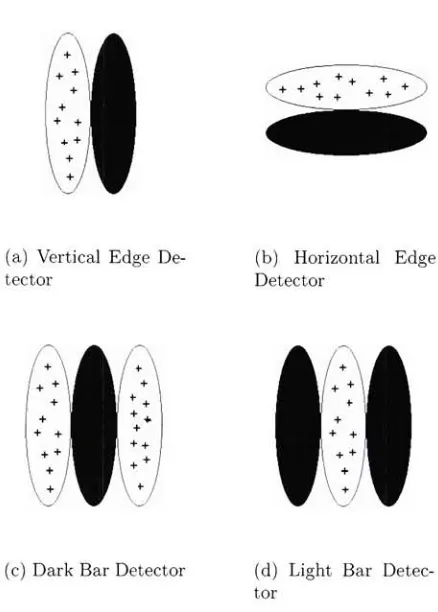
(a)
and(b)
are examples of neurons in VI that act as edgedetectors,
(c)
and(d)
are examples of neurons in VI what willrespond most strongly to vertical dark and light bars. The pictures above describe the receptive fields of these neurons.
In other wordsa neuron inVI will respond whenthe particular
pattern exists within itsreceptive field inthe previous layer (in
this case the
LGN)
9Li>r ofFigures V1U
2.3 This figure represents the layout as discussed so far. Infor
mation travels in through the eye to the retina. From there
informationmoves downthe retinal ganglion cells and onto the
LGN. From the LGN information continues on to VI. VI is
the first area to show orientation selectivity which is possible because of the structure of its receptive fields. There is also
evidencethat VI is
directionally
selective inhumans,
as it isin other species. From VI information moves to the MT region where motion processing is started. From here informationtravels to a number of regions
including
theMST,
FSA andMT+ subregions 10
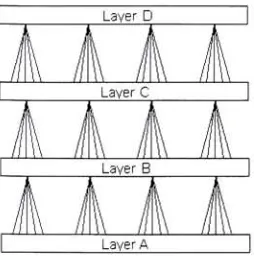
3.1 Linsker organized his system as a number of layers. The con
nections between layers are linear so it would be possible to perform all steps at once.
Only
4 layers are shown here but more are possible.By
the sixth layer the responses resemble those found in VI's simple cells although neighbors do not
show similar orientation preferences 24
4.1 Each of the major areas of DS-LISSOM are labeled. This is a
pictorial view of DS-LISSOM 32
4.2 These images are examples of the oriented Gaussians which
are used as the afferent weights from the input image to the
LGN. These act as simple edge detectors as it is thought the
List ofFigures ix
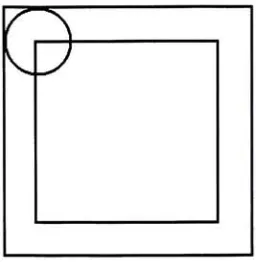
4.3 The circle representsthe receptivefield of a cell - for example a
cell in MT. This represents the fact that the preceeding
layer,
in this example
VI,
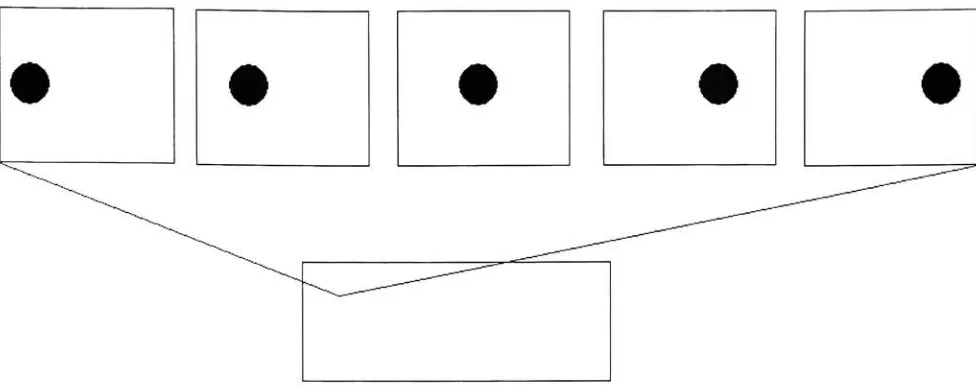
must be both longer and wider 364.4 Eachofthe
top
imagesrepresent areceptivefield of a single cellin MT. An MT's receptive field will draw data from multiple
points in time. In the above example, an MT is
looking
at 5 different points in time. As an object moves thedeveloping
MT cell will adjust its weights such that it will respond moststrongly when, in this example, a bright object moves to the
right through its receptive field 42
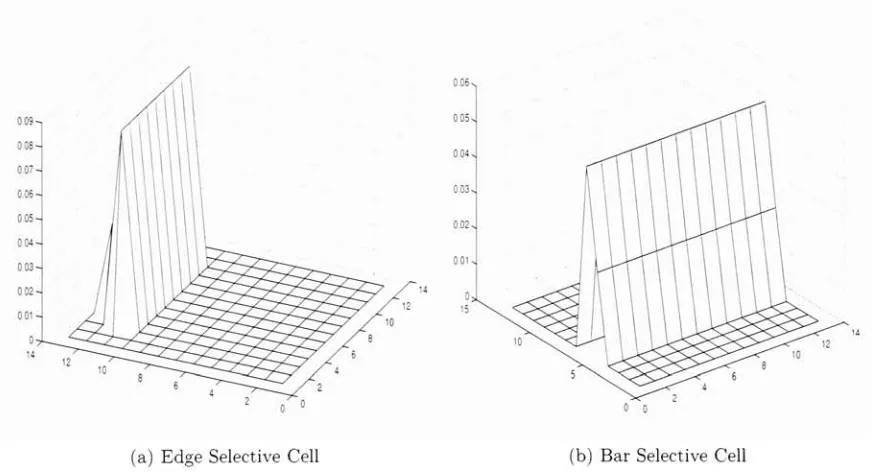
5.1 These are two examples of cells that are formed when a strong
edge and bar are present in an image. The result is the for
mation of edge and bar detectors that activate most strongly when an edge or bar is present in the appropriate part of its
receptive field 48
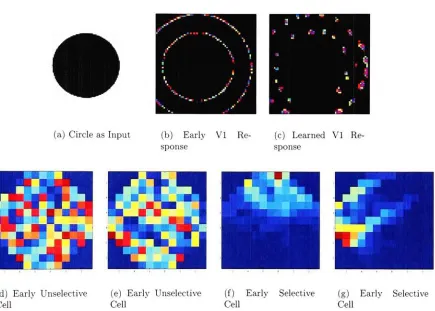
5.2 The first row shows the input
image,
the response in VI afteronly a 10
iterations,
the response after 10,000 iterations. The second row shows a number of cells after 10 iterationsand afterList ofFigures x
5.3 The lines represent connections between a cell in VI and cells in the LGN that are within its receptive field. The lighter
lines represent connections with strong weights while darker
lines represent connections with weak weights. This particular
cell will
initially
become active if there are a large number of bright cells on its left side and little activity on its right side(indicating
the presence of an edge) 515.4 The first row gives an example of a simple edge cell formed
by
DS-LISSOM when trained on 10,000 random ellipsoids. Thesecond row gives an example ofa simple bar cell, again formed
by
training
the system on random ellipsoids. The first twocolumns give different views of a cell's afferent weights, which are used to describe its receptive field and when it will become active. The third column shows the equivalent simple cell as it was described in previous chapters. This example helps to
show that DS-LISSOM is in fact capable of of
learning
andforming
cells that are sensitive to orientation, as are thoseobserved in biological experiments 52
5.5 This orientation map was formed after
training
the system for 10,000iterationson randomellispoid patterns. Thedarker colors are preferences for horizontalorientations while light colors are more selective of vertical orientations. The result is a map
that shows that system has a wide variety of orientation pref erences. Similar maps can be formed to show the directional
List ofFigures xi
5.6 Each of the above images represent one period in time and
the weights between cells in a particular time period in a cells receptive field to a cell in MT. An MT's receptive
field,
in otherwords, not only contains an area at the currenttime step,but that same area in previous time steps. As shown
by
theimages this allows an MT cell to be most active when and an
object appears in the appropriate regions ofits receptive field
in each time period. The above sequence shows a preference
for movement in the rightward direction 54 5.7 This figure demonstrates the weight changes that occur when
the input to the system changes. The first large spike in the
plot occurs when DS-LISSOM first sees the horizontal lines.
Since at this moment the map is completely random, there
are large changes in weight. The second large spike occurs when vertical lines are introduced for the first time to the
system. The
top
two figures show examples ofthe vertical andhorizontal lines that are sent to the system 55
5.8 Unlike 5.7thisexperiment was performed on DS-LISSOM after
it had been prenatally trained on random ellipsoids. Although
learning
again occurs, it is important to realize that the rel ative amount of change in the maps is significantly reduced.Learning
still must occur since the system has never seen horList ofFigures xh
5.9 In this example, no pretraining occurred. In this way the
system became oriented to seeing only a few specific orienta
tions. The top row shows the type of input images that were sent to the system. The first 900 iterations were input of a circle moving from the left to the right. After that the circle
changed
direction,
movingfrom theright to the left. With this change in directioncame a change in the amount theinhibitory
weights were
being
adjusted 585.10 Like
5.9,
this example was performed on DS-LISSOM with nopretraining. The
top
row shows the types ofinput images thatwere sent tothesystem. Images of a circle movingfromthe left
to the right were displayed for the first 900 iterations.
Next,
imagesof a circle moving up and to the right were shown. The
increase in weight change coincides with the change in direction. 59
5.11 The detection of movement occurs not only with circles, but
in the plot, with boxes as well 60
5.12 DS-LISSOM is also able to distinguish complex backgrounds
from the moving objects. The above plot shows the detec
tion of an ellipse's change of
direction,
even when a complexbackground exists 61
5.13 Once DS-LISSOM has seen an
image,
it is capable ofretaining thatknowledge. Inthe abovesequence DS-LISSOM wasshownhorizontal lines 20 times in a row, followed
by
vertical and horizontal linesbeing
displayed one after the other. As theList ofFigures xiii
5.14 The above plot shows that once DS-LISSOM is trained it is
already capable ofperceiving a number of different directional
motions. The amount of weight change is minimal, since many
parts of the map are already tuned to this directional motion. 63
5.15 The input image is oftwo roads. The
top
road is the only onewhere motion from cars occurs. At
first,
cars will only passfrom the right to the left. After some time a bus moves from
the left to the right. The plot shows the change in
learning
that occurs when the bus enters. Because the system was first
trained on random elipsoids, much of the other movement,
such as the movement in the
trees,
does not effect the results. 65List
of
Tables
Chapter
1
Introduction
Although much is known about the human visual system, few models have
been produced that are capable of processing information under circum
stances as diverse as those encountered
by
the human eye. One problem that computers face is thatthey
simply are not yet capable of processingso much information so quickly, perhaps because the human brain is more
complex,
having
an estimated 1015 synapses compared to the Pentium 4's 42million transistors (Kandel et al.,
1991;
Bednar,
2002).Although computers are not as complex, manymodels have been proposed
that are capable of
learning
different aspects of the human visual system. Some of these models look for predefined patterns that occur within images(for example, edges are often found using a difference ofgaussians approach).
Although these approaches are good at
finding
specific patterns within images,
they
are unable to adapt to or to find novel patterns. Other modelstry
to make use of neural networks tolook for moregeneral patterns withinimagedata. These approaches generally have a better chance of
finding
patternsChapter 1. Introduction
begin to give meaningful results.
From a biological point of view, the approach of neural networks allows
for the ability to adapt to different environments. One question still remains:
how is the human visual system able to learn so quickly given that it has
never been presented any visual stimulus? Recent experiments show that the
visual sensory system in mammals has gotten around this problem
by
specifying,
in the genome, a method oftraining(Bednar,
2002). The advantage ofspecifying a form of
training
instead of actual capabilities seems to be thatit allows for the system to see many features early on while also allowing for
a system that is able to adapt to a number of different environments. Such
training
occurs before birth and can prepare thevisual systemfor what it willencounter later in life. Given that
training
occurs within the visual systembefore it is introduced to an open environment, some level of proficiency in
sight can be gained before birth. Research also suggests that in many mam mals a special
directionally
selective set of cells exist. These cells, combined withlearning
that occurs prenatally, couldlay
the foundation for all thathumans see in terms of motion.
Experiments have shown that when information into the visual system is
disrupted,
the resulting system is not capable of perceiving all forms ofvisual stimulus. Of particular interest is the ability to use this fact to detect
novel events that occur within a series of images. As simulations will show,
it is possible to train a system in one environment with the intention oflater
placing the system in a similar environment, such that the amount ofactivity
that occurs within different parts of the simulated visual system can be used
to determine the novelty ofthe new environment.
Chapter 1. Introduction 3
such prenatal activity, and furthermore is capable of
becoming
orientationselective. An attempt is made to expand that model, proposing a system that
is capable of
distinguishing
different types ofdirectional motion.Finally,
theamount of activity in the system is investigated to see whether or not it is
possible to determine the occurrence of novelty within images.
1.1
Approach
A system that models the different areas of the human visual system includ
ing
the retina,LGN,
VI and MT areas is constructed and compared to whatis already known about the human visual system, with a hope that such a
system will be able to make predictions about the outcomes of future exper
iments. The visual system was chosen because it is a well studied sensory
system, and because many models of visual detection currently exist.
The system will be based on work published
by
JamesBednar,
which describes a system named HLISSOM
(Bednar,
2002). This system was createdto study the pattern generation
hypothesis,
which states thatlearning
occurs prenatally in such a way that the visual system comes prewired, and yet
contains the ability to adapt to the environment in which it is later placed.
HLISSOM models only parts of the retina, LGN and VI layers of the visual
system, and only looks at orientationprocessing
(Bednar,
2002). The systemcreated for this thesis expands upon this model in order to process motion.
In particular, this thesis looks at directional processing since it is well studied
in a number of different species.
Thesimulations focus onthe abilityofthe system to learn different aspects
Chapter 1. Introduction 4
Chapter
2
Background
Twotopics are most relevantto thiswork. Thefirst is a strong understanding
ofthe humanvisual system. This includesunderstanding thedifferent areas of
the human visual system, how
they
are connected and what each ofthe areasfunction is (Blake et al.,
2003;
Kandel et al.,1991;
Rosenzweig
et al, 1999).The second is Self Organization. Self Organization is a machine
learning
technique that requires no user input in order for the system to learn useful
information. The main form of self organization that will be used in this
system is modified Kahonen Maps and Hebbian
Learning
(Kohonen,
1997;
Hebb,
1949).2.1
Processing
Visual Information
The human visual system consists of a number of independent layers that
communicate with one another. Each oftheselayers is thought to be made up
of cells specific to the
functioning
ofthat layer. Each layer is also connectedto a number of other layers providing for information to be combined and
Chapter 2. Background
Figure 2.1: The above images are examples of ON-center and OFF-center cells
which, are types ofretinal ganglion cells. These cells exist between the back ofthe
retina andthe lateralgeniculate nucleus (LGN).
In order to simplify the model, only monochrome information is kept. As
such, this section focuses on parts of the visual system that make use of
monochrome information and ignore the parts of the visual system required for color processing.
2.1.1 The Layout ofthe Human Visual System
The first layer in the visual system is the retina. The retina is responsible for
taking
light,
varyingby
wavelength andintensity,
and producing an internal response. The retina is composed of2 different types ofcells that respond to different light information: the rods and the cones. The rods are responsiblefor seeing light whose wavelength is around 500nm. The rods are much more
sensitive to
intensity
and as such allow us to see even when little light is [image:24.536.186.440.98.235.2]Chapter 2. Background 7
those that peak around 540
(green)
and those that peak around 570 (red).Activity
that these cells detect is encoded, and patterns of electrical activityare generated in neurons called the retinal ganglion cells
(Rosenzweig
et al,1999).
Retinal ganglion cells respond most strongly to edges between light and
dark areas and as such perform atype of edge detection. Two specific retinal
ganglion cells that are known to exist are ON-center and OFF-center cells
shown in Figure 2.1. ON-center retinal ganglion cells respond most strongly
when there is a light area surrounded
by
a darker region. This entire regionis known as the retinal ganglion cell's receptive field (RF). The OFF-center
retinal ganglion cells
by
contrast have the strongest response when there is adark spot that is surrounded
by
a light region.As informationpasses through the retina it then moves up the optic nerve
to the lateral geniculate nucleus
(LGN),
located in the thalamus. As withtheretinal ganglion cells of the retina, there are two specific types of response
cells inthe LGN (ON and OFF). The ON-centerretinal ganglion cells connect
to the ON cells of the LGN and OFF-center retinal ganglion cells connect
with the OFF cells ofthe LGN. Each ofthe cells in the LGN is connected to
a region ofcells, its receptive
field,
such that when a response is generated inthat region, the specific LGN cell will also respond.
From the
LGN,
informationtravelsto the primaryvisual cortex (VI). TheVI layer is the first layer that is orientation selective. Just as the LGN layer
is connected to the retina, the VI layer is connected to the LGN layer such
that each cell of the VI layer is connected to a region within the LGN. The
types of cells in VI differ from those found in previous layers. There are two
Chapter 2. Background 8
be thought of as edge and bar detectors. Figure 2.2 shows 4 different simple
cells. The first two are selective of edges while the second two are selective
of
bars,
orlines,
that run through their receptive field. Complex cells still respond to orientations; however, these cells may only respond when an edge exists moving in a particular direction. This said, VI is also one ofthe layers in the human visual system that is sensitive to direction.Cells,
such as some complex cells, that are selective of direction are generally termed DS cells(Directionally Selective)
(Blake et al, 2003).Fromthe primaryvisualcortex, informationbranches to a number ofother areas along two main pathways. This first pathwayleadsto the temporal cor
tex. The temporalcortexisresponsible forour understandingand recognition of objects. The second pathway leads to the parietal cortex. The parietal
cortex is responsible for processing and understanding motion.
The first stop in the parietal cortex is MT
(Rosenzweig
et al, 1999). MT is most responsive to edges that move in a specific direction. The receptivefields in MT tend to be much larger than those in VI (in fact
they
can beup to 10 times as large). In order to account for such selectivity, MT must be given information from more then one time period. Such information is
provided through feedback loops and delayed responses.
Once through
MT,
information moves to a number of other regions. Ateach step the information is reprocessed in a more refined manner than in
the area that proceeds it. In this way, more complex patterns of motion can be observed as one proceeds farther along the motion pathway
(Grzywacz
&Merwine,
2002).Chapter2. Background
(a) Vertical Edge De tector
(b) Horizontal Edge Detector
(c) Dark Bar Detector (d) Light Bar Detec tor
[image:27.536.158.377.143.449.2]Chapter 2. Background 10
Figure2.3: Thisfigurerepresentsthelayoutasdiscussedsofar. Informationtravels in through the eye to the retina. From there information moves down the retinal
ganglion cells and onto the LGN. From the LGN information continues on to VI. VI is the first area to show orientation selectivity which is possible because ofthe
structureofitsreceptivefields. There isalso evidencethatVI isdirectionallyselective
in humans, as it is in other species. From VI informationmoves to the MT region
where motion processing is started. From here information travels to a number of
[image:28.536.56.483.192.379.2]Chapter2. Background 11
2.1.2 Motion
Processing
Newton once said that in order to understand motion one needs to know
direction,
speed and acceleration. As humans we are able to distinguishmotion. We are also capable of
differentiating
speeds of objects. When itcomes to acceleration
however,
we are not as capable.Newton was
describing
motion in a scientific sense;however,
his ideas alsorelate to a human's perception of motion. A number of different things need
to happen in order for the brain to get a picture of motion.
Seeing
motionis not as simple as noticing an object move across a screen. For example,
consider what happens if you watch a car
driving
down the street as youmove your head. You have a sense that the car is still moving, even if it
remains within your sight. Another example would be ifyou were sitting in
the car. Even if you pass someone who is standing, you are able to tell that
they
are not moving, even thoughthey
move across your visual field. In orderto accomplish all of this a number of areas of the brain play a role. Two of
the major players are the MT and MST areas.
William T. Newsome performed experiments on monkeys to
help
show thefunction of MT (Newsome &
Pare,
1998). Prior to the experiment, monkeyswere trained to report their perception ofdirectionwhile watching dots move
in specific directions.
During
the experiment the same patterns of dots moving
were shown to the monkeys and brain activity was recorded. The resultsshowed a direct correlation with the activity with the cells in MT. Further
experiments showed that a monkey's responses could be altered
by injecting
MT cells with low levels of current (Grzywacz &
Merwine,
2002).Chapter 2. Background
*--one direction or another independent of the orientation of the object that is
moving. Such a result may indicate that the MT uses information from the
output of
VI,
and other areas, from different times. In this way it wouldbe possible for the
directionally
selective cells in MT to become active whenobjects form the appropriate orientation through time.
The MST region of the brain is also very important in our understanding
of motion. This area seems to be responsible for understanding motion
by
using information that is not visually available. It is this area that helps us
to understand that when we turn our head everything in a room remains still
even though it is crossing our visual field. In terms ofunderstanding motion,
this is vital.
2.2
Models
ofSelf
Learning
A number of different models have been produced for
learning
informationabout arbitrary systems.
Many
of these models require some form of interaction to take place. For the visual system this is not desirable since we as
humans do not require any interaction with our environment to
initially
see.Nor do outside forces tell us whether or not what we are seeing is correct or
incorrect.
Therefore,
this other forms of computerlearning
must be investigated. Two such systems are Self
Organizing
Maps and Hebbian Learning. Both are capable of recognizing patterns that exist when giveninput,
andboth attempt to form different categories based on these patterns, such that
when new input is given to the system, it can be placed in the appropriate
Chapter 2. Background 13
2.2.1 Self
Organizing
MapsThe previous sections have
briefly
outlinedthe layout ofdifferent componentsofthe human visual system. Each ofthese different areas plays an important
role when
looking
atdeveloping
a model that is capable of processing visualinformation. What still needs to be explained is how all of these different
areas will contribute to
learning
in a computer simulated model. It is clearthat as humans we do not have to be told how to see; rather, over time
we simply learn that ability on our own. In fact we are able to recognize
some things when we are first born. In order to accomplish this within a
computational environment, some form of self organization must be present.
Self
Organizing
Maps(SOM),
also known as Kohonen maps, were first developed
by
Teuvo Kohonen around 1989. Kohonenmaps arecapable, withoutany previous
knowledge,
of associating concepts with categories. In particular,
each concept becomes associated, overtime,
with alocation on the map.Concepts that are similar are located near each other on the map, while
dissimilar concepts are further apart on the map.
The obvious question that remains is how does the map update itself in
such a way that no interaction is required? This has to do with the setup
of the map. You can think of the map as a 2 dimensional matrix. In this
matrix each cell has a vector of weights. There is one weight for each of
the attributes associated with an input vector. The weights of each cell are
initially
random.Like most neural networks, a Kohonen map learns over a series of rounds.
During
each round all input vectors are read in some arbitrary order. OnceChapter 2. Background 14
map and then updating the surrounding cells ofthe winner. In order to pick
the winner, the input vector is compared with all weight vectors in the map.
The winner is that vector in the map which is most like the input. To
determine how close two vectors are a distance measure is defined. Some
well-known measures of distance are the Euclidean distance and Manhattan
distance.
During
the update phase of this process, each of the vectors thatsurround the winner is updated to more closelyresemblethe winner. The size
of this surrounding area, and the amount
by
which these surround vectors,arechanged isslowlyreduced
during
each round such thatwell-defined groupscan be formed.
Self
Organizing
Maps can be describedby
thefollowing
algorithm:1. Read an input vector.
2. Determine which of the cells in the Kohonen map is the winner.
\\input nodewinner\\ =
min;
||znpw
nodei||
Here distance for a single node can be defined as:
dout
=J2m(inPutin
~nodein)2
3.
Modify
the weights w{ of the winning node and its neighbors so thatthey
more closely resemble the input.Input vector = pi
h(r,t)
=a(t)v(i)
a(t) is the
learning
coefficientv(t) is the neighborhood function
Wi(t +
1)
=w(t) +
h(r,t)(pi
Chapter 2. Background 15
wi(t +
1)
=w(t) if i neighborhood
4. Decrease the size ofthe neighborhood ofthe winning nodes
5. Decrease the
learning
coefficient, a(t), which controls the amount ofchange of each of the neighbors in the winning neighborhood.
6.
Learning
finishes when thelearning
coefficient is zero.2.2.2 Hebbian
Learning
Hebbian
Learning
is based onthe principlesof a work publishedby
the Canadian neuropsychologist Donald O. Hebb. Hebb states:
When an axon of cell A is near enough to a cell B and repeatedly or
persistentlytakespart in
firing
it,
some growth process or metabolicchange takes place in one or both cells such that A's efficiency, as
one of the cells
firing
B,
is increased(Hebb,
1949).Inotherwords, Hebb felt that ifreceptors are subject to repeatedstimulation,
they
will learn to act together as a closed system, even after that stimulationis no longer present.
This idea of
learning
has carried over into computer science and is termedHebbian Learning. Hebbian
Learning
is described as an unsupervised learning
algorithm in which the weight between two neurons will increase if boththe source and target neurons are active at the same time
(Medler,
1998). Asimple formula for this would be:
AWij(t)
7 * Xi*Xj
where
W{j
is the weight from neuron xi to neuron Xj. A more generalChapter 2. Background 16
2.3
Early
Development
of theVisual
System
Althoughthe structure ofthe visual system is well studied, there is still much debate over how this structure is defined within the genome. There are two
major encampments, those that feel that genetics act as a blueprint for the structure of the visual system and those that feel environmental influences
are responsible for its structure. These two sides are found throughout psy
chology and has become known as the Nature vs. Nurture debate.
As most occurrences of this
debate,
there is no clear evidence for eitherside; rather, it is more
likely
that some of the human visual system follows a blueprint that is predefined in our genetic code while other parts of ourvisual system adapt and are formed based on environmental influences. The
following
sections describe how both genetics and the environment are able to work together to form a system capable of perceiving visual information.2.3.1 Genetic Influences
In
building
astrongcase for the role genetic influencesplay on the productionof a visual system, it can be useful to acknowledge trends that occur within culturesor families. For example, iftwins areseparated at
birth,
what arethe chances that both are near sighted, or both are color blind? These questionshave
long
been studiedby
psychologists as awayto determine the significanceofgenetic factors in making us who we are. As a result there are a number of important experimentalresults that showthe importance ofgenetic factors in
Chapter 2. Background 17
Physical structure is also clearly
defined,
and it is known that the visualsystem amongst different species is not the same. For example, turtles have
far more
directionally
selective cells then humans. Such distinctions existlong
before birth and thus before any visual environmental influences arepresent. There is very little difference in structure within a single species.
Receptivity
to orientation and motion may also in part be defined genetically. For example, humans are not very good at
learning
to correctlyperceive objects if there is a time delay. If you watch a poorly made movie
you may notice that there is a
delay
between the sound you hear and thevisual movement ofthe mouth. No matter how
long
you watch the show, youwill never be able to correctly perceive the movie.
In terms of orientations, a few experiments have been able to show the
role that genetics plays in the development ofthe visual system. Advances in
medical
imaging
have allowed for full orientation preferences to be measuredin animals. Such studies have been able to show that orientation prefer
ences exist before there is any visual experience (and thus any environmental
influences).
Furthermore,
these studies have shown that such orientationpreferences closely mirror those found in adults (Crair &
Stryker,
1998).2.3.2 Environmental Influences
Chalupa and Rhoades found that visual deprivation significantly changed di
rectional selectivity, speed preference, and receptor field organization. When
they
looked at hamsters raised in stroboscopic illumination there were signsof visual
deprivation,
showing that an environment can influence the visualChapter 2. Background IS
Perhapsmore wellknown isthe work ofNobel Prize winnerTorsten Weisel.
In one ofhis lectures he describes experimentsthat he performed with David
Hubel while
investigating
the response properties of cortical cells in cats during
postnatal development. The experiments, performed onkittens,
requiredthat the eyelids of a subject be fused shut. He found that if only one eye
was kept shut
during
the first three months afterbirth,
and then allowedto open, the kitten was blind in the eye that was
initially
closed. If thesame experiment was performed on an adult cat, blindness did not occur.
Such work provides evidence that environmental influences are important for
proper development of the visual system
(Wiesel,
1982).More recent experiments on kittens raised without sight in one eye have
shown the development of non-specific lateral interactions for that eye.
If,
on the other
hand,
strabismus, more commonly known as crossed-eyes (acondition in which a both eyes can not be aligned simultaneously), was
present in
kittens,
then the lateralconnections were foundto becomepatchier(Kasamatsu et al,
1998;
Gilbert et al,1990;
Lowel kSinger,
1992).Blakemore and Cooper were able to show that kittens raised in environ
ments with only vertical stripes developed in such a way that
they
weregood at seeing vertical stripes but bad at seeing horizontal stripes. In other
words it ispossible that edge detectors in VI only developed for vertical lines
(Blakemore &
Cooper,
1970).Finally,
Stratton was able to show that the entire visual system can beaffected
by
environmental influences. In his experiments, goggles were usedto invert an
incoming
image. The question was whether or not an observerwould be able to perceive visual information appropriately, and the answer
Chapter 2. Background 19
environment in the same way he/she had before the goggles were introduced
(Stratton,
1897).2.3.3
Activity
Before SightIt is important to understand the connection that genetics plays in the devel
opment of visual perception both through genetically defined structures and
genetically defined activity.
Up
to this point we have seen that the structureof the visual system can be defined
by
genetics, and that the environmentcan have
long
lasting
effects on visual perception; still, newborn babies arecapable of perceiving some objects as soon as
they
open their eyes. Thequestion then is how perception is defined genetically before birth.
Experiments have shown that spontaneous neural activity occurs in many
different cortical and subcortical areas. Recent experiments have shown that
such activity, if
disrupted,
can havelong
lasting
developmental effects.One example of spontaneous neural activity is retinal waves. A number of
experiments have been able to link retinal waves with the development ofthe
visual system. One such experiment disrupted all retinal waves. As a result
the LGN failed to
develop
as it should, and neurons in VI were found tobe less selective of orientation
(Chapman,
2000;
Chapman &Stryker,
1993).Other recent experiments have been able to show that retinal waves can also
be instructive. For example, one experiment involved artificially activating
a large number of axons in the optic nerve of
ferrets,
so that activity inthese areas still existed although the activity was not the same as naturally
occurring retinal waves. The result was that neurons in VI were less selective
Chapter 2. Background 20
also the type of activity.
(Katz
&zShatz,
1996).Anotherexampleofspontaneous neuralactivity is ponto-geniculo-occipital
(PGO)
waves that occurduring
rapid-eye-movement(REM)
sleep. Thesewaves travel from the brainstem to the
LGN,
visual cortex, and a numberof subcortical areas. In human adults, these waves are strongly correlated
with dreams and their associated
imagery
(Marks et al, 1995). Experimentson kittens have shown that when visual stimulation is only allowed in one
eye,
by
fusing
the other eye shut, the LGN and VI are affected (as describedpreviously). When combined with the disruption ofREM sleep the effects on
the LGN and VI areas have been found to be stronger
indicating
that PGOwaves may
help
visual development even when visual impairments exist fora short while (Marks et al, 1995).
Bednar has spent a great deal of time
looking
into the effects of spontaneous neural activity within the visual system. His work stems from research
showing that such activity occurs within many
developing
cortical and subcortical areas,
including
the visual cortex and retina. His development of acomputer simulated visual system has been able to further show that such
stimulation, when it occurs prenatally, can ready a system for
interacting
with its environment
(Bednar,
2002).2.4
Conclusion
This chapter has looked at the layout of the visual system and at a number
of computer algorithms that are useful in modeling such a system includ
ing
SelfOrganizing
Maps and Hebbian Learning.Finally,
we discussed howChapter 2. Background 21
Chapter
3
Discussion
of
Related Work
The focus of this thesis is the development of a computational model for the
perception of orientationand motion. To date a large number ofmodels have
been produced, some more
biologically
oriented than others. Most of thesesystems store information in maps, which support the beliefthat many ofthe
lower-level areas in the human visual system are organized retinotopically.
That
is,
each ofthese areas is stored as a map which is capable of preservingthe
topography
of the retina. In this section a number of the models thatcurrently exist are presented. How well
they
model the different aspects ofthe human visualsystem, described in the previous chapter, is also discussed.
3.1
Computation Models
for
Learning
Orientation
A large number of computational models of the human visual system exist,
and as computers have been capable ofperforming calculations more quickly
these models haveevolved to take advantage ofthe increase in computational
power. What follows is a discussion of these systems, their abilities in gen
erating orientation maps, and how closely each system models a biological
Chapter 3. Discussion ofRelated Work 23
representation of the human visual system.
3.1.1 von Malsburg's Method: Hebbian
Learning
In 1973 von
Malsburg
was able to show that columns of orientation-selectiveneurons could
develop,
without supervision, from orientedbinary bitmap
patterns. Like most models that
follow,
von Malsburg's model was based onHebbian Learning.
This model formed a strong basis for most of the
following
models andcontained many of the characteristics found in later models,
including
theacknowledgement oflateralconnections (in this case
they
are fixed strength),the treatment of the retina and cortical areas as two-dimensional arrays,
and a method of assigning a value between connections which describes that
connections strength
(Bednar,
2002;
vonderMalsburg, 1973;
Rochester et al,1956).
Like many of the models based on von
Malsburg's,
most of the problemsstem from the fact that lateral connections are of fixed strength. One the
other
hand,
this particular model is capable ofcreatinga map whereby neighboring
cells share orientation preference, and as describedby
Bednar has thecapability to produce pinwheels within the orientation maps, which had not
previously been accomplished
(Bednar,
2002).3.1.2 Linsker's Method: Information Maximization
Linsker created a model based on local Hebb-like synaptic modification rules.
The modified rule used is
Swj
=Chapter 3. Discussion ofRelated Work 24
where
yxj is the Hebbian term and k is the
learning
rate. Each of thethree remaining terms modify the network to follow some set of constraints
where
b,
c and d are different constants(Linsker,
1986;
Rolls & Deco, 2002).The network is put together as a multi-layer system as shown in Figure
3.1. Each
layer,
except for thefirst,
looks at an area of the previous layerforming
Receptive Fields. The first layer acts as input similar to the conesand rods in the retina of the eye.
In order to train the network, random
firing
takes place. Over time each ofthe layers starts to form preferences. Rolls and Deco have observed that
by
the third
layer,
the formationof receptivefields thatresemble center-surroundcells could be
found,
andby
the sixthlayer,
the receptive fields had becomeelongated and responded best to oriented edges or bars.
Although the system was capable of
developing
receptive fields that wereorientation selective, the overall map was disorganized. This was due to the
lack of lateral connections. As a result cells in the sixth layer did not share
similar orientation preferences when neighboring each other. This leads to
redundancy within each layer. Another problem also exists because of the
way in which the system was randomly trained. When the system is first
placed in a real environment there is no guarantee that it will be capable of
perceiving anything in this new environment (Rolls &
Deco,
2002).A more fundamental problem with this system is that it does not address
higher order features such as a correlation between multiple edges. As such,
Chapter 3. Discussion ofRelated Work 25
LayerD
Layer C
LayerB
LayerA
Figure 3.1: Linsker organized his system as a number oflayers. The connections
between layersarelinearsoitwouldbe possibletoperformall steps atonce. Only4
layersare shownhere butmore arepossible. Bythesixthlayertheresponses resemble
those found in VI 's simple cells althoughneighbors do not show similar orientation
preferences.
3.1.3 SOM Models
Neither of the previous two models were capable of storing data
retinotopi-cally. This is in part because the two previous models generally modeled
only a small number of neurons.
Specifically,
because of computational constraints, the von
Malsburg
model was only capable of expressing a few neurons, all with overlappingreceptive fields.
By
the late 1980's and early1990's,
the amount of computational power available had grownimmensely. As a re
sult, new models were produced, and many of these made use of a more
abstract network known as the Self
Organizing Map
(SOM)
producedby
Kohonen.
Work
by
Durbin and Mitchison(along
with others) used SOM's and modified them to work within the orientationdomain. The resultswere promising,
capable of producing orientation maps that were comparable to those found
in the visual system and included properties such as pinwheels, fractures and
[image:43.536.207.334.65.195.2]Chapter 3. Discussion ofRelated Work 26
3.1.4 Correlation-based
learning
modelsCorrelation-based
learning
stems from the observation that the visual systemmay be linear. If this observation were true, then a function could replace
sequences of input patterns. Such a system would greatly improve the speed
of calculations when compared to the two previous models, which involve
incremental Hebbian learning. This approach was first suggested
by
Millerin 1994.
This model made a number of improvements in terms of what parts of
the visual system were modeled. For one, on and off center cells in the
LGN were modeled, and as a result multi-lobed receptive fields formed (no
previous model accomplished this). Although a step in the right
direction,
the maps produced
by
this model were not as realistic. The receptive fieldswere close to
binary
whereas receptive fields observed in animalshave smoothedge transitions. As aresult the responses achieved
by
the more computationally intensive Hebbian
learning
method proved more realistic andbiologically
plausible
(Bednar,
2002;
Piepenbrock et al, 1996).3.1.5 RF-LISSOM
SOM models, although more computationally expensive, haveproduced more
realisticresults. One
thing
that these models have lacked in is anexplanationof lateral connections. SOM models use a fixed neighborhood, but some
suspect thatlateralconnectionsformedprenatally
help
formorientation maps(Bednar,
2002). As a result a new model is needed that accounts for thepatchy lateral connections that are formed prenatally.
Chapter 3. Discussion ofRelated Work 27
Self-Organizing
Map)
was the first model to accomplish this(Sirosh,
1995).This model was based on previous SOM models but no longer approximated
lateral connections via a fixed neighborhood.
Instead,
incremental Hebbianlearning
was used todevelop
both lateral and afferent connections. As aresult, redundancy within maps, produced
by
previous models, was reduced.The major drawback to this system is that responses on real images are
less realistic, since it does not account for both ON and OFF cell layers.
Bednar has shown that this limitation must be overcome when working with
natural images
(Bednar,
2002). As a result the system has been modified andis discussed in the next section.
3.1.6 HLISSOM
HLISSOM was produced as an extension to the LISSOM model. It includes
not only the ability to learn lateral connections, but also the ON and OFF
center channels first introduced in the Correlation-based
learning
models.The resulting model has been shown to work with real
images,
an abilitythat previous models have lacked. It is also capable of sending information
to higher cortical areas. In particular, it models
face-selectivity (Bednar,
2002).
3.1.7 Conclusion
Although this and all previously discussed models are capable of modeling
orientation selectivity, none ofthese models extend to the perception of mo
tion. In particular, although orientationselectivityexists within
VI,
directionChapter 3. Discussion ofRelated Work 28
The next chapter is based on the HLISSOM model and looks at expanding
that model to account for directional selectivity in the VI and MT areas.
3.2
Computation
Models for
Learning
Motion
A number of people have also investigated motion perception.
Many
ofthesemodels are based on simplifications ofthe human visual system and do not as
closely follow a biological approach. Discussed below are a number of these
systems.
3.2.1 Complete Motion
Processing
ModelsA few modelshave been developed thatencompass the entire motion process
ing
pathway of the visual system. These models have shown to be capableof responding to motion in much the way we as humans respond to motion.
Many
of these systemsdirectly
specify the layout of the visual system. Asa result, these systems do not
internally
learn responses, and are only anestimation of what occurs naturally.
Experiments on these systems have shown that it is possible to produce
a system that can determine not only simple but complex motions such as
rotations, contractions and expansions. These systems can also determine
simple motion such as speed and direction (Pomplum et al,
2002;
Grossberg
et al, 2001). As a result these systems are useful in explaining human be
havior in terms of motion as a whole, and some
interesting
results in termsof attention have been found
(Pomplum
et al, 2002).What these systems lack is the ability to learn motion.
They
are preproChapter 3. Discussion ofRelated Work 29
learned. For example, if this system were only told about horizontal motion,
it would never be capable or
learning
vertical motion.3.2.2 One Extention of HLISSOM
Bednar has
discussed
a possible expansion to the HLISSOM model whichwould provide it with some sense ofdirection. The extension involves
spatio-temporal effects at the LGN and VI layers. As proposed, the model could
be expanded to include 4 separate LGN layers each responding to a different
point in time.
This model has shown the formation of
long
range lateral connectionsbetween neurons that share similar direction preference.
Clearly
this is astep in the right
direction,
but the model only goes as far as explaininginteractions between neurons at the VI layer. As such, more work is needed to expand this model to account for directional and speed selectivity at the
MT layer.
It is not clear at this time whether or not this model is capable ofworking on real
images,
as no data has yet been published using real images as input (Bednar &Miikkulainen,
2003).3.2.3 Layer Specific Models
Although
looking
atthe entire visual systemis ideal in understanding its over allfunction,
some research has focused onjust one layerofmotion processing.These models are idealwhen wantingto gain insight into the
functioning
ofa specific layer. For example, researchers at BostonUniversity
have developedChapter 3. Discussion ofRelated Work 30
visual system. Their model uses a back-propagation network to investigate
the different interactions that take place in
MST,
specificallylooking
at theinteraction between
locally
complex motions with global motion. A majordrawback is that the system requires supervised
learning (Beardsley
&;Vaina,
1998). Similar models have also been produced for other specific areas ofthe
visual system (Simoncelli &
Heeger,
1998).3.3
Conclusion
Previous models have shown the ability to model the
beginning
stages ofthevisual cortex in a generic way. Other models have shown that it is also pos
sible to model higher cortical areas of the visual system using linear models.
What these modelshave not yet shown isthe abilityto generalize past the VI
layer in order to process motion. Nor have
they
been used to aid in noveltydetectionwithin image sequences. The next chapter will discuss a model that
will attempt to overcomethese shortcomings and show that Hebbian
learning
can account for both orientation and direction selectivity within the visual
Chapter
4
A Model
of
Motion
Processing:
DS-LISSOM
This thesis presents a modified version of HLISSOM
(Bednar,
2002). HLISSOM is a
biologically
inspired model ofthe human visual systemfocusing
on the information pathway from the retina to VI. The new model presentedhere attempts to expand HLISSOM to model directional selectivity as it is
found at the MT layer. The expanded model also attempts to detect novelty
by looking
at the amount the system must change in order to incorporatethe new information. This chapter focuses on presenting the structure of the
model, and discusses how each step is
biologically
inspired.HLISSOM was chosen as the model to follow because of its strict adher
enceto emulatingbiological processes and itsability towork with real images.
Also,
few parts of the HLISSOM system are specifiedbeforehand,
and therefore it is possible to make connections between the way the model learns and experiments performedon animals. In later sections we will demonstrate this
connection.
One major omission in this model is the lack of chromatic information.
Chapter 4. A Model ofMotion Processing: DS-LISSOM 32
Experiments have shown that the chromatic properties of an object have
little influence on MT
neurons'
motion processing when there is sufficient
luminance contrast (Thiele et al, 1999). As such, in order to simplify the
model, chromatic information is not processed.
4.1
Overview
In this section DS-LISSOM
(Directionally
SelectiveLISSOM)
is laid out inits entirety. Later sections will focus on how each of the layers are devel
oped. A pictorial representation of the layout of DS-LISSOM can be seen in
Figure 4.1. Information is first processed
by
the retina. There are two suchsources of information: real images which represent sight and synthetically
generated images which represent spontaneous activity within the visual sys
tem (as discussed in previous chapters). Spontaneous activity will later be
shown to train the system in a way that is
biologically
similar to the visualstimulation that occurs prenatally. From the retina, information travels to
ward the LGN. The LGN layer is designed to be most responsive to bright
and dark spots within a given receptive field. To more accurately account
for this
information,
the LGN layer is made up of two separate channels.One ofthe channels is most responsive to light spots, while the other is most
responsive to dark spots. From the
LGN,
information will travel to VI. Forthis to occur, each neuron in VI looks at a region within the LGN layer (its
receptive field). As
learning
occurs, it will not only become sensitive to aparticular orientation, but lateral connections will also be updated such that
neighboringneurons will sharesimilar orientationpreferences. Inthis system,
Chapter 4. A ModelofMotion Processing: DS-LISSOM 33
Excitatory Weights
MT Afferent
Weights
Figure 4.1: Eachofthemajor areas ofDS-LISSOMarelabeled. This isapictorial
[image:51.536.36.506.147.506.2]Chapter 4. A Model ofMotion Processing: DS-LISSOM 34
connections will be inhibitory. To move to the MT
layer,
a similar processtakes place. Each neuron in MT pulls input from its receptive field in the
previous layer. In order to account for directional selectivity within the VI
layer, an approximation is made
by looking
at the different responses VI hasat predetermined time steps. In this way, only edges which are thought to be
movingare passed onto MT.
Generally
speaking, the receptive field of an MTneuron is larger then the receptive field of a VI neuron. Lateral connections
within the MT layer act similar to those in the VI layer such that neurons
with similar direction sensitivity tend to be close to one another. In order
to account for directional
information,
MT must process information from aseries oftime steps. To accomplish
this,
MT feeds back information from theChapter 4. A Model ofMotion Processing: DS-LISSOM 35
The
following
sections will look at how each of the layers is constructed.In each section the
following
symbols are usedrj is the final activation of a particular layer.
C
is the afferent response of a neuron.is the activation of a cell in the receptive field of another cell.
4.2
Modeling
Retinal Activations
Information,
or activation, in theretina comes fromone oftwo placesdepending
on whether or not the system is thought to be in a prenatal or postnatalstage.
During
the prenatal stage the retinal activation consists of patterns oforiented Gaussians as shown in Figure 4.2. These patterns can be generated
by
thefollowing
equation:_
/
((x-xo)cos(6)
-(y
-yo)sin(0))2
((x
-x0)sin(6) +
(y
-y0)cos(9)f
&v-expy
a2~
b2
(4.1)
where a2
and b2 specifythe lengthalong the major and minor axes,
(xq,
yo)isthe center ofthe
Gaussian,
and 6is its orientation. The x and y coordinatesare chosen randomly such that the Gaussian occurs within the retinal area
of size RxR. 9 is also chosen randomly such that 0 < 6 < 180. A random
number of Gaussians occur within each iteration of training. In order that
Chapter 4. A Model ofMotion Processing: DS-LISSOM 36
(a) ON Center Surround Gaussian (b) OFF Center Surround Gaussian
Figure 4.2: These images are examples ofthe oriented Gaussianswhich are used
as the afferent weights from the input image to the LGN. These act as simple edge
detectorsas it is thought theRetinalGanglion cellsdo.
are specified to be at least
dr
units apart. Later chapters will discuss the advantage of
training
the system on specific images in order to solicit significantresponses when
looking
for novelty.Once the system is considered to move into the postnatal stage (after
ap-proximatly 1,000 to 10,000 prenatal iterations for a general
learning
system)the retinal activation is a response to real input images. These images are
converted to grayscale
images,
which account forintensity
contrast information. Experiments have shown that it is the lum