APPLICATION OF CONVERTED MODE FOR DEFECT DEFECTION IN PLATE
MOHAMAD IZREEN BIN ABD RAZAK
APPLICATION OF CONVERTED MODE FOR DEFECT DEFECTION IN PLATE
MOHAMAD IZREEN BIN ABD RAZAK
This report is submitted
In fulfillment of the requirement for the degree of Bachelor of Mechanical Engineering (Plant and Maintenance)
Faculty of Mechanical Engineering
UNIVERSITI TEKNIKAL MALAYSIA MELAKA
i
DECLARATION
I declare that this report entitled “Application of Converted Mode for Defect Defection in Plate” is the result of my own research except summaries and quotations which have been
acknowledged. The report has not been accepted for any other degree and is not concurrently
submitted in candidature of any other degree.
Signature : ...
Name : Mohamad Izreen Bin Abd Razak
ii APPROVAL
I hereby declare that I have read this project report and in my opinion this report is sufficient
in terms of scope and quality for the award of the degree of Bachelor of Mechanical
Engineering (Plant and Maintenance).
Signature : ...
Name of Supervisor : Dr Nor Salim bin Muhammad
iii
DEDICATION
I would like to dedicate to
My father,
ABD RAZAK BIN ABAS
My mother,
RAHIMAH BT NAWAWI
My supervisor,
DR. NOR SALIM BIN MUHAMMAD
and
All my friend,
i ABSTRACT
ii ABSTRAK
iii
ACKNOWLEDGEMENT
In the name of Allah, most Gracious, most Compassionate. I would like to express my
full gratitude to Allah for granting me the best condition of health and strength in completing
my final year project. Special thanks to my supervisor, Dr. Nor Salim bin Muhammad for his
moral supports, commitment to the students and continuous guidance in helping completing
my final year project in these two semesters. Besides that, special appreciation to the technical
staff En. Azhar for his commitment in helping by using the laboratory equipment .I also would
like to appreciate to all my friends for giving me a full assistance and additional knowledge in
helping me to complete my research. Not to forget my beloved mother and father who have
encouraged me during their life to learn until this high levels and also to my beloved family
for their understanding the time I to sacrifice in this semester and also previous semester for
my research. Thank you for their priceless moral support that they gave me. Last but not least,
appreciation to Universiti Teknikal Malaysia Melaka for giving the chance to me to complete
iv
TABLE OF CONTENT
ABSTRACT i
ABSTRAK ii
ACKNOWLEDGEMENT iii
LIST OF FIGURES vi
LIST OF TABLES x
LIST OF ABBEREVATIONS xi
LIST OF SYMBOL xii
CHAPTER 1
1. INTRODUCTION 1
1.1 Background Study 1
1.2 Problem Statement 4
1.3 Objectives 5
1.4 Scope of Works 5
2 LITERATURE REVIEW 6
2.1 Overview 6
2.2 Ultrasonic Guided Waves 6
2.3 Lamb Waves 8
2.3.1 Phase Velocity And Group Velocity 11
v
2.4 Mode Conversion 16
2.5 Snell’s Law 17
3. METHODOLOGY 21
3.0 Overview Methodology 21
3.1 Experimental Flowchart 23
3.2 Specification Of The Lamb Wave
Tools And Apparatus 24
3.3 Casing Design. 27
3.4 Wave Excitation And Measurement 28
3.5 Mode Selection 30
3.6 Shoes Design 32
3.6.1 Explanation On Shoes Design 32
3.6.2 Calculation For Shoes Design 34
3.7 Defect Location 36
3.8 Matching Layer Testing. 39
4. RESULTS AND DISCUSSION 41
4.1 Overview 41
4.1.1 Mode Identification And Defect Location 41
4.2 Result Of 2mm Plate Defect By Using Acrylic Shoes. 45
4.2.1 Comparison Of S0 Mode And A0 Mode On 2mm
Defect Using Acrylic Shoes. 47
4.3 Result Of 2mm Defect By Using Aqualane Shoes. 50
vi
Defect Using Aqualane Shoes. 52
4.4 Result Of 3mm Defect By Using Acrylic Shoes. 55
4.4.1 Comparison of S0 mode and A0 mode on 3mm
defect using Acrylic Shoes. 57
4.5 Result Of 3mm Defect By Using Aqualane Shoes. 60
4.5.1 Comparison of S0 mode and A0 mode on 3mm
defect using Aqualane Shoes. 62
4.6 Result Of 4mm Defect By Using Acrylic Shoes. 65
4.6.1 Comparison of S0 mode and A0 mode on 4mm
defect using Acrylic Shoes. 67
4.7 Result Of 4mm Defect By Using Aqualane Shoes. 70
4.7.1 Comparison of S0 mode and A0 mode on 4mm
Defect using Aqualane Shoes. 72
4.8 Conversion Mode on Plate Defect 75
5. CONCLUSION AND RECOMMENDATION 78
5.1 Conclusion 78
5.2 Recommendation. 79
REFERENES 80
vii
LIST OF FIGURES
NO TITLE PAGE
1.1 Damaged vessel wall due to damaged sealing mechanism. 2
1.2 Ultrasonic testing and Guided Wave testing. 3
2.1 Guided wave Inspection with angle beam excitation. 7
2.2 Technique of generating guided wave. 8
2.3 Symmetric and Anti-symmetric mode 9
2.4 Lamb wave generation with an angle beam transducer. 10
2.5 Phase and Group Velocity Wave 11
2.6 The dispersion curves for an aluminum plate: (a) group velocity
for aluminum plate and (b) phase velocity dispersion curves. 13
2.7 Different guided wave mode cause different vibration fields
in plate. 14
2.8 Finite element of A-mode (top) and S-mode (bottom) Lamb
waves in plates. 15
2.9 (a) S0 and A0 mode Structure (b) S0 mode structure
(c) A0 mode structure 16
2.10 Reflected waves from flaw for excitation of S0 mode at 100 kHz 17
viii
2.12 Longitudinal wave velocity and shear velocity. 19
3.1 Experimental Process Flowchart 22
3.2 Male and Female of the Aluminum Case 26
3.3 Aluminum Casing. 26
3.4 Aluminum Plate with groove. 27
3.5 Block Diagram to develop the excitation of wave. 28
3.6 Group Velocity of Dispersion Curve 29
3.7 Phase Velocity of Dispersion Curve 30
3.8 Position of Shoes and Transducer on Plate. 31
3.9 Refraction angle of different material on Snell’s Law. 32
3.10 Transducer for Angle beam. 33
3.11 Shoes design by Plexiglass 34
3.12 Shoes design by Aqualene. 35
3.13 Important point in calculating defect 35
3.14 Example of dispersion curve graph that shown the group velocity 36
of the wave propagated at the aluminum plate by referring the
graph S0.
3.15 Structure of PZT Transducer 38
3.16 Type of Matching Layer; (a) Acrylic Matching Layer,
(b) Aluminum Matching Layer 39
4.1 Declaration of Waveform Graph. 42
4.2 Time obtain from LabVIEW software. 43
4.3 80 kHz for 2mm defect using acrylic shoes. 44
ix
4.5 120 kHz for 2mm defect using acrylic shoes. 45
4.6 Time range in S0 mode defect of 2mm using acrylic shoes. 46
4.7 Time range in A0 mode defect of 2mm using acrylic shoes 48
4.8 80 kHz for 2mm defect using Aqualane shoes. 49
4.9 100 kHz for 2mm defect using Aqualane shoes. 50
4.10 120 kHz for 2mm defect using Aqualane shoes. 50
4.11 Time range in S0 mode defect of 2mm using Aqualane shoes. 51
4.12 Time range in A0 mode defect of 2mm using Aqualane shoes. 53
4.13 80 kHz for 3mm defect using acrylic shoes. 54
4.14 100 kHz for 3mm defect using acrylic shoes. 55
4.15 120 kHz for 3mm defect using acrylic shoes. 55
4.16 Time range in S0 mode defect of 3mm by using acrylic shoes. 56
4.17 Time range in A0 mode defect of 3mm using acrylic shoes. 58
4.18 80 kHz for 3mm defect using Aqualane shoes. 59
4.19 100 kHz for 3mm defect using Aqualane shoes. 60
4.20 120 kHz for 3mm defect using Aqualane shoes. 60
4.21 Time range in S0 mode defect of 3mm using Aqualane shoes. 61
4.22 Time range in A0 mode defect of 3mm using Aqualane shoes. 63
4.23 80 kHz for 4mm defect using acrylic shoes. 64
4.24 100 kHz for 4mm defect using acrylic shoes. 65
4.25 120 kHz for 4mm defect using acrylic shoes. 65
4.26 Time range in S0 mode defect of 4mm using acrylic shoes. 66
4.27 Time range in A0 mode defect of 4mm using acrylic shoes. 68
x
4.29 100 kHz for 4mm defect using Aqualane shoes. 70
4.30 120 kHz for 4mm defect using Aqualane shoes. 70
4.31 Time range in S0 mode defect of 4mm using Aqualane shoes. 71
xi
LIST OF TABLES
NO TITLE PAGE
2.1 Velocity Ultrasonic on Material 18
3.1 Matching Layer Testing with Different Shoes 39
4.1 S0 mode on 2mm Defect using Acrylic Shoes. 46
4.2 A0 mode on 2mm Defect using Acrylic Shoes. 47
4.3 S0 mode on 2mm Defect using Aqualane Shoes. 51
4.4 A0 mode on 2mm Defect using Aqualane Shoes. 52
4.5 S0 mode on 3mm Defect using Acrylic Shoes. 56
4.6 A0 mode on 3mm Defect using Acrylic Shoes. 57
4.7 S0 mode on 3mm Defect using Aqualane Shoes. 61
4.8 A0 mode on 3mm Defect using Aqualane Shoes. 62
4.9 S0 mode on 4mm Defect using Acrylic Shoes. 66
4.10 A0 mode on 4mm Defect using Acrylic Shoes. 67
4.11 S0 mode on 4mm Defect using Aqualane Shoes. 71
4.12 A0 mode on 4mm Defect using Aqualane Shoes. 72
xii
LIST OF ABBEREVATIONS
UT Ultrasonic Testing
NDT Non-Destructive Testing
PZT Piezoelectric Ultrasonic Transducer
S0 Symmetric Mode
A0 Anti-symmetric Mode
xiii
LIST OF SYMBOL
A0 = Anti-symmetric mode
S0 = Symmetric mode
= Incidence Angle
= Refracted angle
= Sound Velocity in Shoes
= Sound Velocity in aluminum plate
= Group Velocity
TX = Transmitter
Rx = Receiver
KHz = Kilohertz
1 CHAPTER 1
INTRODUCTION
1.1 Background Study
Non-Destructive Testing (NDT) is mainly use to testing, inspecting, and evaluating
materials or components without destroying the any part or the systems. It is often use for the
physical properties on resistance, fracture toughness, fatigue and ductility. One of the
Non-Destructive Test use is to inspecting pressure vessel in the industry. NDT methods use to
inspect the failure of the pressure vessels internal structure damage. The surface of
imperfection is invisible to be seen by eye. It does only can be detect by using NDT method. It
can detect if any corrosion, crack, and thickness of the wall pressure vessels happen.
Nowadays, many improvements on advanced technologies such as liquid penetrant testing,
magnetic particle testing, eddy-current testing and ultrasonic testing. It provides more accurate
assessments, reducing maintenance cost and seeding up turnaround times which can detect
smaller defects in more location. Guided-wave testing (GWT) can shoots on guided low
frequencies ultrasonic waves on pipes, section of tubes, pipes or other thick wall on the
pressure vessels. It’s can go through screening on detection of changes on the materials
properties because of corrosion or cracking around the circumference and the changes on cross
sectional area in its path. When it is place in a pipe, a wave collar emits waves that inspect
2
wave testing and others industries also are now beginning to take advantage on the ability of
the inspection on the inaccessible thick walled components and piping.
Figure 1.1: Damaged vessel wall due to damaged sealing mechanism.
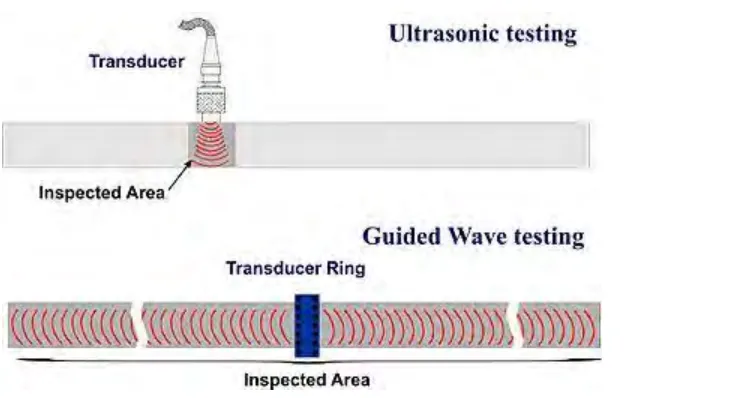
Ultrasonic Testing (UT) performs high frequency energy to organize examinations and
make measurements. Ultrasonic inspection can be used for dimensional measurements,
material characteristic, flaw detection and others. A typical pulse/echo inspection can be
illustrated by the general inspection. The pulser, transducer and display devices act as the
functional units on Ultrasonic Test inspection. Function of the pulser is to produce high
voltage electrical pulses. Sound energy penetrates through the wall or materials in form of
waves. If there is defect at the wave path, part of the energy will be reflected back from the
flaw surface. Electric signal will transform from the transducer by the reflected wave and will
[image:20.612.151.511.152.424.2]3
time from signal generation to when an echo was received. Signal travel time can be directly
related to the distance that the signal traveled. From the signal, information about the reflector
location, size, orientation and other features can sometimes be gained.
Figure 1.2: Ultrasonic testing and Guided Wave testing.
Guided waves is a wave the energy of which is concentrated near a boundary or
between parallel boundaries separating different materials and that has a direction of
propagation parallel to these boundaries. When the guided in plates, it is known as Lamb
waves which have high attention for larger area in Non Destructive Testing inspection. Similar
types of wave can also have in rods, cylinders and elongated structures which are not axially
symmetric such as railroad rails and I-beams. The examined or study on the public
infrastructure is to confirm that infrastructure does not suffer from aging early, cracking
[image:21.612.162.539.203.402.2]4
guided wave as inspection is one of good ways because these waves can propagate over longer
distances and can be used at low frequencies. Shoe or shoess is one of the guided wave
equipment. The position of shoess were located between transducer and specimen which it is
to improve the sensitivity for line contact with specimen. The shoess also used to stimulate the
symmetrical mode (S0-mode) and asymmetrical mode (A0-mode). By using different material
of shoess, it will transmit the different type of wave. In this experiment, the material of shoess
is acrylic for determine the S0-mode and elastomer material for the shoess to determine
A0-mode.
1.2 Problem Statement
S0 mode indicated the fastest wave velocity in Lamb wave propagation at low
frequency bandwidth, however the speed decrease rapidly when the frequency increase at the
vicinity of the A1 cutoff frequency. At the same time, A0 mode shows lower wave velocity at
low frequency bandwidth but has small wave dispersion characteristic as the S0 start having
large dispersion characteristic in Lamb wave propagation.
The use of S0 mode in low frequency bandwidth might simplify the complicated wave
structure due to its shortest travel time compared to A0 mode. However, low frequency
bandwidth has longer wavelength that will reduce the sensitivity of the defect inspection. The
use of A0 mode that has half of S0 mode wavelength is predicted to have higher sensitivity to
defects in structures.
Therefore, a combination of A0 and S0 mode is proposed to utilize the mode
5 1.3 Objectives
To study the behavior of wave interaction around defect by investigating the
mode conversion caused around defects in plates.
1.4 Scope of Works
1) To investigate the defect of plate with different depth by using conversion
mode.
2) To analyze the lamb wave by using symmetrical mode (S0-mode) and
asymmetrical mode (A0-mode).
3) To design shoes by using plexiglass for S0 mode and aqualene for A0-mode
4) To develop casing for the transducer.
6 CHAPTER 2
LITERATURE REVIEW
2.1 Overview
This chapter will discuss the literature review regarding on the application of converted
mode in detection in plate. This review will based on the past of journals, report, articles, and
references books that have been studied in order to understand the related topics for these
study. Besides that, this chapter will explain regarding on the topic of guided waves, snail
law, and dispersion curve.
2.2 Ultrasonic Guided Waves
Ultrasonic guided wave is a type of ultrasonic signal that propagates through the
boundaries. Guided waves can propagate in many type of boundaries such as thin plates, rods,
and multilayer structure. The Ultrasonic waves will reflect back and forth inside the
waveguide that will lead to the interference phenomena. Exciting an ultrasonic energy into a
plate with an angle and specific frequency, the waves reflect back and forth, mode of
conversion will occur.(Joseph L. Rose 2014). The setup of the experiment in determining in