Skills for self-employment:
Annex: LFS Analysis
Nigel Meager and Emanuela Carta
Institute for Employment Studies
UKCES Project Manager
Stephen Davison
Table of Contents
Annex: Analysis of Labour Force Survey Data ... iii
1
Trends in self-employment... 3
1.1 Aggregate self-employment ... 3
1.1.1 Self-employment in the 1980s ... 6
1.1.2 Self-employment in the 1990s ... 7
1.1.3 Self-employment since 2000 ... 9
1.1.4 International comparisons ... 9
2
Characteristics of the self-employed ... 13
2.1 Personal characteristics ... 13
2.1.1 Gender... 13
2.1.2 Age ... 16
2.1.3 Disability ... 20
2.1.4 Ethnic origin ... 23
2.1.5 Marital/family status ... 25
2.2 Employment characteristics ... 26
2.2.1 Mode of self-employment... 26
2.2.2 Sector ... 27
2.2.3 Occupation ... 29
2.2.4 Occupation within sector ... 33
2.2.5 Working time ... 35
2.2.6 Location of work ... 38
2.2.7 Employment of others ... 39
2.2.8 Jobsearch activity ... 41
2.4 Geographical variation in self-employment rates ... 47
3
Education, training and skills ... 50
3.1 Qualification level ... 50
3.1.1 Highest qualification held ... 50
3.1.2 Self-employment rates by highest qualification held ... 55
3.1.3 Gender variation in qualification levels ... 56
3.2 Age left full-time education ... 58
3.3 Current education and training ... 59
4
Multivariate analysis ... 62
Table of charts and figures
Figure 1.1 Self-employment: UK, 1984-2009 ... 4
Figure 1.2 Self-employment rate: UK, 1984-2009 ... 4
Figure 1.3 Self-employment rate and unemployment rate: UK, 1984-2009 ... 5
Figure 1.4 Self-employment rates across OECD countries, 2008 ...10
Figure 1.5 Change in self-employment rate, 2000-2009 ...11
Figure 1.6 Change in self-employment level, 2000-2009 ...11
Figure 2.1 Self-employment rates by gender: 2010 ...13
Figure 2.2 Self-employment rates by gender: 1984-2009...14
Figure 2.3 Ratio between male and female self-employment rates (1984-2009) ...15
Figure 2.4 Trends in total self-employment by gender (2000-2009) ...16
Figure 2.5 Self-employment rates by age: 2010 ...17
Figure 2.6 Changes in self-employment (2005-07 and 2007-10), by age group ...19
Figure 2.7 Self-employment rates by disability: 2010 ...20
Figure 2.8 Self-employment rates by disability category: 2010 ...21
Figure 2.9 Changes in self-employment (2005-07 and 2007-10), by disability status ...23
Figure 2.10 Self-employment rates by ethnic origin 2010 ...24
Figure 2.11 Self-employment rates by ethnic origin 2010 (Asian sub-groups) ...25
Figure 2.12 Self-employment rates by marital status 2010 ...26
Figure 2.13 Self-employed by mode of self-employment, 2010 ...27
Figure 2.14 Self-employment rates by sector (SIC07), 2010 ...28
Figure 2.15 Trends in self-employment rates by sector (SIC92), 1997-2009 ...29
Figure 2.16 Self-employment rates by occupation (SOC 2000), 2010 ...31
Figure 2.17 Trends in self-employment rates by occupation (SOC2000), 1997-2008 (professional and non-manual occupations)...32
Figure 2.18 Trends in self-employment rates by occupation (SOC2000), 1997-2008 (manual occupations).. ...32
Figure 2.19 Total weekly working hours: employees and self-employed, 2010 ...36
Figure 2.20 Total weekly working hours: employees and self-employed, 2010 (by gender) ....37
Figure 2.21 Total weekly working hours: employees and self-employed, 2005 and 2010 ...38
Figure 2.22 Main place of work: employees and self-employed, 2010 ...39
Figure 2.23 Main place of work: self-employed by gender, 2010 ...39
Figure 2.24 Self-employed who employ others, by gender (2005, 2007, 2010) ...40
Figure 2.25 Whether engaged in job-search, 2010 ...42
Figure 2.26 Nature of job-search (new or additional job), 2010 ...43
Figure 2.27 Whether engaged in job-search (2005, 2007, 2010) ...44
Figure 2.29 Self-employment rates by region, 2010 ...48
Figure 2.30 Changes in self-employment (2005-07 and 2007-10), by region ...49
Figure 3.1 High qualifications by sector and employment status, 2010 ...53
Figure 3.2 Absence of qualifications by sector and employment status, 2010 ...53
Figure 3.3 High qualifications by occupation and employment status, 2010 ...54
Figure 3.4 Absence of qualifications by occupation and employment status, 2010 ...55
Figure 3.5 Self-employment rates by highest qualification held, 2010 ...56
Figure 3.6 Self-employment rates by level of highest qualification held, 2010 ...56
Figure 3.7 Highest qualification held by the self-employed, by gender, 2010 ...57
Figure 3.8 Level of highest qualification held by the self-employed, by gender, 2010 ...58
Figure 3.9 Age of completion of full-time education by employment status, 2010 ...58
Figure 3.10 Current studying and recent training, by employment status, 2010 ...59
Figure 3.11 Job-related training in last 3 months, by employment status (2005, 2007, 2010).. 61
Table 2.1 Self-employment rates by age (2005, 2007, 2010) ...18
Table 2.2 Self-employment rates by disability status (2005, 2007, 2010) ...22
Table 2.3 Distribution of self-employed and employees by sector (SIC 2007), 2010 ...28
Table 2.4 Distribution of self-employed and employees by occupation (SOC 2000), 2010.. 30
Table 2.5 Self-employment rates by sector (SIC07) and occupation (SOC 2000), 2010 ...34
Table 2.6 ‘Hotspots’ of self-employment (occupations within sectors), 2010 ...35
Table 2.7 Number of people employed by the self-employed, 2010 ...41
Table 2.8 Reasons for looking for a different job, 2010...43
Table 2.9 12 month transition matrix between labour market statuses (2009-2010) ...46
Table 3.1 Highest qualification held by employment status, 2010 ...51
Table 3.2 Level of highest qualification held by employment status, 2010...52
Annex: Analysis of Labour Force Survey Data
This Annex presents an analysis of Labour Force Survey data, to provide descriptive
statistics on the nature and extent of self-employment in the UK. Key points emerging from
this analysis include:
•
Self-employment grew strongly in the 1980s, stagnated and fell back in the 1990s, andhas been growing again since 2000, including during the recent recession. There is
some evidence that the special factors driving self-employment growth in the 1980s were
not present to the same extent in the more recent period. It is possible, therefore, that the
current growth may prove to be more sustainable than that of previous decades.
•
The self-employment rate in the UK (13 per cent of all employment), is below the OECDand EU average, but the UK is one of only a few developed economies in which
self-employment has been growing in recent years.
•
Men are twice as likely to be self-employed as women, but the gap has narrowed inthe last decade.
•
The self-employment rate increases strongly with age, and is highest among peopleover normal retirement age. Since 2007 self-employment has grown among people aged
45-plus, but has fallen back among younger groups.
•
Disabled people are somewhat more likely to be self-employed than non-disabledpeople. It is not clear how much this reflects potential flexibility which self-employment
offers to disabled people, and how much it reflects lack of ‘regular’ job opportunities.
•
There is variation in self-employment rates between ethnic groups, but the patterns are complex, reflecting a variety of influences for different sub-groups, including ‘ethnicpenalties’ in waged employment, regional and sectoral effects, and cultural and other
background influences.
•
Self-employment has a very different sectoral and occupational distribution from waged employment.□ Self-employment is particularly concentrated in construction, agriculture and
level of self-employment in construction was artificially boosted through sub-contracting arrangements, and has fallen following changes to the income tax regime, targeted at tackling ‘false self-employment’ in this sector.
□ At an occupational level, self-employment is particularly concentrated in skilled
manual occupations, and the rate and level of self-employment in these (and some
other manual) occupations have been growing in recent years, while the trend in managerial, professional and non-manual occupations has been static or downward.
•
Compared with employees, the self-employed are over-represented among thosewith long working hours (50+ per week) and, to a lesser extent, among those with short
working hours (20 or fewer). Self-employed men are more common in the long working
hours groups, and self-employed women in the short working hours groups. As with
employees, self-employed working hours have fallen somewhat in the recession.
•
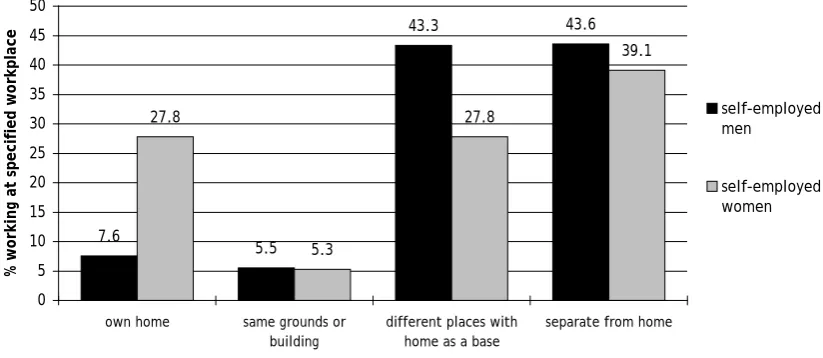
The self-employed are much more likely to work at home or with home as a base,than are employees. This is particularly the case for self-employed women.
•
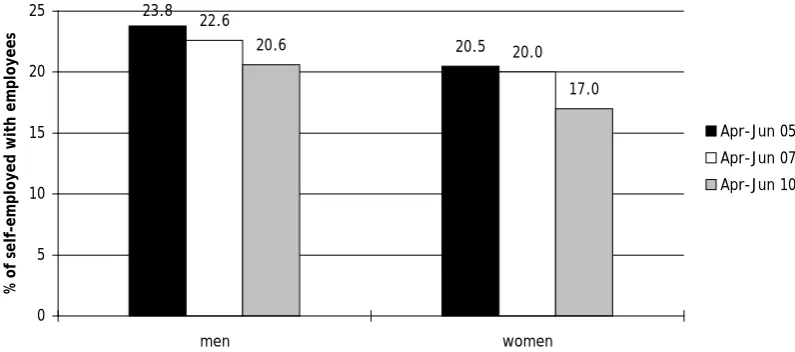
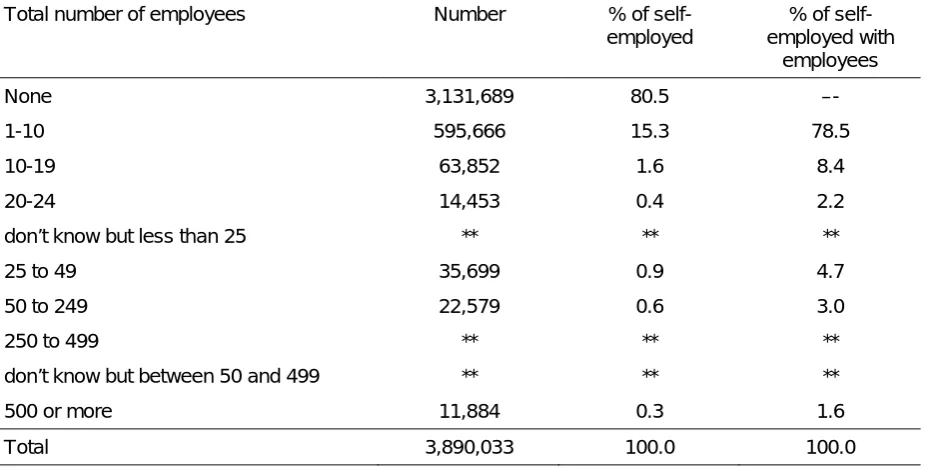
Fewer than one in five self-employed people have employees. This proportion hasfallen as overall employment levels have increased. Over three quarters of the
self-employed with employees have 10 or fewer, and half employ only one or two staff.
•
The self-employed are much less likely than employees to be looking for a differentor additional job, although this proportion has increased in the recession.
•
Self-employment rates vary widely between UK regions, with the highest rate inLondon at 16.2 per cent, and the lowest rate in the North East at 9.7 per cent.
•
The self-employed are slightly less likely than employees to have higher levelqualifications (levels 3, 4 and above), and slightly more likely to have no
qualifications. The highest self-employment rates are among those with trade
apprenticeship qualifications and those with no qualifications. There are big gender
differences: self-employed women are much more likely than self-employed men to
have higher level qualifications (level 4 and above), and much less likely than
1
Trends in self-employment
1.1
Aggregate self-employment
After the second world war, across the industrialised world, there was a substantial and
apparently sustained decline in self-employment. In the UK, as in many other advanced
economies, however, this trend came to a halt, and was reversed during the 1980s. Indeed,
during the 1980s, the UK experienced one of the fastest rates of growth in self-employment
of any country. Over the decade 1979-1989, there was an historically-unprecedented rate of
growth in self-employment, with the level of self-employment almost doubling from 1.77
million to 3.43 million1
This resurgence of self-employment in the 1980s led to considerable interest from
policy-makers, and generated a debate about whether it represented a genuine growth in
entrepreneurial dynamism which would help create employment for workers displaced by the
recession of the early 1980s. The belief that some kind of sea change was underway was
reinforced by the fact that the level and rate of self-employment grew steadily in every year of
the 1980s, independently of the economic cycle (in particular, it grew strongly both during the
recessionary years up to 1985, and during the boom years in the second half of the decade). , and the self-employment rate (the proportion of all those in
employment who are self-employed) growing from 7.3 to 13.1 per cent (see Meager and
Bates, 2004).
This belief was quickly undermined, however, by the experience of the next decade.
Self-employment stagnated in the first half of the 1990s, and fell during the rest of the decade
(Figure 1.12
1
These data are from the Labour Force Survey (LFS) and cover Great Britain, rather than the UK as a whole. Elsewhere in this report we use more recent LFS data for the UK.
), despite the strong economic growth experienced from 1993 onwards.
2
Figure 1.1 Self-employment: UK, 1984-2009
2,000 2,500 3,000 3,500 4,000
1984 1987 1990 1993 1996 1999 2002 2005 2008
Se
lf-emp
loy
me
nt
(
00
0)
Source: Labour Force Survey (seasonally adjusted)
When the self-employment rate is examined (Figure 1.2), the contrast between the 1980s
and the 1990s is even more marked: overall employment grew strongly during the 1990s,
while self-employment stagnated. As a result, the self-employment rate fell from its peak of
nearly 14 per cent in the early 1990s, to below 12 per cent by the end of that decade.
Figure 1.2 Self-employment rate: UK, 1984-2009
10 11 12 13 14
Se
lf-emp
loy
me
nt
r
at
e (
%
More recently, since 2000, however, the trends in both the level and the rate of
self-employment have once more been upward, and again largely independent of the economic
cycle. Thus self-employment grew during the period of economic growth until 2007, but it
continued to grow following the banking crisis, and the recession which began in early 2008.
Figure 1.3 confirms the lack of any clear relationship between the self-employment rate and
the aggregate unemployment rate over the last quarter century. While there is a debate in
the literature about the extent to which self-employment growth reflects ‘unemployment push’
(i.e. a response to lack of job opportunities in the employee sector), it is unsurprising that
trends in total self-employment are not strongly linked to the economic cycle. As several
authors have pointed out (Meager 1992, Cowling and Mitchell 1997), the cycle has offsetting
impacts on inflows to and outflows from self-employment. Thus in a downturn, many
unemployed people may be encouraged to consider self-employment; at the same time,
however, the survival of many small businesses will be threatened and more people than
previously will leave self-employment. The net impact on the self-employment stock depends
on the relative sizes of the inflow and outflow effects and will vary with the strength and
timing of the downturn and the influence of other factors.
Figure 1.3 Self-employment rate and unemployment rate: UK, 1984-2009
0 2 4 6 8 10 12 14 16
1984 1986 1988 1990 1992 1994 1996 1998 2000 2002 2004 2006 2008
%
self-employment rate ILO unemployment rate
Source: Labour Force Survey (seasonally adjusted). Note that the unemployment rate is the working age unemployment rate
•
the 1980s: strong growth in self-employment (in the early ‘80s recession, and the late ‘80s boom);•
the 1990s: stagnant or falling self-employment, while the economy and labour market (post-1993) grew strongly; and•
post-2000: resumed self-employment growth, continuing during the recent recession.To put the third and most recent phase into context, and understand whether the growth in
self-employment is likely to be sustainable, it is worth briefly reviewing the evidence which
explains the first two phases. In particular it is of interest to understand whether and how the
recent growth in self-employment is similar or different to that of the 1980s.
1.1.1
Self-employment in the 1980s
There is a large literature on the 1980s self-employment upsurge (see, for example, Meager
et al., 1992; Campbell and Daly, 1992; Meager, 1993; Bryson and White 1997). The general
conclusion is that no single factor explains the 1980s experience, which was unusual in UK
historical terms and in comparison with other countries. To explain it, several inter-related
influences need to be taken into account, some of which were found in other countries, but
others were largely specific to the UK.
•
The economic cycle: in the deep recession of the early 1980s, the ‘unemployment push’effect dominated, and trends in aggregate self-employment were dominated by an inflow
effect; later in the decade, strong economic growth stimulated further inflows into
self-employment and reduced outflows, such that overall self-self-employment continued to grow.
•
Sectoral restructuring: the UK experienced rapid decline in employment in sectors withlow self-employment densities (such as manufacturing) and growth in some service
sectors in which self-employment was more prevalent. This shift more than outweighed
the impact of the continued decline in agriculture (which, although having a very high rate
represented ‘disguised employment’ or self-employment in name only (often being
associated with avoidance of tax and social security contributions): see Winch (1998).
Also in some other sectors, the decade saw a trend towards ‘contracting out’ of service
functions by large employers and the growth of franchising, and these shifts in the
contractual organisation of work contributed further to self-employment growth.
•
The UK’s regulatory framework for business start-up in this period was looser than inmany other European countries (such as Germany: Meager et al., 1992), such that
short-term self-employment inflows in the UK were more responsive to the economic and
structural pressures described above.
•
The UK’s market for credit and financial capital was also less strict in this period thanin many other countries, and underwent considerable relaxation due to financial
deregulation in the later years of the Thatcher regime. Taken alongside growing home
ownership and house price appreciation (with easy equity withdrawal from the housing
market), this contributed to an environment of easy access to capital for business
start-ups (see Cowling and Mitchell, 1997).
•
The UK was an early adopter of active labour market policies aimed at encouraging unemployed people to enter self-employment, and the Enterprise Allowance Scheme(EAS) was one of the largest such programmes in Europe in the 1980s. While
evaluations (Meager, 1996; Metcalf, 1998; Parker, 2004) suggest that such schemes had
limited effectiveness in creating sustainable opportunities for unemployed people, they
clearly contributed to the increased inflow to self-employment during the 1980s.
1.1.2
Self-employment in the 1990s
As noted above, the 1990s experience was dramatically different. In place of the steady
growth in employment, the early 1990s saw fluctuations in the level and rate of
self-employment, while from the middle of the decade both indicators fell steadily against the
background of vigorous economic growth and falling unemployment.
What accounts for the difference between the two decades? While no conclusive explanation
is found in the literature, researchers have put forward a range of hypotheses (see, for
•
Some specific factors underlying self-employment growth in the 1980s did not persist to the same extent in the 1990s. The trend towards outsourcing and contracting-out wasless marked and, especially in the construction sector, major changes in the enforcement
of the regime3
•
The market for start-up finance was tighter during the 1990s than in the 1980s, and thedepressed housing market of the early 1990s reduced the net wealth of many individuals. removed much of the incentive for shifts to self-employment. As a result,
self-employment in this sector fell dramatically.
•
The emphasis of active labour market policy shifted away from supporting self-employment, and the Business Start-up scheme (the successor to EAS) was phased outin the mid-1990s. Although the 1997 Labour Government’s New Deal programme
included a subsidised self-employment option, the take-up was on a much smaller scale
than EAS.
•
While the sectoral shift to services continued, it was less marked than in the 1980s, and indeed significant service sector job loss was a feature of the early 1990s recession.•
Finally (see Meager and Bates, 2001), the 1980s and early 1990s saw shifts in thecomposition of the self-employed: new inflows during this period were more likely to
be young, more likely to be female, and more likely to be drawn from the ranks of the
unemployed, and rather different from the profile of the traditional self-employed
entrepreneur. It is difficult to disentangle, from the research, the relative impact on
self-employment survival rates of personal characteristics on the one hand, and the nature of
the employment entered on the other. Nevertheless the changing profile of
self-employment inflows over this period raises the possibility that they included people with
personal and/or business characteristics associated with lower survival rates, and that
this contributed to the fading out of the 1980s self-employment surge.
1.1.3
Self-employment since 2000
Since 2000, self-employment has resumed its upward trend, and although the rates of
growth in both the level and rate of self-employment are below those of the 1980s, by 2009
self-employment had largely made up the ground it lost in the 1990s. Equally notable,
moreover, is the fact that self-employment continued its upward trend despite the marked
slackening in the economy and labour market since late 2007 (with a fall in GDP even
greater than that experienced in either of the last two recessions).
Unlike the 1980s, however, the recent return to self-employment growth has gone largely
unremarked in the research literature, although some descriptive articles have documented
the re-emergence of growth in the early part of the decade (see, for example: Lindsay and
Macaulay, 2004; Ormerod, 2007), and there is little evidence on the factors driving this new
trend. Despite this lack of evidence, two points are worth noting.
First, as in the 1990s, many of the factors identified as critical influences in the 1980s have
not been present in the same way or to the same extent. In particular, there has not been a
strong policy impetus to promote self-employment as an option for the unemployed (although
recently the coalition government has exhibited renewed interest in this).
Second, and given these differences, there is an important question about whether steady
self-employment growth over the last decade represents the start of a sustainable shift
towards entrepreneurship, in a way in which the 1980s upsurge turned out not to be. To
begin to address this question, we need to look in more detail at the characteristics of the
current stock of self-employed and how they have been changing. Before turning to this
question (in section 2 below), however, it is worth briefly comparing the UK’s recent
experience with that of other countries.
1.1.4
International comparisons
Figure 1.4 presents self-employment data for 2008 for a range of OECD countries showing
that, at 13.4 per cent, the UK rate lies below the OECD average (15.8 per cent) and the
average for the EU 27 (16.5 per cent). Those OECD countries with particularly high rates of
self-employment (over 20 per cent), tend to be lower income countries (such as Turkey or
or eastern European countries with large agricultural sectors, such as Greece, Italy, Portugal
or Poland).
Figure 1.4 Self-employment rates across OECD countries, 2008
16.5 15.8
13.4
0 5 10 15 20 25 30 35 40 45
TK EL MEXKOR IT PT PL ES IE NZEU27 CZOECD BE AT SK UK NL JAP FI IS HU AUS DE SWI SE CAN FR DK NO US LU
Se
lf-emp
loy
me
nt
r
at
e (
%
)
Source: OECD Statistics Database, Annual Labour Force Statistics
Looking at OECD data for the 2000-2009, however (Figure 1.5), the UK is one of only nine
countries recording a growth in the self-employment rate. In most countries, and in the
OECD and EU27 as a whole, the period saw declining rates of self-employment.
Clearly it is possible that a rapid growth in the self-employment rate, particularly in a
recession such as that experienced recently does not represent a genuine upsurge in
self-employment, but is simply due to the denominator (total self-employment, which mainly consists
of employee-status employment) falling more rapidly than self-employment (the numerator).
To check this possibility, therefore, Figure 1.6 repeats the cross-country analysis of Figure
1.5, but looks at changes in self-employment levels rather than rates. The overall picture is
very similar, as is the ranking of countries, and the UK remains among the minority of
Figure 1.5 Change in self-employment rate, 2000-2009
SK
NL CZ NO
DE UK DK SE AT
FI FR US IE MEX BE PT
CAN IT
AUS EL ES PL HU KORSWI LU NZ TK JAP IS EU27 OECD -40 -20 0 20 40 60 80 100 ch an ge in se lf-emp loy me nt r at e ( % )
Source: OECD Statistics Database, Annual Labour Force Statistics Note: data for France, Luxembourg and OECD total refer to 2000-2008.
Figure 1.6 Change in self-employment level, 2000-2009
SK
NL NO
CZ
SE DE UK AT IE MEXLU DK FI FR ES CAN
EU27 IT NZ EL PT PL KOR SWI
HU
TK JAP IS OECD BE AUS US -40 -20 0 20 40 60 80 100 120 140 ch an ge in se lf-emp loy me nt le ve l ( % )
Source: OECD Statistics Database, Annual Labour Force Statistics Note: data for France, Luxembourg and OECD total refer to 2000-2008.
It is clear from internationally-comparative studies of this question (OECD, 2000;
Blanchflower, 2004), that explaining different rates of self-employment between countries,
•
the relative importance of the agricultural sector (typically the larger the agricultural sector, the larger the rate of self-employment);•
the overall level of economic development, including the importance of family businesses and the ‘black’ or ‘grey’ economy within a country’s overall economic structure (SouthernEuropean countries, and countries with lower levels of economic development tend to
have higher rates of non-agricultural self-employment);
•
countries’ sectoral structure outside agriculture (self-employment rates tend to be higher in some private service sectors and construction than in manufacturing and publicservices);
•
the policy, legislative and tax framework, including government policies aimed at supporting self-employment.Even when these factors are taken into account, as well as major economic shocks (some
post-communist countries exhibited rapid self-employment growth during the transition to a
market economy), as Blanchflower (2004) notes, the data show unexplained rises and falls in
the self-employment rate in individual countries over quite short periods, suggesting that
some caution should be exercised in drawing strong conclusions. Nevertheless, the recent
data presented above suggest that the UK has a relatively high rate of self-employment
compared with similar economies (from Figure 1.4 it can be seen that the UK has the highest
self-employment rate in the G7 countries, with the exception of Italy, whose self-employment
rate is heavily influenced by the role of agriculture and the informal economy, especially in
the south of the country); equally it is one of the few G7 economies that has experienced
growth in self-employment in recent years (as Figure 1.5 shows, Germany is the only other
G7 country with a growing self-employment rate, albeit from a lower level, partly reflecting a
considerable recent policy effort in that country in stimulating self-employment as a labour
2
Characteristics of the self-employed
2.1
Personal characteristics
In this section we look at demographic and household characteristics of the self-employed,
how the propensity to work as self-employed (rather than as an employee) varies with those
characteristics, and how these characteristics and propensities have varied over time4
2.1.1
Gender
.
As in nearly all countries for which data are available, the self-employment rate of men in the
UK is considerably higher than that of women: the male rate at 18 per cent is currently twice
the female rate at nine per cent (Figure 2.1).
Figure 2.1 Self-employment rates by gender: 2010
17.7
8.6
13.5
0 2 4 6 8 10 12 14 16 18 20
Men Women All
Se
lf-emp
loy
me
nt
r
at
e %
Source: Labour Force Survey (April-June quarter 2010)
4
Note that the LFS data were reweighted in 2009 (using population estimates for that year). Reweighted data are available on this basis back to the Jul-Sep 2006 quarter (see:
This is a persistent difference: Figure 2.2 shows that, in 1984, the rates were 14 and six per
cent respectively.
Figure 2.2 Self-employment rates by gender: 1984-2009
6 8 10 12 14 16 18 20
1984 1987 1990 1993 1996 1999 2002 2005 2008
se
lf-emp
loy
me
nt
r
at
e (
%
)
male female
Source: Labour Force Survey (annual data, seasonally adjusted)
There has, nevertheless, been some narrowing over time in the gap between the rates, as
shown by Figure 2.3, which looks at variations over time in the ratio between the male and
the female rate. While there have been many fluctuations in the ratio, looked at across the
whole period, it seems that the ratio tended to move up during self-employment growth in the
1980s (i.e. the male propensity to be self-employed grew faster than the female propensity).
Since around 1990, however, the ratio has tended to fall, both during the period of
self-employment decline in the 1990s and, interestingly, in the recent period of self-self-employment
growth since 2000. The ratio between the male and female self-employment rates has now
fallen back below the level it was at during the 1980s.
Thus, one key difference between the recent spell of self-employment growth and that of the
1980s, is that the recent trend is characterised by the female self-employment rate growing
Figure 2.3 Ratio between male and female self-employment rates (1984-2009)
2.0 2.1 2.2 2.3 2.4 2.5 2.6
1984 1986 1988 1990 1992 1994 1996 1998 2000 2002 2004 2006 2008
ra
ti
o of ma
le
t
o fe
ma
le
s
/e
r
at
es
Source: Labour Force Survey (annual data, seasonally adjusted)
It is, however, important not to exaggerate the differences between the recent experiences of
male and female self-employment. Figure 2.4 illustrates the trends since 2000, the point at
which aggregate self-employment began to increase again. The overall increase in female
employment over the period (22.8 per cent) was greater than the increase in male
self-employment (16.5 per cent). However, female self-self-employment initially fell, and has
increased by less than male self-employment throughout the period, until the last year
Figure 2.4 Trends in total self-employment by gender (2000-2009)
95 100 105 110 115 120 125
2000 2003 2006 2009
se
lf
-e
m
pl
oy
m
en
t i
nd
ex
(2
00
0 =
1
00
)
Male Female
Source: Labour Force Survey (annual data, seasonally adjusted)
2.1.2
Age
Another defining feature of self-employment in most countries and in most periods is that the
likelihood of being self-employed increases strongly with age. Data on self-employment
dynamics (e.g. from panel surveys: see, for example, Meager and Bates, 2004) also show
that the likelihood of self-employment entry tends to increase with age, while the likelihood of
self-employment exit declines with age (or, looking at it another way, the duration and
stability of self-employment increases with age). Many explanations have been put forward to
explain this pattern, but most rely on the notion that individual accumulations of capital tend
to increase with age, and that such accumulation may be both a precondition for
self-employment entry, and a factor enhancing survival chances in self-self-employment. This applies
both to certain kinds of human capital (e.g. skills and experience acquired in wage
employment) and to financial capital (e.g. savings or inheritance which help overcome entry
Figure 2.5 Self-employment rates by age: 2010
1.6
5.1 7.9 10.3
13.8 15.0 15.1 16.4 17.0
22.0 32.9
42.7
13.5
0 5 10 15 20 25 30 35 40 45
16-19 20-24 25-29 30-34 35-39 40-44 45-49 50-54 55-54 60-64 65-69 70+ All
Se
lf-emp
loy
me
nt
r
at
e %
Source: Labour Force Survey (April-June quarter 2010)
Figure 2.5 confirms this pattern in recent UK data, with self-employment rates increasing
dramatically with age, the highest rates being found among people above normal retirement
age. There are several likely reasons for this latter finding. First, the self-employed, without a
normal retirement age, have options to continue working into old age traditionally denied to
people in salaried employment (it will, therefore, be interesting to see what effect the
abolition of the default retirement rate for employees has on self-employment rates). Second,
many people move from employee to self-employed status in later life, in some cases as a
flexible route into retirement (the self-employed may, for example, have greater scope than
employees to vary the hours and location of their work as they age). Lastly, there is some
evidence (see, for example, Meager et al., 1996; Platman, 2003) that a significant group of
self-employed people face low incomes and poor pension entitlements in later life and may,
therefore, be less able than their employee counterparts to afford to retire.
Unfortunately there is no long-term consistent time series (such as that used in the overall
analysis and the analysis by gender in the previous sections) enabling us to break down
onset of the recent recession, by comparing data from the April-June quarter of 2010, with
the same quarter from 2007 (both weighted to 2009 population estimates)5
Table 2.1
.
shows the self-employment rate by age group (using broader age groups than
those presented in Figure 2.5 above) for the April-June quarter of 2005, 2007 and 2010
respectively. There is no consistent pattern: the self-employment rate of nearly all age
groups increased prior to the recession between 2005 and 2007 (the exceptions being the
55-64 age group for which it fell slightly, and the 45-54 age group for which it remained
constant); over the period of the economic downturn, self-employment rates continued to
increase for most groups, except for the 65-plus group and the 25-34 group, for which they
fell. When looking at changes over short periods of time, however, it is clear that changes in
the self-employment rate can be influenced not only by changes in the numerator
(self-employment), but also by changes in the denominator (total employment). In a recession,
therefore, self-employment rates may rise simply because employee jobs are being lost
faster than self-employment jobs.
Table 2.1 Self-employment rates by age (2005, 2007, 2010)
Age Self-employment rate (%)
April-June 2005 April-June 2007 April-June 2010
16-24 3.6 3.9 4.1
25-34 8.8 9.8 9.0
35-44 13.6 13.7 14.4
45-54 14.8 14.8 15.7
55-64 18.9 18.6 18.9
65+ 34.2 36.6 35.9
All ages 12.5 12.9 13.5
Source: Labour Force Survey (April-June quarters)
When looking at recent experience, therefore, it may be more useful to look at changes in the
total level of self-employment by age group, which provide a rather clearer pattern. As Figure
2.6 shows, all age groups experienced growth in self-employment over the 2005-7 period
immediately prior to the recession, with the growth being particularly marked in the 65-plus
age group and (to a somewhat lesser extent) among younger people (in the 16-24 and 25-34
age groups). Over the period of the economic downturn between 2007 and 2010, however,
the pattern changes significantly, with all of the younger groups (under 45) recording falls in
self-employment, while all of the groups aged 45 and above experienced self-employment
growth (and once again the strongest growth is among those aged 65-plus). While the
reasons for this pattern are not fully clear, it is possible that job loss in the recession has
encouraged middle-aged and older people to turn to self-employment as an alternative
(perhaps using redundancy payments to aid business start-up). Among younger groups, by
contrast, it seems that the recession may have reduced opportunities for business start-up.
Figure 2.6 Changes in self-employment (2005-07 and 2007-10), by age group
8.6 10.3
1.6 3.8 2.3
16.2
4.8
-4.6
-6.7
-1.4
12.0
2.0
28.7
3.5
-10 -5 0 5 10 15 20 25 30 35
16-24 25-34 35-44 45-54 55-64 65 plus Tota l
Age group
%
c
ha
ng
e i
n s
elf-emp
loy
me
nt
change 05-07 change 07-10
Source: Labour Force Survey (April-June quarters)
2.1.3
Disability
Disabled people in work are more likely than their non-disabled counterparts to be
self-employed (Figure 2.7). This is consistent with previous evidence for the UK (Jones and
Latreille, 2006) and more across European countries (Pagán, 2009).
Figure 2.7 Self-employment rates by disability: 2010
15.5
13.1
13.5
11.5 12 12.5 13 13.5 14 14.5 15 15.5 16
all disabled non-disabled All
Se
lf-emp
loy
me
nt
r
at
e %
Source: Labour Force Survey (April-June quarter 2010)
It is unclear how far the greater self-employment propensity among disabled people is a
positive factor (e.g. because self-employment offers a means for disabled people to adapt
their working environments to their impairments), and how far it reflects a negative choice in
response to discrimination by employers. It is, of course, possible that both factors are
relevant, and both are certainly highlighted as possibilities in the existing literature.
It is, however, possible to disaggregate the category ‘disabled’ in the LFS data. The LFS
uses two definitions of disability: ‘DDA disabled’ (i.e. according to the definition of the
Disability Discrimination Act) and ‘work-limiting disabled’ (based on the respondent’s own
Figure 2.8 further breaks this category down into three groups: those who meet both
definitions, those who meet the DDA definition only and those who meet the work-limiting
definition only.
Figure 2.8 Self-employment rates by disability category: 2010
17.3
13.6
16.3
15.5
10 11 12 13 14 15 16 17 18
DDA & work-limiting disabled
DDA disabled only W-L disabled only all disabled
Se
lf-emp
loy
me
nt
r
at
e %
Source: Labour Force Survey (April-June quarter 2010)
The DDA-only group records a significantly lower self-employment rate than either of the
other two, while the highest self-employment rate (over 17 per cent) is found among those
meeting both definitions. As noted by other authors (Meager and Hill, 2005; Riddell et al.,
2010), the three groups differ considerably in terms of their personal and labour market
characteristics. Thus, the DDA-only group (consisting of people who have a disability
according to the broad-DDA definition, but do not believe that this disability affects their
working life) enjoy a very high employment rate (it is even slightly higher than that of
non-disabled people), and are not significantly disadvantaged in employment terms. The other
two groups have much lower employment rates, and among the ‘DDA and work-limiting’
group in particular, only around a third are in work. As Riddell et al. (2010, p.8) note: “Clearly
those that are DDA and work limiting, a group which includes those who are severely
disabled, are at the greatest labour market disadvantage”.
It is interesting to note from Figure 2.8, that, among disabled people, this group with the
lowest overall employment rate records the highest self-employment rate. This suggests that
up in self-employment (whether because of the flexibilities it offers to them, or because it is
harder for them to find employee-status work).
Table 2.2 shows how self-employment rates for the different disability groups have evolved
over 2005-2007-2010.
Table 2.2 Self-employment rates by disability status (2005, 2007, 2010)
Disability status Self-employment rate (%)
April-June 2005 April-June 2007 April-June 2010
DDA & work-limiting disabled 15.9 18.0 17.3
DDA disabled only 12.0 11.5 13.6
work-limiting disabled only 15.3 16.1 16.3
all disabled 14.3 15.1 15.5
not disabled 12.3 12.6 13.1
Source: Labour Force Survey (April-June quarters)
Note that data from 2007 and 2010 are weighted to 2009 population estimates, while data from 2005 are weighted to 2007-8 and are not, therefore strictly comparable
Taking all disabled people, the self-employment rate has increased throughout the period, at
a slightly faster rate than that of non-disabled people. Among the other categories, however,
the pattern is less clear, and the ‘work-limiting disabled only’ group is the only one of the
three whose self-employment rate increased throughout the period. It is interesting to note
that for those people with both a DDA disability and a work-limiting disability (as noted above,
likely to be the most disadvantaged group), while the self-employment rate increased quite
strongly before the recession from 15.9 per cent in 2005 to 18.0 per cent in 2007, by 2010 it
had fallen back slightly to 17.3 per cent.
Once again it is also worth looking at the absolute changes in self-employment levels in each
group over this period, for a fuller picture (Figure 2.9). Taking all disabled people together,
self-employment grew faster than among non-disabled people both in the pre-recession
Figure 2.9 Changes in self-employment (2005-07 and 2007-10), by disability status
13.6
5.4 4.6
2.5
41.9
5.9
15.1
1.5 -0.5
-1.3
-5 0 5 10 15 20 25 30 35 40 45
DDA disabled & work-limiting
disabled
DDA disabled only
Work-limiting disabled only
All disabled Not disabled
%
c
ha
ng
e i
n s
elf-emp
loy
me
nt
change 05-07 change 07-10
Source: Labour Force Survey (April-June quarters)
Note that data from 2007 and 2010 are weighted to 2009 population estimates, while data from 2005 are weighted to 2007-8 and are not, therefore, strictly comparable
2.1.4
Ethnic origin
There is some variation in self-employment rates between ethnic groups (Figure 2.10). The
highest rates (over 15 per cent) are among those of Chinese origin and those from ‘other’
ethnic groups, while the lowest (10.6 per cent) are among those of Black/Black British origin.
The self-employment rate among people of Asian/Asian British origin is very similar to that of
Figure 2.10 Self-employment rates by ethnic origin 2010
13.5
12.5
13.6
10.6
15.5 15.4
13.5
8 9 10 11 12 13 14 15 16
White Mixed Asian or Asian British
Black or Black British
Chinese Other ethnic groups
All
Se
lf-emp
loy
me
nt
r
at
e %
Source: Labour Force Survey (April-June quarter 2010)
It should be noted that this LFS analysis does not distinguish between immigrants and
British-born ethnic minorities. These groups are likely to face different barriers. Immigrants
are less likely to be fluent in English; are a self-selecting group (for example, may be more
willing to take risks) and are less likely to have established social networks, as compared
with British-born ethnic minorities (see Clark and Drinkwater, 2010). More generally, variation
between ethnic groups has a number of possible explanations. Different groups face varying
‘ethnic penalties’ in the labour market, which may reflect employer discrimination in the
labour market or other factors, such as social capital, not captured by quantitative data.
These penalties persist when other factors are taken into account, with Pakistani,
Bangladeshi, black Caribbean and black African individuals particularly affected (Heath and
Cheung, 2006). Our LFS data do not, however, control for differing characteristics, so a
variety of factors are likely to contribute to the variation across groups, including differing
language skills; trends in migration; and regional and sectoral effects.
It is clear that the different minority ethnic groups in this analysis are themselves somewhat
different groups moving into self-employment. It has been suggested, for example, that some
ethnic groups are more likely to undertake self-employment to take advantage of an
opportunity while others are motivated by necessity; in particular, unfavourable labour market
conditions. Thompson et al. (2010), using the Global Entrepreneurship Monitor, confirm
previous research suggesting that ethnic minority men – especially those from Pakistani
backgrounds – are more likely than white British counterparts to be ‘necessity’ rather than
‘opportunity’ entrepreneurs (although this differential is reduced for graduates).
Figure 2.11 Self-employment rates by ethnic origin 2010 (Asian sub-groups)
10.6
23.8
12.6
10.7
13.6
8 10 12 14 16 18 20 22 24 26
Indian Pakistani Bangladeshi Other Asian background
All Asian/British Asian
Se
lf-emp
loy
me
nt
r
at
e %
Source: Labour Force Survey (April-June quarter 2010)
2.1.5
Marital/family status
Figure 2.12 shows how self-employment rates vary by marital status. Much of the variation
appears due to the influence of age on self-employment. Thus single people tend, for
example, to be younger on average than those in the other categories, and are therefore be
less likely to be self-employed. Previous research (for example, Le, 1999) has however,
shown that marital status has an influence, independent of age, on the propensity to be
self-employed6
6
Note, however, that more recent multivariate analysis for the UK, using LFS, finds no statistically significant association between self-employment likelihood and marital status (Dawson et al. 2009).
, and it has been argued by some authors (Blanchflower and Oswald, 1990;
Bernhardt, 1994) that the presence of a spouse or partner (particularly if they are in
uncertain streams of income, especially in the early years of a start-up business. Thus Lin et
al. (2000), using Canadian data, show that steady family income through wage employment
from one spouse increases the self-employed's (the other spouse's) affordability to continue
with the business venture and reduces the likelihood of leaving self-employment.
Figure 2.12 Self-employment rates by marital status 2010
9.3
16.0
12.7
15.1
18.9
6.7
13.5
0 2 4 6 8 10 12 14 16 18 20
single, never married
married, living with spouse
married, separated from spouse
divorced widowed civil partnership
All
Se
lf-emp
loy
me
nt
r
at
e %
Source: Labour Force Survey (April-June quarter 2010)
2.2
Employment characteristics
In this section we look in a little more detail at the characteristics of the work that
self-employed people undertake and the nature of their businesses.
2.2.1
Mode of self-employment
In section 1.3 of the main report, we discuss the heterogeneity of the self-employed and
variety of forms of activity (some much closer to employee status than others) typically
captured by the broad term ‘self-employed’. Since 2008, the LFS includes a question
throwing some light on this, by looking at how the self-employed receive their incomes.
Figure 2.13 Self-employed by mode of self-employment, 2010
2.0 10.8
24.5 16.5
71.0 11.6
13.5
0 10 20 30 40 50 60 70 80
paid salary/wage by employment agency sole director of own limited business running business or professional practice partner in business or professional practice working for self sub-contractor freelancer
% of self-employed in category
Source: Labour Force Survey (April-June quarter 2010)
Note: percentages sum to greater than 100%, as respondents could give more than one answer
Further information on the diversity of self-employment and trends in its composition can be
obtained through analysis of data at sectoral and occupational level, to which we now turn.
2.2.2
Sector
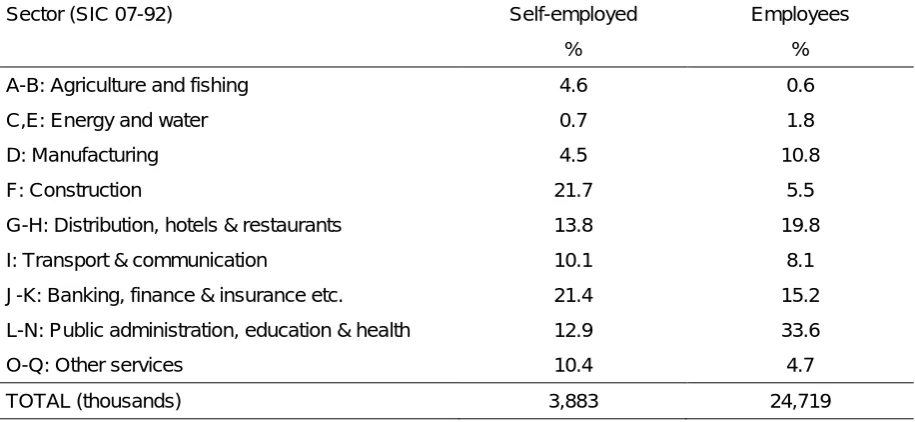
The sectoral concentration of the self-employed is very different from that of employees
(Table 2.3). Compared with employees they are much more likely to be found in construction,
agriculture and ‘other services’, somewhat more likely to be found in the banking, finance
and business services sectors, and much less likely to be found in manufacturing, distribution
These differences are revealed even more starkly through an examination of sectoral
self-employment rates (Figure 2.14). Over half of agricultural workers, nearly 40 per cent of
construction workers, and a quarter of those working in ‘other services’ are self-employed. By
contrast only just over one in twenty of workers in energy/water, manufacturing and public
administration/education/health are self-employed.
Figure 2.14 Self-employment rates by sector (SIC07), 2010
53.0 5.5
6.1
38.2 9.8
16.3 18.1 5.6
25.6 13.5
0 10 20 30 40 50 60
agriculture, forestry & fishing energy & water manufacturing construction distribution, hotels & restaurants transport & communication banking & finance public admin, education & health other services all
self-employment rate %
Sector (SIC 07-92) Self-employed Employees
% %
A-B: Agriculture and fishing 4.6 0.6
C,E: Energy and water 0.7 1.8
D: Manufacturing 4.5 10.8
F: Construction 21.7 5.5
G-H: Distribution, hotels & restaurants 13.8 19.8
I: Transport & communication 10.1 8.1
J-K: Banking, finance & insurance etc. 21.4 15.2
L-N: Public administration, education & health 12.9 33.6
O-Q: Other services 10.4 4.7
TOTAL (thousands) 3,883 24,719
[image:34.595.68.526.108.319.2]Figure 2.15 uses historical LFS data for the period since 1997 (not directly comparable with
the cross-sectional LFS data used elsewhere in this report), to look at trends in sectoral
self-employment rates. While self-self-employment rates in most sectors have fluctuated over time,
there are few clear trends in the data, and the dominant feature is that the ranking of sectors
is markedly stable.
Figure 2.15 Trends in self-employment rates by sector (SIC92), 1997-2009
0 10 20 30 40 50 60
1997 1999 2001 2003 2005 2007
se
lf-emp
loy
me
nt
r
at
e (
%
)
agriculture & fishing
manufacturing
construction
distribution, hotels and restaurants
transport & comms
banking, finance & insurance etc.
public admin, education & health
other services
Source: Labour Force Survey (LFS) Historical Quarterly Supplement Note: Energy and water sector excluded due to gaps in data series
The only marked trend in Figure 2.15 is the decline in the construction self-employment rate
in the late 1990s (related to the changes in the tax regime mentioned earlier); it is interesting
to note, however, that the rate has subsequently started to drift up, which may underly the
recent HMRC consultation on further measures to reduce ‘false self-employment’ in the
sector (HM Treasury, 2009). Also apparent is a less striking, but steady decline in
self-employment in distribution, hotels and restaurants. This may reflect shifts in the structure of
the sector, characterised (especially in retailing) by growing concentration, with gradual
displacement of small family-owned establishments by large retail and catering chains.
2.2.3
Occupation
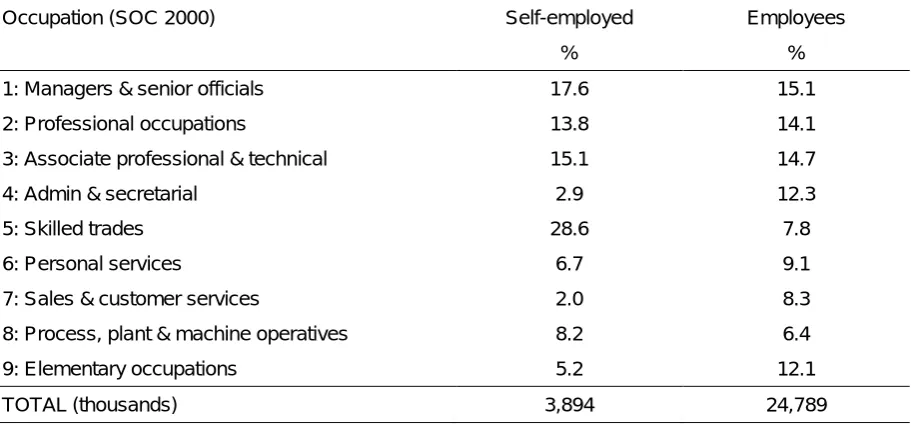
The occupational distribution of the self-employed is, like the sectoral distribution, markedly
concentration of the self-employed in skilled trades, and correspondingly smaller proportions
in administrative and secretarial occupations, sales and customer service occupations and
[image:36.595.70.526.196.408.2]elementary occupations.
Table 2.4 Distribution of self-employed and employees by occupation (SOC 2000), 2010
Occupation (SOC 2000) Self-employed Employees
% %
1: Managers & senior officials 17.6 15.1
2: Professional occupations 13.8 14.1
3: Associate professional & technical 15.1 14.7
4: Admin & secretarial 2.9 12.3
5: Skilled trades 28.6 7.8
6: Personal services 6.7 9.1
7: Sales & customer services 2.0 8.3
8: Process, plant & machine operatives 8.2 6.4
9: Elementary occupations 5.2 12.1
TOTAL (thousands) 3,894 24,789
Source: Labour Force Survey (April-June quarter 2010)
Figure 2.16 reinforces this picture, confirming that skilled trades stand out as the
occupational group with the highest self-employment density (over a third of workers in these
occupations are self-employed), while at the other extreme, the lowest self-employment rates
Figure 2.16 Self-employment rates by occupation (SOC 2000), 2010
15.4 13.3
13.8 3.5
36.2 10.2
3.6
16.7 6.2
13.5
0 5 10 15 20 25 30 35 40
managers professionals associate professionals admin & secretarial skilled trades personal services sales & customer services process, plant & machine operatives elementary occupations all
self-employment rate %
Source: Labour Force Survey (April-June quarter 2010)
Figure 2.17 and Figure 2.18 present recent historical data (since 1997) on trends in
self-employment rates by occupation (Figure 2.17 contains data for non-manual occupations and
Figure 2.18 the occupations with a significant manual or ‘blue collar’ component). In most
non-manual occupations the trends in self-employment rates are flat, or downwards (the
trend being most marked in the managerial and sales/customer service groups). By contrast,
in the manual occupations, the trends are flat or upwards (in particular there is a strong
upward trend in skilled trades and among process, plant and machine operatives). It is not
immediately clear what is driving these trends, but they are of clear interest, not least
because they seem to contradict received wisdom among some commentators regarding the
recent upsurge in self-employment, for example: “….whereas the phenomenon used to be
found mainly in skilled manual trades, today more white-collar workers such as consultants
are opting to be self-employed.” (Ian Brinkley of The Work Foundation, cited in Financial
Times, 2010)
This picture is not altered by looking at the absolute numbers of self-employed (rather than
self-employment rates). It is true that there has been some growth in self-employment among
professionals and associate professionals, but this simply reflects an overall employment
growth in these occupations, rather than any shift towards self-employment (if anything, as
occupations). This is very much in contrast to the skilled trades which show both a strong
growth in absolute numbers of self-employed and a growing self-employment rate.
Figure 2.17 Trends in self-employment rates by occupation (SOC2000), 1997-2008
(professional and non-manual occupations)
0 5 10 15 20 25
1997 1999 2001 2003 2005 2007
Se lf-emp loy me nt r at e ( % ) managers professionals associate professionals admin & secretarial sales & customer services
Source: Labour Force Survey (LFS) Historical Quarterly Supplement
Note: break in series in Mar 2001 due to shift in occupational classification from SIC 90 to SIC 2000
Figure 2.18 Trends in self-employment rates by occupation (SOC2000), 1997-2008 (manual
occupations) 0 5 10 15 20 25 30 35 40 Se lf-emp loy me nt r at e ( % ) skilled trades personal services
process, plant & machine operatives
2.2.4
Occupation within sector
To understand more fully the kinds of jobs in which self-employment is most common, it is
helpful to look below the levels of sector and occupation. It is clear that even in sectors
where self-employment is common (as indicated by a high self-employment rate), it is
concentrated in specific occupations. Similarly, when we look at occupations with high
self-employment rates, the rates for those occupations vary considerably between sector. In this
light, Table 2.5 looks at occupations within sectors, and reports the self-employment rates at
that level (e.g. within agriculture, it reports the self-employment rates among managers in
agriculture, professionals in agriculture, and so on). It is then possible to identify
self-employment ‘hotspots’ at this more detailed level (although cell sizes prevent us from looking
at all combinations of sector and occupation in this way). So, for example, if we define a
‘high’ density of self-employment as an occupation within a sector where more than a quarter
of workers are self-employed (remembering that the overall self-employment rate is 13.5 per
cent), there are some self-employment ‘hotspots’ in this sense in Table 2.5 (marked as
shaded cells in the table).
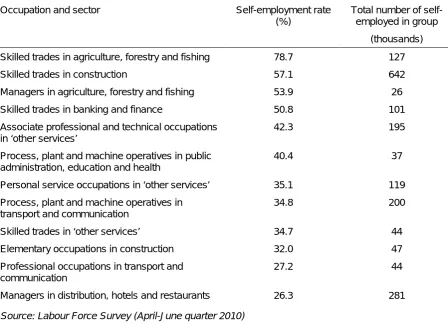
For clarity, we also list these occupational/sectoral hotspots in Table 2.6 below, along with
the absolute number of self-employed in that occupation/sector (clearly the contribution that
individual occupational/sectoral hotspots make to overall self-employment varies widely
according to the size of the occupational group within the sector in question). Thus while the
largest proportional concentration of self-employed is among skilled trades in agriculture
(where more than three quarters are self-employed), the total number of self-employed in this
group is only 127,000. By contrast there are 642,000 self-employed in skilled occupations in
Table 2.5 Self-employment rates by sector (SIC07) and occupation (SOC 2000), 2010
Sector (SIC07) Occupation
(SOC 2000)
Agriculture, forestry &
fishing
Energy & water
Manufacturing Construction Distribution, hotels & restaurants
Transport & communicatio
n
Banking & finance
Public admin, education &
health
Other services
1:
Managers & senior officials
53.9 * 8.0 19.5 26.3 12.7 13.2 4.0 19.2
2:
Professional occupations
* * 16.5 18.5 14.3 27.2 8.7 17.7 13.3
3: Associate professional & technical
* * 5.5 * 13.1 19.0 22.8 6.0 42.3
4: Admin & secretarial
* * * 10.5 3.0 * 6.8 * *
5: Skilled trades
78.7 * 12.9 57.1 18.5 * 50.8 * 34.7
6: Personal services
* * * * * * 16.6 5.8 35.1
7: Sales & customer services
* * * * 3.6 * 4.9 * *
8: Process, plant & machine
Table 2.6 ‘Hotspots’ of self-employment (occupations within sectors), 2010
Occupation and sector Self-employment rate
(%)
Total number of self-employed in group
(thousands)
Skilled trades in agriculture, forestry and fishing 78.7 127
Skilled trades in construction 57.1 642
Managers in agriculture, forestry and fishing 53.9 26
Skilled trades in banking and finance 50.8 101
Associate professional and technical occupations in ‘other services’
42.3 195
Process, plant and machine operatives in public administration, education and health
40.4 37
Personal service occupations in ‘other services’ 35.1 119
Process, plant and machine operatives in transport and communication
34.8 200
Skilled trades in ‘other services’ 34.7 44
Elementary occupations in construction 32.0 47
Professional occupations in transport and communication
27.2 44
Managers in distribution, hotels and restaurants 26.3 281
Source: Labour Force Survey (April-June quarter 2010)
2.2.5
Working time
A persistent characteristic of the self-employed is that they work longer average hours than
employees. This is likely to reflect the fact that they have no contractually-fixed working time,
that their working time is not generally regulated by law and, in some cases, that the hourly
earnings from self-employment can be very low and long hours may be required in order to
achieve a reasonable income level7
7
It is unfortunately not possible to use the LFS to look at the relationship between hours worked and earnings among the self-employed, since the LFS collects earnings data only from employees.
. As far as the latter is concerned, the study of start-up
businesses supported by the Prince’s Trust showed, for example, that many of these
self-employed were effectively working at hourly rates well below the National Minimum Wage
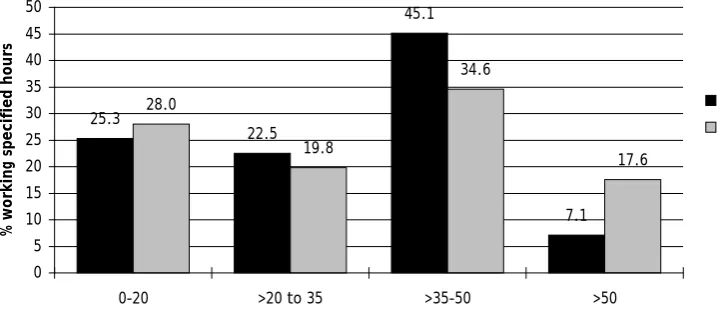
Figure 2.19 confirms this pattern, showing that the self-employed are, compared with
employees, heavily represented among long hours workers (they are also slightly
over-represented among those working very short hours). Thus 18 per cent of the self-employed
[image:42.595.95.454.247.404.2]work more than 50 hours a week, compared with only seven per cent of employees.
Figure 2.19 Total weekly working hours: employees and self-employed, 2010
25.3
22.5
45.1
7.1 28.0
19.8
34.6
17.6
0 5 10 15 20 25 30 35 40 45 50
0-20 >20 to 35 >35-50 >50
working hours
%
w
or
kin
g s
pe
cif
ie
d h
ou
rs
employees self-employed
Source: Labour Force Survey (April-June quarter 2010)
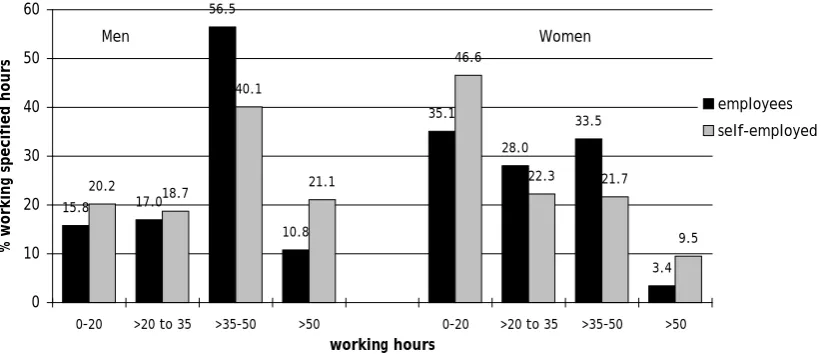
Figure 2.20 shows that there are marked differences between men and women. It is true for
both men and women that, compared with employees, the self-employed are
over-represented among those working very long hours and those working very short hours.
However, self-employed men are particularly likely to be found among the long hours
workers (over a fifth of self-employed men report hours in excess of 50 per week). Among
self-employed women, by contrast, the large proportion in the very short hours category is
particularly notable (almost a half of self-employed women work 20 hours or less per week).
It seems that the opportunity for short (and possibly more flexible) working hours, which
Figure 2.20 Total weekly working hours: employees and self-employed, 2010 (by gender) 15.8 17.0 56.5 10.8 35.1 28.0 33.5 3.4 20.2 18.7 40.1 21.1 46.6 22.3 21.7 9.5 0 10 20 30 40 50 60
0-20 >20 to 35 >35-50 >50 0-20 >20 to 35 >35-50 >50
working hours % w or kin g s pe cif ie d h ou rs employees self-employed Men Women
Source: Labour Force Survey (April-June quarter 2010)
It is also of some interest to consider how working time patterns of the self-employed vary
over time, compared with those of employees, both before and during the recent recession. It
might be expected that the working hours of the self-employed are more elastic to changes in
economic demand, than those of employees. Thus when demand increases, although
employers may increase hours through overtime working, beyond a certain point they are
likely to increase recruitment levels. By contrast, the (regulatory and risk-related) barriers to
recruiting staff faced by the self-employed might mean that hours adjustments will not only
precede any decision to recruit others, but are likely to be more extensive and continue for
longer. Similarly, in a downturn, employers can respond by cutting headcount, but this is less
of an option for the self-employed (particularly if they are sole traders) and they are more
likely to respond to falling demand through hours adjustments (although this could also
operate, in some cases, to increase hours, if they respond to reduced demand by working
harder to attract new business).
The recent evidence supports this hypothesis (greater cyclical volatility of working time
among the self-employed) only weakly (Figure 2.21), and the changes (over the 2005-10
period) in the distribution of working time among both employees and self-employed are
rather small. Both groups experienced overall reductions in working time, with reductions in
the proportions working 35-plus hours per week, and i