International Journal of Innovative Technology and Exploring Engineering (IJITEE) ISSN: 2278-3075, Volume-8 Issue-11, September 2019
Academic Performance Based on Gender using
Filter Ranker Algorithms - An Experimental
Analysis in Sultanate of Oman
Reshmy Krishnan, Hameetha Beegum, Sherimon.P.C
Abstract- Education molds the future society. Student profile analysis in higher education system in sultanate of Oman reveals that drop out cases of students are tremendously increasing for the last few years. Learning environment plays a vital role in providing appropriate teaching methodologies to motivate the skills of the students. Variations in academic performance can be observed based on different educational indicators such as gender, social, economical, cultural and community characteristics. This paper tries to conduct an analysis on the existing data based on educational data mining and tries to make a classification based on gender which helps to adapt necessary teaching methodology to improve the student performance. A data set of 400 students from three colleges in Sultanate of Oman in three consecutive years is taken as case study for this analysis. Since student’s performance is classified as per the data model based on their gender, equal number of male and female data are considered. Data consists of 12 attributes with result as output. Classification of students performance has been achieved using the classification algorithms in WEKA tool. Irrelevant features are eliminated to select subset of input variables in feature selection (FS) algorithm. This is active to improve learning efficiency, predictive accuracy and reduce complexity of learned results. The paper demonstrates gender as the priority attribute to create best data model.
Keywords – Ranking Algorithm, Filters
I. INTRODUCTION
Higher education in Sultanate of Oman has experienced a rapid expansion and growth in the recent past. Number of enrolled students in Higher education institutions has increased rapidly equivalent to 176% increase in the year 2017-18 with female 76% and males 26%[Times of Oman 2017] . Female students are coming forward for higher education in Sultante of Oman in the recent years than male students[7]. As per the statistics in 2014-15 57.7% female students have enrolled in higher education’[8]. In 2015-16 the percentage has become 64% and in 2017-18 number has increased up to 70%. Higher education Institutions in Sultanate of Oman are functioning in a strongly competitive environment. The higher education sector is undergone globalization and thus students in Oman get more opportunities to explore high quality education in motherland itself.
Revised Manuscript Received on September 06, 2019
Dr.Reshmy Krishnan, Computing Department,Muscat College Ms.Hameetha Beegum, Computing Department,Muscat College Dr.Sherimon.P.C3, IT Department, Arab Open University Muscat,Sultanate of Oman
Higher Education Institutions (HEIs) in Oman are passing through a heavy competition to attract eligible students who can fruitfully attain under graduation. HEIs in Oman are keen to observe academic performance of the students in light of educational indicators so that preventive measurement can be taken in the early stages to reduce drop out of students. Identifying these indicators is an essential to resolve problems that cause dropping out the courses.The factors can be social, economic and cultural other than students personal characteristics.Gender and other demographic factors are
major identifiers which can affect academic
performance(Betts & Morell 1999; Corbonaro 2005; Diaz 2003; Eamon 2005). In order to support track and structure of economy of the country, output of the higher education is being used with priority focus nowadays by up skilling the youth through under graduate and graduate programs.
To support students in current learning process, HEIs can analyze and understand their performance from the educational data from which certain rules of classifications and predictions[9].Academic performance of students based on gender is ambiguous topic among educationalists for the past several decades. Repeatedly various reports were demonstrated that female academic performance is higher than the male performance. Since some other studies validated that there is no substantial difference in performance as per gender, the topic has become a debate topic. Gender wise analysis is becoming attractive for research in order to do more effective targeted marketing, to provide suitable support in advance to weak category and hence improve institutional efficiency and intake. A case study of 300 students in Muscat College has been taken for verification in this scenario to analyse academic performance.
In order to do analysis of academic performance, data mining is a promising tool, since it retrieves knowledge from data. Using DM, academic performance of the existing students can be classified and analysis can be done. Which helps to adapt necessary teaching methodology to improve the student performance. Moreover DM can do prediction on academic performance based on many vital factors such as gender, region, age of the students so that university can take suitable measurements for an effective management of the HEIs. Accuracy of prediction model depends on the selected features from the dataset. Feature selection algorithms can be applied to choose most suitable features[19].Prediction results can be refined by those algorithms[20] in addition to ex-tract relevant features and avoid redundancy[21]. There are many algorithms or attribute evaluators to choose best features. Feature selection before the learning algorithm is done by filter methods. Since they don’t need any information from learning
Academic Performance Based on Gender using Filter Ranker Algorithms - An Experimental Analysis in Sultanate of Oman
3503
Published By:
Blue Eyes Intelligence Engineering & Sciences Publication
Retrieval NumberK24900981119/2019©BEIESP DOI: 10.35940/ijitee.K2490.0981119
a general selection strategy in majority of learning algorithms.
II. RELATEDWORK
Study has been conducted on educational indicator which affect academic performance in the previous years such as Leithwood and Jantzi (2009), Bradley and Taylor (1998). In the research of Bradley and Taylor [11], it is observed that female students performance is higher in 12th grade across many countries. Chang[12] observed that female students performance is higher than male in lower grades also. Statistical department of Canada conducted a research and observed that female students outperformed make students almost everywhere. Effect of staff student ration has been studied by Huebler[13] In Sultanate of Oman, a statistical study[14] has been conducted by ministry of Education on the performance of students at the end of the school year using various assessment tools.
A model to recommend academic performance of first year bachelor students of computer science was made by Ahmad et al[15]. A framework to recommend students future outcomes using existing students data was designed by Sumitha et.al [16]. Multiple identifiers which affect students performance such as personal and social factors were discussed in a study by Khasanah et.al[17] and built a predictive model. A datamining study using Naïve Bayes classification method was conducted in 2010 by Bhardwaj and Pal[18]. A study of educational data mining and student performance prediction was done in 2016 [10]. A research to generate classification rules and to predict students’
performance based on existing students behavior was done in 2014[19].
III. METHODOLOGY
This paper discusses an analysis of students’ academic performance in Sultanate of Oman based on gender using feature selection and classification algorithms. The specific objective of this research work is to find out trend of students performance as per gender so that required measurements can be provided to the weak category. Patterns are found from the available data that could be used for prediction of new intake of students. Three data set of students from four different HEIs in Sultanate of Oman are taken for the case study. Students result is taken as output parameters. In order to make a perfect comparative study equal number of female and male students were considered for experiment. Data consists of five attributes with result as output. Result Result is categorized into five types such as excellent, very good, good, pass and poor. The other parameters used are gender, mode, category, AccomType, and GPA. Classification of students’ performance has been achieved using the feature selection and classification algorithms in WEKA tool. The following shows probability distribution table of data set 1 used in the analysis.
Data sets
Three data sets from three colleges/universities in muscat area in sultanate of oman were considered to do the analysis. Dataset 1
It consists of 653 students, dataset2 consists of 436 students and dataset 3 consists of 728 students. Same number of features were considered using feature selection algorithm.
Table 1. The attributes of the data and their possible values
Variables Used Description Possible Values Type
Gender Student Gender Male (M)
Female (F)
Nominal
Mode Mode of Study Full Time (FT)
Part Time (PT)
Nominal
Class size Size of the class Small, Big Nominal
GPA Grade Point Average of
Student
0-4 Numeric
Result Result of the student Pass
Fail
Nominal
mode : HEIs in Oman allows two types of mode of study such as full time mode and Part time mode. As part of strategy ‘earn and study’ many students are studying while working in Ministries and Private Sectors. HEIs in Oman is providing all sort of support by providing convenient class timings after the work. Duration of Part timers (PT) is more when compared to Full Timers to achieve graduation. Number of courses taken by the students in PT is less than of FTs.
GPA: Grade Point Average is the grade calculation at the end of each semester based on the marks attained by the student. As per the range of marks, there are four category of grades for each course such as Excellent, Very good, Good, Pass and Poor. Each grade is having point values which is used in the total GPA calculation. The point values of each grades are given below.
3.50 - 4.00 Excellent
3.00 - 3.49 Very Good 2.50 - 2.99 Good 1.50 - 2.49 Pass
Analysis of Academic Performance Based on Gender using Filter Ranker Algorithms - An Experimental analysis in Sultanate of Oman
Dataset 2 Variables Used
Description Possible Values
Type AccomType Accommodation
Type
Home, Hostel
Nominal
Gender Student Gender Male,
Female
Nominal
Category Category of the Student
High Income Medium Income Low Income
Nominal
GPA Grade Point
Average of
Student
0-4 Numeric
Result Result of the
student
Pass Fail
Nominal
Category: Students are grouped into three category like High Income category, Medium income category and Low income category . We are analysing academic performance based on income category also as part of taking additional support to the low income students.
AccomType: Two types of accommodation are considered such as hostel and home. Since many students are from rural area of Oman, they are staying in hostel and studying.
Dataset 3 Variables
Used
Description Possible Values
Type Transpo
rtation
Mode of transportatio
n
Own vehicle, public vehicle
no minal
Gender Student
Gender
Male, Female No
minal Job
status
Status of students
Employed, unemployed
No minal
GPA Grade
Point Average of
Student
0-4 Nu
meric
Result Result of
the student
Pass Fail
No minal Transportation : Mode of transportation is also taken into account. Two categories of students in case of transportation are considered such as students with own vehicle and students who depends public transport. Since this affect the time of attending classes on time, transportation also included in the analysis
Job status : Since all educational institutions in Oman supports full time and part time studies, there are students who are employed. Employed students are attending classes as part time students after their work. As the hectic schedule of such category students affect result, job status is taken into account.
3.2 Feature selection methods and attribute evaluator
In order to select most effective features from our feature vector we use feature selection methods. Out of two types of methods, such as wrapper and filter methods, we use filter method since it is used to rank most relevant features for achieving high performance accuracy. Filter method is performed on pre-processing step, and are not depended on any learning algorithm, but they depend on over-all features of the training data.
Using filter method, feature selection is done once and then can be provided as input to different classifiers. The number of features that should be selected from the feature vector can be defined. We can remove the feature one at a time that have lower ranks and can see the predictive accuracy of our classification algorithm. There are many attribute evaluator are listed in weka tool. Various feature ranking and feature selection techniques have been proposed such as Correlation-based Feature Selection (CFS), Principal Component Analysis (PCA), Gain Ratio (GR) attribute evaluation, Chi-square Feature Evaluation, Fast Correlation-based Feature selection (FCBF), Information gain, Euclidean distance, i-test, Markov blanket filter
Out of many filter methods present, we have selected Information Gain Ranking Filter here. It evaluates worth of an attribute by measuring the information gain with respect to the class. The search method we have used is the ranker search method in order to get the maximum optimization while ranking the features. In ranker search we can fix number of features that can be selected. Here -1 is selected as the value in order to get all the ranked list. After fixing the above preparations we are moving to make the datamodels.
IV. RESULTS
International Journal of Innovative Technology and Exploring Engineering (IJITEE) ISSN: 2278-3075, Volume-8 Issue-11, September 2019
3505
Published By:
Blue Eyes Intelligence Engineering & Sciences Publication
[image:4.595.59.538.72.254.2]Retrieval NumberK24900981119/2019©BEIESP DOI: 10.35940/ijitee.K2490.0981119
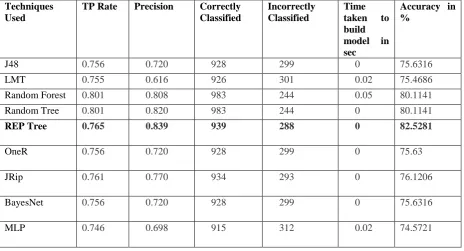
Table 4. Accuracy percentage of different classification techniques dataset 1
Techniques Used
TP Rate
Precision Correctly
Classified
Incorrectly Classified
Time
taken to
build
model in
sec
Accuracy in %
J48 0.756 0.720 928 299 0 75.6316
LMT 0.755 0.616 926 301 0.02 75.4686
Random Forest 0.801 0.808 983 244 0.05 80.1141
Random Tree 0.801 0.820 983 244 0 80.1141
REP Tree 0.765 0.839 939 288 0 82.5281
OneR 0.756 0.720 928 299 0 75.63
JRip 0.756 0.720 928 299 0 75.6316
BayesNet 0.746 0.698 915 312 0.02 74.5721
[image:4.595.67.532.282.533.2]MLP 0.761 0.743 934 293 0 76.1206
Table 5. Accuracy percentage of different classification techniques in dataset2.
Techniques Used
TP Rate Precision Correctly Classified
Incorrectly Classified
Time taken to build model in sec
Accuracy in %
J48 0.756 0.720 928 299 0 75.6316
LMT 0.755 0.616 926 301 0.02 75.4686
Random Forest 0.801 0.808 983 244 0.05 80.1141
Random Tree 0.801 0.820 983 244 0 80.1141
REP Tree 0.765 0.839 939 288 0 82.5281
OneR 0.756 0.720 928 299 0 75.63
JRip 0.761 0.770 934 293 0 76.1206
BayesNet 0.756 0.720 928 299 0 75.6316
MLP 0.746 0.698 915 312 0.02 74.5721
Table 6. Accuracy percentage of different classification techniques in dataset3.
Techniques Used
TP Rate Precision Correctly Classified
Incorrectly Classified
Time taken to build model in sec
Accuracy in %
J48 0.826 0.820 997 299 0 84.6316
LMT 0.735 0.616 726 301 0.01 74.4686
Random Forest 0.861 0.808 893 244 0.03 79.1141
Random Tree 0.853 0.815 883 244 0 79.1041
REP Tree 0.743 0.739 939 288 0 81.6241
OneR 0.624 0.720 748 299 0 74.631
JRip 0.661 0.770 814 293 0 76.1316
BayesNet 0.656 0.720 838 299 0 75.4304
[image:4.595.66.534.558.737.2]International Journal of Innovative Technology and Exploring Engineering (IJITEE) ISSN: 2278-3075, Volume-8 Issue-11, September 2019
V. CONCLUSION
Qualitative classification models are created by applying feature selection algorithm on various set of input attributes. It is observed that in as per feature selection algorithm, gender is taken as the highest priority while filtering the input variables to get the accurate results. Various data models are created as per different classification algorithms and their precision and accuracy rate is compared. The analysis has been conducted using data mining concept with three data sets of 1227 students from four different HEIs in Sultanate of Oman. Collected dataset is undergone a preprocessing process and later data mining tasks such as training and testing was applied to it to generate classification model. The case study reveals that female students are showing high academic performance than male students in all three data sets. This experiment can be extended to find other attributes which has high impact other than gender in the academic performance of students of HEIs..
REFERENCES
1. Hussain, Sadiq, et al. "Educational Data Mining and Analysis of Students’ Academic Performance Using WEKA." Indonesian Journal of Electrical Engineering and Computer Science 9.2 (2018).
2. A. A. Aziz, N. H. Ismail, & F. Ahmad, Mining Students’ Academic Performance, Journal of Theoretical and Applied Information Technology, 53 (2013), no. 3, 485–495
3. Saa, Amjad Abu. "Educational Data Mining & Students’ Performance Prediction." International Journal of Advanced Computer Science and Applications 7.5 (2016): 212-220
4. Bradley, S. & Taylor, J. (1998). The effects of school size on exam performance in secondary schools. Oxford bulletin of economics and statistics, 60(3), 291-324
5. Ahmad, F., N.H. Ismail, and A. Abdulaziz, The Prediction of Students’ Academic Performance Using Classification Data Mining Techniques. Applied Mathematical Sciences, 2015. 9(129): p. 12
6. Sumitha, R. and E.S. Vinothkumar, Prediction of Students Outcome Using Data Mining Techniques. International Journal of Scientific Engineering and Applied Science (IJSEAS), 2016. 2(6): p. 8
7. Zaffar, Maryam, et al. "A Study of Feature Selection Algorithms for Predicting Students Academic Performance." International journal of advanced computer science and applications 9.5 (2018): 541-549
8. M. Doshi, "Correlation Based Feature Selection (CFS) Technique To Predict Student Perfromance," International Journal of Computer Networks & Communications, vol. 6, p. 197, 2014 9. W. Punlumjeak and N. Rachburee, "A comparative study of
feature selection techniques for classify student performance," in Information Technology and Electrical Engineering (ICITEE), 2015 7th International Conference on, 2015, pp. 425-429 10. Karegowda, Asha Gowda, A. S. Manjunath, and M. A. Jayaram.