International Journal of Innovative Technology and Exploring Engineering (IJITEE) ISSN: 2278-3075, Volume-8 Issue-10, August 2019
Abstract: Post the monetary changes of 1991, the FDI course in India ended up simpler. Likewise, for a creating nation some of the time residential sources may not be sufficient. Henceforth, outside capital can help fill the holes between local reserve funds and speculation necessities. FDI is one of the vital devices of financial development for a creating country like India. From this study, FDI inflow growth will be analyzed through the various determinants like Metallurgical Industries, Mining, Power, Non-Conventional Energy, Coal Production, Petroleum & Natural Gas, Boilers and Steam Generating Plants, Prime Mover (Other Than Electrical Generators), Electrical Equipments, Computer Software & Hardware, Electronics, Tele Communications. For analyzing the FDI inflow growth two stages least square analyze were used to analysis the data. The period of the study was from 2000-2001 to 2016-2017. Model 1 and Model 2 shows the same result that there is a significant relationship between FDI inflows and its determinants in India. The study exposed that the comparison of two stages of least square regression analysis model 2 shows the perfect integrator's towards FDI inflow growth in India. Metallurgical Industries, Power, Non-Conventional Energy, Boilers & Steam Generating Plants, and Computer Software and Hardware sector were highly correlated with the growth of FDI at LOG point of view so that the study concluded with model 2 has best for FDI inflow growth in India.
Keywords: FDI, Sector, Inflows, Least Square, Regression.
I. INTRODUCTION
Aside
from being a basic driver o
f monetary development, outside direct venture (FDI) is a noteworthy wellspring of non-obligation money related asset for the financial improvement of India. Remote organizations put resources in India to exploit moderately bring down wages, exceptional speculation benefits, for example, charge exclusions, and so forth (Ministry of Finance, 2018). For a nation where remote speculations are being made, it likewise implies accomplishing specialized ability and creating a business. The Indian government's positive strategy routine and hearty business condition have guaranteed that outside capital continues streaming into the nation. The legislature has taken numerous activities as of late, for example,Revised Manuscript Received on August 12, 2019.
* Correspondence Author
Dr. A. Muthusamy*, his Professor, Department of International Business, Alagappa University, Karaikudi, Tamilnadu, India. Email: [email protected].
Jansi Rani. P, Ph.D. Research Scholar, Department of Commerce, Alagappa University, Karaikudi, Tamilnadu, India. Email: [email protected].
unwinding FDI standards crosswise over areas, for example, resistance, PSU oil refineries, telecom, control trades, and stock trades, among others Venture, or production of capital, is an indispensable determinant of monetary development (Bhattacharyya, 2015). In general, the venture may prompt the making of physical capital products, account, what's more, human capital (Khadraoui, 2013). In gathering with different elements of creation and innovation, venture decides the dimensions and development through changes underway and utilization of products and ventures (Ahmed, 2014). As per UNCTAD in its World Investment Report 2010 "If the circumstance keeps on improving, India is probably going to be among the most encouraging speculator home nations in 2010-12 just as the third most elevated economy for FDI in 2010-12". India has every one of the factors, for example, fine foundation, potential markets, rich work, accessibility of normal assets, and finally the financial and exchanges strategies which has been favoring FDI (Sekar, 2015). The profoundly controlled outside exchange and speculation routines set as of not long ago framed an indispensable piece of this plan of independence (Awan, Khan, & Zaman, 2011). All things being equal, remote undertaking investment in the economy was not disregarded, its circles of movement and the structure it took were profoundly directed (Rao & Dhar, n.d.). Remote capital was banned from indicated enterprises and specialized coordinated effort understandings or innovation permitting understandings between Indian possessed and outside firms were linked to FDI (Chakraborty, Nunnenkamp, & Economy, 2008). What's more, the approach system was dark with the execution of arrangement dependent on the bureaucratic thought of each case on its benefits (Ahmed, 2014).
Through this study FDI inflow growth will be analyzed through the various determinants like Metallurgical Industries, Mining, Power, Non-Conventional Energy, Coal Production, Petroleum and Natural Gas, Boilers and Steam Generating Plants, Prime Mover (Other Than Electrical Generators), Electrical Equipments, Computer Software & Hardware, Electronics, Telecommunications. For analyzing the FDI inflow growth two- stages least square analyze were used.
The Development Rate and the Commitment of
Different Chose Parts towards the Collision of
FDI Inflow in India
in India
A. Magnitude
The job of speculation, in the especially remote direct venture (FDI), is viewed as a standout amongst the most essential benefactors of monetary development. The past 25 years have seen astounding development in FDIs stream everywhere throughout the world (Title : “ The Scenario of FDI in Infrastructure of India ” Akinchan Buddhodev Sinha Education Officer Institute of Company Secretaries of India New Delhi , India Email : [email protected] Contact No : + 91-9393709307, n.d.). This is because of the way that numerous nations, particularly creating nations, consider FDI to be an imperative component in their general technique for financial advancement. The Foreign Direct Investment (FDI) assumes an essential job in the advancement procedure of a nation. It has the potential for making a commitment to the advancement through the exchange of budgetary assets, innovation and imagination and improved the executive systems alongside raising efficiency (Rao & Dhar, n.d.). Creating nations like India need considerable outside inflows to accomplish the expected venture to quicken the monetary development and improvement. It can go about as an impetus for household mechanical improvement (Malhotra, 2014). Further, it helps in accelerating financial action and carries with it other rare beneficial factors, for example, specialized skill and administrative experience, which are similarly basic for financial advancement.
B. Statement of the Predicament
The FDI is the main consideration in the progression and globalization approach of all the transitional economies including India (Masharu & Nasir, 2018). The present investigation is an undertaking which analyzes the effect of the FDI at the sector level in the foundation. The new arrangement routine is expected to accept a bigger job in catalyzing Indian monetary improvement. Previously the ideal measure of private-household or the Foreign Direct Investment did not stream into the foundation area for various reasons (Malhotra, 2014). For analyzing the growth of FDI inflow in India the study has to examine the various selected sectors like Metallurgical Industries, Mining, Power, Non-Conventional Energy, Coal Production, Petroleum & Natural Gas, Boilers And Steam Generating Plants, Prime Mover (Other Than Electrical Generators), Electrical Equipments, Computer Software & Hardware, Electronics, Telecommunications (Masharu & Nasir, 2018).
C. Objectives
The following are the objectives of the study.
To study the development rate of FDI inflow in India.
To analyze the Commitment of Different Chose Parts towards the Collision of FDI Inflow in India.
II. METHODOLOGY
A. Methodology
The study is based on empirical in nature and the data available in the Ministry of finance joint statistical report was accomplished. Secondary data used for the research study absolutely. FDI and various industrial sectors’ data were
collected from the respective country annual report and RBI annual report from its websites. And all other mandatory information has been collected from various cerebral journals and literature. For analyzing the FDI inflow growth, two-stages least squares regression analyses were used (Ahmed, 2014).
Least Square Regression Equation:
t + itXit … … + 3X3 + 2X2 + 1X1 + it =
Yit (1)
Study model:
Yit=α+β1*(METAL)+β2*(MINING)+β3*(POWER)+β4*
(NONCONV)+β5*(COAL)+β6*(PETRO)+β7*(BOILER)+β 8*(PRIME)+β9*(ELECTRI)+β10*(COMPUT)
+β11*(ELECT) + β12*(TELECO) + εt Hence,
Y= FDI inflow in India it= Time period of the study α= Constant
β1, β2, β3,…. β12= Various determinant sectors in India METAL= Metallurgical Industries
MINING= Mining Industry POWER= Power Industry
NONCONV= Non-Conventional Energy COAL= Coal Production
PETRO= Petroleum & Natural Gas
BOILER= Boilers and Steam Generating Plants PRIME= Prime Mover
ELECTRI= Electrical Equipments
COMPUT= Computer Software & Hardware ELECT= Electronics
TELECO= Telecommunications εt= Error of unpredictable observations
B. Period of the study
The study period was 17 years taken from the year 2000-2001 to the year 2016-2017.
C. Hypothesis
The following hypotheses were framed for analyzing the data.
H01: There is no significant relationship between FDI inflows and its determinants in India.
H02: There is no significant relationship between LOGFDI inflows and its determinants in India.
III. REVIEWOFLITERATURE
International Journal of Innovative Technology and Exploring Engineering (IJITEE) ISSN: 2278-3075, Volume-8 Issue-10, August 2019
Besides, the ECM coefficient proposes an intermingling to the harmony way (Hanousek, n.d.). Different factors, for example, the expansion and the populace likewise show noteworthy consequences for the GDP over the long haul (Tvaronavičiene & Kalašinskaite, 2010). At long last, the gross capital arrangement and the exchange have no critical job to clarify the variety in the monetary development of Pakistan. (Antwi, Fiifi, Atta, & Zhao, 2013) in their article studied the Numerous Regression and Structural Analysis of Foreign Direct Investment (FDI) in Ghana (1994-2010). This examination endeavors to analyze the pattern of Foreign Direct Investment (FDI) in Ghana and its association with some chosen monetary markers, for example, swapping scale, expansion, loan costs, Gross Domestic Product (GDP) just as business and the auxiliary dependability of FDI as for the factors (Kokko, Tansini, & Zejan, n.d.). Yearly information on FDI was utilized for the examination crossing from 1994 to 2010 (Tvaronavičiene & Grybaite, 2010). Results from the investigation demonstrated that FDI inflows into the nation had encountered an expanding pattern and experienced auxiliary changes over the period under examination (Merican, Yusop, Mohd Noor, & Siong Hook, 2007). Moreover, trade rates and GDP development assumed a critical job of pulling in FDI into the nation. (Easterly & Levine, 2016) in their study explained the in spite of the fact that a huge writing contends that European settlement outside of Europe during colonization enduringly affected financial advancement, scientists have been unfit to survey these expectations straightforwardly as a result of a nonattendance of information on pioneer European settlement (Ayanwale, 2007) (Lipsey, 2006). Develop another database on the European portion of the populace during colonization and look at its relationship with financial advancement today. Locate a solid, positive connection between current pay per capita and pilgrim European settlement that is powerful to controlling for the present extent of the number of inhabitants in European plummet, as well the same number of other
nation attributes (Lipsey, 2006). The outcomes propose that any antagonistic impacts of extractive organizations related with little European settlements were, even at low levels of provincial European settlement, more than balanced by different things that Europeans brought, for example, human capital and innovation (Singh & Delhi, 2005).
IV. DATAANALYSIS
Data analysis because of endogenity and estimation issue worries so, as to distinguish the impact of FDI on development, the study needs an instrument that is associated with the "romanticized" quality-balanced FDI volumes, however not with development. In this area, the study change industry-focusing on data into a parallel variable with industry, nation, and time variety, and demonstrate that it fulfills both the legitimacy and excludability necessities as clarified underneath .
Model 1: LS (FDI) C METAL MINING POWER NONCONV COAL PETRO BOILER PRIME ELECTRI COMPUT ELECT TELECO
Hypothesis:
H01: There is no significant relationship between FDI inflows and its determinants in India.
Least Square Regression Analysis of FDI and its determinants
FDI = C(1) + C(2)*METAL + C(3)*MINING + C(4)*POWER + C(5)*NONCONV + C(6)*COAL +
C(7)*PETRO + C(8)*BOILER + C(9)*PRIME +
C(10)*ELECTRI + C(11)*COMPUT + C(12)*ELECT + C(13)*TELECO
Table- I: Least Square Regression Analysis of FDI inflow and its determinants in India during the period from 2000-01 to 2016-17
Variable Coefficient Std. Error t-Statistic Prob. F-statistic Prob R-squared
C -3402.29 2710.32 -1.26 0.28
18.49 0.01 0.98
METAL 7.72 4.44 1.74 0.16
MINING 0.75 13.07 0.06 0.96
POWER 6.3 4.19 1.5 0.21
NONCONV 10.95 7.79 1.4 0.23
COAL -142.38 388.24 -0.37 0.73
PETRO 1.67 5.37 0.31 0.77
BOILER -141.66 156.57 -0.9 0.42
PRIME -8.13 22.62 -0.36 0.74
ELECTRI -2.64 8.28 -0.32 0.77
COMPUT 5.14 2.24 2.3 0.08
ELECT 19.88 14.52 1.37 0.24
TELECO 2.89 3.59 0.8 0.47
in India
Upshot
FDI = -3402.28683107 + 7.71976537946*METAL + 0.748964621745*MINING + 6.30348632414*POWER + 10.9489439088*NONCONV - 142.378913612*COAL + 1.66695024015*PETRO - 141.658805899*BOILER - 8.12998360065*PRIME - 2.63571412275*ELECTRI + 5.1419596242*COMPUT + 19.8784390305*ELECT + 2.88823578191*TELECO
The table -I shows the R2=0.9822 which means the independent variables METAL, MINING, POWER, NONCONV, COAL, PETRO, BOILER, PRIME, ELECTRIC, COMPUT, ELECT, TELECO can explain 98.22 % of the variations in the dependent variable which
is FDI inflows. FDI can be predicted with the help of
METAL, MINING, POWER, NONCONV, COAL,
PETRO, BOILER, PRIME, ELECTRIC, COMPUT, ELECT, TELECO. P value (0.006) is less than the significant value (0.05). Hence H0 has rejected shows that there is a significant relationship between FDI inflows and its determinants in India.
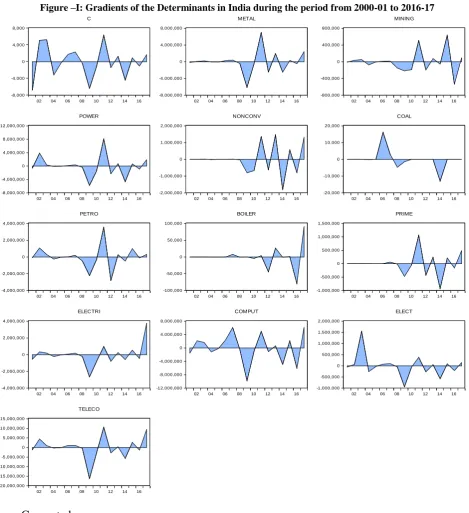
Gradients of the Determinants
[image:4.595.65.535.222.736.2]The gradients of the determinants FDI inflow with METAL, MINING, POWER, NONCONV, COAL, PETRO, BOILER, PRIME, ELECTRIC, COMPUT, ELECT, TELECO were shown in figure -1.
Figure –I: Gradients of the Determinants in India during the period from 2000-01 to 2016-17
-8,000 -4,000 0 4,000 8,000
02 04 06 08 10 12 14 16
C
-8,000,000 -4,000,000 0 4,000,000 8,000,000
02 04 06 08 10 12 14 16
METAL
-800,000 -400,000 0 400,000 800,000
02 04 06 08 10 12 14 16
MINING
-8,000,000 -4,000,000 0 4,000,000 8,000,000 12,000,000
02 04 06 08 10 12 14 16
POWER
-2,000,000 -1,000,000 0 1,000,000 2,000,000
02 04 06 08 10 12 14 16
NONCONV
-20,000 -10,000 0 10,000 20,000
02 04 06 08 10 12 14 16
COAL
-4,000,000 -2,000,000 0 2,000,000 4,000,000
02 04 06 08 10 12 14 16
PETRO
-100,000 -50,000 0 50,000 100,000
02 04 06 08 10 12 14 16
BOILER
-1,000,000 -500,000 0 500,000 1,000,000 1,500,000
02 04 06 08 10 12 14 16
PRIME
-4,000,000 -2,000,000 0 2,000,000 4,000,000
02 04 06 08 10 12 14 16
ELECTRI
-12,000,000 -8,000,000 -4,000,000 0 4,000,000 8,000,000
02 04 06 08 10 12 14 16
COMPUT
-1,000,000 -500,000 0 500,000 1,000,000 1,500,000 2,000,000
02 04 06 08 10 12 14 16
ELECT
-20,000,000 -15,000,000 -10,000,000 -5,000,000 0 5,000,000 10,000,000 15,000,000
02 04 06 08 10 12 14 16
TELECO
Gradients of the Objective Function
International Journal of Innovative Technology and Exploring Engineering (IJITEE) ISSN: 2278-3075, Volume-8 Issue-10, August 2019
Model 2: LS LOG(FDI) C METAL MINING POWER NONCONV COAL PETRO BOILER PRIME ELECTRIC COMPUT ELECT TELECO
Hypothesis
H02: There is no significant relationship between LOGFDI inflows and its determinants in India.
Least Square Regression Analysis of LOGFDI and its determinants
LOG(FDI) = C(1) + C(2)*METAL + C(3)*MINING + C(4)*POWER + C(5)*NONCONV + C(6)*COAL + C(7)*PETRO + C(8)*BOILER + C(9)*PRIME + C(10)*ELECTRI + C(11)*COMPUT + C(12)*ELECT + C(13)*TELECO
Table- II: Least Square Regression Analysis of LOGFDI inflow and its determinants in India during the period from 2000-01 to 2016-17
Variable Coefficient Std. Error t-Statistic Prob. F-statistic Prob R-squared
C 7.37 0.10 76.16 0.00
89.21 0.00 1.00
METAL 0.00 0.00 4.19 0.01
MINING 0.00 0.00 -2.38 0.08
POWER 0.00 0.00 5.31 0.01
NONCONV 0.00 0.00 6.22 0.00
COAL 0.00 0.01 0.23 0.83
PETRO 0.00 0.00 2.15 0.10
BOILER -0.04 0.01 -6.64 0.00
PRIME 0.00 0.00 -1.85 0.14
ELECTRI 0.00 0.00 -0.87 0.43
COMPUT 0.00 0.00 9.26 0.00
ELECT 0.00 0.00 1.83 0.14
TELECO 0.00 0.00 0.50 0.65
Source: Computed Upshot
LOG(FDI) = 7.3688 + 0.0006*METAL -
0.001*MINING + 0.0007*POWER +
0.0017*NONCONV + 0.0032*COAL + 0.0004*PETRO - 0.03712*BOILER - 0.001*PRIME - 0.0002*ELECTRI +
0.0007*COMPUT + 0.0009*ELECT + 6.363*TELECO
The table -II shows the R2=0.996277 which means the independent variables METAL, MINING, POWER, NONCONV, COAL, PETRO, BOILER, PRIME, ELECTRIC, COMPUT, ELECT, TELECO can explain 99.62 % of the variations in the dependent variable which
is LOGFDI inflows. LOGFDI can be predicted with the help of METAL, MINING, POWER, NONCONV, COAL, PETRO, BOILER, PRIME, ELECTRIC, COMPUT, ELECT, TELECO. P value (0.000) is less than the significant value (0.05). Hence H0 has rejected shows that there is a significant relationship between LOGFDI inflows and its determinants in India.
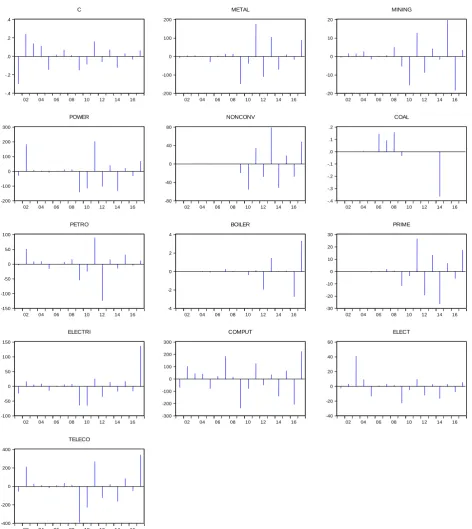
Gradients of the Determinants
in India
-.4 -.2 .0 .2 .4
02 04 06 08 10 12 14 16
C
-200 -100 0 100 200
02 04 06 08 10 12 14 16
METAL
-20 -10 0 10 20
02 04 06 08 10 12 14 16
MINING
-200 -100 0 100 200 300
02 04 06 08 10 12 14 16
POWER
-80 -40 0 40 80
02 04 06 08 10 12 14 16
NONCONV
-.4 -.3 -.2 -.1 .0 .1 .2
02 04 06 08 10 12 14 16
COAL
-150 -100 -50 0 50 100
02 04 06 08 10 12 14 16
PETRO
-4 -2 0 2 4
02 04 06 08 10 12 14 16
BOILER
-30 -20 -10 0 10 20 30
02 04 06 08 10 12 14 16
PRIME
-100 -50 0 50 100 150
02 04 06 08 10 12 14 16
ELECTRI
-300 -200 -100 0 100 200 300
02 04 06 08 10 12 14 16
COMPUT
-40 -20 0 20 40 60
02 04 06 08 10 12 14 16
ELECT
-400 -200 0 200 400
02 04 06 08 10 12 14 16
TELECO
[image:6.595.68.541.47.577.2]Gradients of the Objective Function
International Journal of Innovative Technology and Exploring Engineering (IJITEE) ISSN: 2278-3075, Volume-8 Issue-10, August 2019
Source: Computed
V. CONCLUSION
This study examined a comprehensive sector level data set for the period from 2000-2001 to 2016-2017 that encompasses India to scrutinize the various relations between different types of FDI and growth. An engaging element of industry examination is that it mitigates a portion of the impacts of imperceptibly heterogeneity and model misspecification, which are hard to control at the national dimension (Gupta & Chaturvedi, 2017). The study uses as an instrument another industry-level informational collection on industry focusing on. And also discover FDI at the business level to be related to higher development in esteem included. The connection is more grounded for businesses with higher ability prerequisites and for enterprises increasingly dependent on outside capital. Two-stages least squares methodology to identify the quality of FDI as determined by the targeting various sectors in India. Model 1 and Model 2 shows the same result that there is a significant relationship between FDI inflows and its determinants in India. Hence, FDI can be predicted with the help of METAL, MINING, POWER,
NONCONV, COAL, PETRO, BOILER, PRIME,
ELECTRIC, COMPUT, ELECT, TELECO during the study period. Comparing two stages of least square regression analysis model 2 shows the perfect integrators towards FDI inflow growth in India. Metallurgical Industries, Power, Non-Conventional Energy, Boilers & Steam Generating Plants, and Computer Software & Hardware sector were highly correlated with the growth of FDI at LOG point of view so that the study concluded with model 2 has best for FDI inflow growth in India.
REFERENCES
1. Ahmed, H. (2014). Foreign Direct Investment in India. International Journal of Scientific Research, 2(6), 132–134. https://doi.org/10.15373/22778179/june2013/43
2. Antwi, S., Fiifi, E., Atta, E., & Zhao, X. (2013). Impact of foreign direct investment on economic growth : Empirical evidence from Ghana. 3(1), 18–25.
3. Approach, A. A. (2016). Impact of Foreign Direct Investment on Economic Growth of Pakistan-.
4. Awan, M. Z., Khan, B., & Zaman, K. (2011). Economic determinants of foreign direct investment ( FDI ) in commodity producing sector : A case study of. 5(2), 537–545. https://doi.org/10.5897/AJBM10.767 5. Ayanwale, A. B. (2007). FDI and Economic Growth : Evidence from
Nigeria By.
6. Bhattacharyya, R. (2015). The Opportunities and Challenges of FDI in Retail in India. 5(5), 99–109.
7. Chakraborty, C., Nunnenkamp, P., & Economy, W. (2008). Economic Reforms , FDI , and Economic Growth in India : A Sector Level
Analysis. 36(7), 1192–1212.
https://doi.org/10.1016/j.worlddev.2007.06.014
8. Easterly, W., & Levine, R. (2016). The European origins of economic
development. Journal of Economic Growth.
https://doi.org/10.1007/s10887-016-9130-y
9. Gupta, J., & Chaturvedi, R. (2017). A Study to Analyze FDI Inflow to India. 8(5), 44–52. https://doi.org/10.9790/5933-0805024452 10.Hanousek, J. (n.d.). CERGE-EI.
11.Khadraoui, N. (2013). International Journal of Advances in Management and Economics Available online at www.managementjournal.info Financial Globalisation and Crisis Occurrence : Does Threshold Effect of Financial Development Matter ? 2(1).
12.Kokko, A., Tansini, R., & Zejan, M. C. (n.d.). The Journal of Development Local technological capability and productivity
spillovers from FDI in the Uruguayan manufacturing sector. (April 2015), 37–41. https://doi.org/10.1080/00220389608422430 13.Lipsey, R. E. (2006). No Title.
14.Malhotra, B. (2014). Foreign Direct Investment: Impact on Indian Economy. Global Journal of Business Management and Information Technology, 4(1), 2278–3679. Retrieved from http://www.ripublication.com/gjbmit/gjbmitv4n1_03.pdf
15.Masharu, U., & Nasir, M. A. (2018). Policy of foreign direct investment liberalisation in India: implications for retail sector. International Review of Economics, 65(4), 465–487. https://doi.org/10.1007/s12232-018-0306-y
16.Merican, Y., Yusop, Z., Mohd Noor, Z., & Siong Hook, L. (2007). Foreign direct investment and the pollution in Five ASEAN nations. International Journal of Economics and Management, 1(2), 245–261. 17.Ministry of Finance. (2018). Economic Survey of India 2017-18
Chapter 09: Services Sector. Retrieved from http://mofapp.nic.in:8080/economicsurvey/pdf/152-166_Chapter_09 _Economic_Survey_2017-18.pdf
18.Rao, K. S. C., & Dhar, B. (n.d.). India’s Recent Inward Foreign Direct Investment An Assessment Institute for Studies in Industrial Development. Retrieved from http://isid.org.in
19.Sekar, K. (2015). Assessment of Impact of Foreign Direct Investment in India FDI in Banking and Finance. Journal of Entrepreneurship &
Organization Management, 04(01), 1–4.
https://doi.org/10.4172/2169-026x.1000127
20.Singh, K., & Delhi, N. (2005). Foreign Direct Investment in India : A Critical Analysis of FDI from 1991-2005.
21.Title : “ The Scenario of FDI in Infrastructure of India ” Akinchan Buddhodev Sinha Education Officer Institute of Company Secretaries of India New Delhi , India Email : [email protected] Contact No : + 91-9393709307. (n.d.).
22.Tvaronavičiene, M., & Grybaite, V. (2010). Impact of FDI on Lithuanian economy : Insight into development of main economic activities. 1699.