surgery: statistical analysis plan
Pike
et al.
Pikeet al. Trials (2015) 16:54
U P D A T E
Open Access
Transfusion Indication Threshold Reduction
(TITRe2) randomized controlled trial in cardiac
surgery: statistical analysis plan
Katie Pike
1, Rachel L Nash
1, Gavin J Murphy
2, Barnaby C Reeves
1and Chris A Rogers
1*Abstract
Background:The Transfusion Indication Threshold Reduction (TITRe2) trial is the largest randomized controlled trial to date to compare red blood cell transfusion strategies following cardiac surgery. This update presents the statistical analysis plan, detailing how the study will be analyzed and presented. The statistical analysis plan has been written following recommendations from the International Conference on Harmonisation of Technical Requirements for Registration of Pharmaceuticals for Human Use, prior to database lock and the final analysis of trial data. Outlined analyses are in line with the Consolidated Standards of Reporting Trials (CONSORT).
Methods and design:The study aims to randomize 2000 patients from 17 UK centres. Patients are randomized to either a restrictive (transfuse if haemoglobin concentration <7.5 g/dl) or liberal (transfuse if haemoglobin concentration <9 g/dl) transfusion strategy. The primary outcome is a binary composite outcome of any serious infectious or ischaemic event in the first 3 months following randomization.
The statistical analysis plan details how non-adherence with the intervention, withdrawals from the study, and the study population will be derived and dealt with in the analysis. The planned analyses of the trial primary and secondary outcome measures are described in detail, including approaches taken to deal with multiple testing, model assumptions not being met and missing data. Details of planned subgroup and sensitivity analyses and pre-specified ancillary analyses are given, along with potential issues that have been identified with such analyses and possible approaches to overcome such issues.
Trial registration:ISRCTN70923932.
Keywords:Cardiac surgery, Red cell, Restrictive, Statistical analysis plan, Transfusion
Update
This paper provides the detailed statistical analysis plan for the Transfusion Indication Threshold Reduction (TITRe2) randomized controlled trial, comparing transfu-sion rates, morbidity and healthcare resource use following two different transfusion strategies after cardiac surgery.
Background
Perioperative anaemia is common after cardiac surgery, and transfusion of allogeneic red blood cells (RBCs) is the preferred treatment for acute anaemia. Observational studies suggest that transfusion is harmful after cardiac
surgery [1-3]; by contrast, randomized controlled trials of restrictive (lower haemoglobin level) versus more liberal (higher haemoglobin level) RBC transfusion thresholds have not demonstrated adverse effects attributable to transfusion [4]. Uncertainty about a safe restrictive RBC transfusion threshold in cardiac surgery persists and is reflected in transfusion rates across cardiac centres ran-ging from 25 to 75% [5] in the UK and 8 to 93% [6] in the USA. The TITRe2 trial has been established to address the current uncertainty around safe haemoglobin levels for RBC transfusion after cardiac surgery.
Methods and Design
TITRe2 is a multicentre, UK-wide, open parallel group randomized controlled trial. It is the largest randomized controlled trial to date (2,000 randomized patients) to
* Correspondence:[email protected] 1
Clinical Trials and Evaluation Unit, School of Clinical Sciences, University of Bristol, Bristol, UK
Full list of author information is available at the end of the article
TRIALS
© 2015 Pike et al.; licensee BioMed Central. This is an Open Access article distributed under the terms of the Creative Commons Attribution License (http://creativecommons.org/licenses/by/4.0), which permits unrestricted use, distribution, and reproduction in any medium, provided the original work is properly credited. The Creative Commons Public Domain Dedication waiver (http://creativecommons.org/publicdomain/zero/1.0/) applies to the data made available in this article, unless otherwise stated.
Pikeet al. Trials (2015) 16:54
compare RBC transfusion strategies following cardiac surgery. Patients are randomized in a 1:1 ratio to one of two RBC transfusion strategies: (a) a‘restrictive’ thresh-old, whereby transfusions are given if the haemoglobin concentration is below 7.5 g/dl (or haematocrit <22%), or (b) a ‘liberal’ threshold, whereby transfusions are given if the haemoglobin concentration is below 9 g/dl (or haematocrit <27%). Cohort minimization is used to minimize imbalance of: (a) centre and (b) operation type. The study population is all adult patients (aged 16 or over) undergoing non-emergency elective cardiac surgery (this in-cludes emergency cases admitted from home and non-emergency inpatient cases). Eligibility criteria are as inclusive as possible, to promote the applicability of the evidence ob-tained during the trial. Full details of the study back-ground and design have been reported elsewhere [7].
Following recommendations from the International Conference on Harmonisation of Technical Requirements for Registration of Pharmaceuticals for Human Use [8], a pre-specified detailed statistical analysis plan has been written prior to database lock and final analysis of the trial data. However, during the course of the study, analysis re-quested by the Data Monitoring and Safety Committee has been performed prior to finalization of this statistical analysis plan. This analysis comprised monitoring of re-cruitment rates and data completeness, monitoring of demographic data, and descriptive comparisons of safety data, including the primary outcome measure, by masked treatment allocation. At a pre-planned interim analysis carried out after half the participants had been followed up, a formal comparison was performed for the primary outcome measure only. No formal comparisons were per-formed at any other time.
Study objectives
The objectives of the randomized controlled trial are to: (a) estimate the difference in the risk of a postoperative infec-tion or ischaemic event between restrictive and liberal transfusion thresholds; (b) compare the effects of restrictive and liberal transfusion thresholds with respect to a range of secondary outcomes; (c) estimate the cost-effectiveness of the restrictive compared with the liberal haemoglobin transfusion threshold and describe this in terms of a cost-effectiveness acceptability curve. A UK National Health Service Research Ethics Committee (Oxfordshire C) ap-proved the study (08/H0606/125). The trial is registered (ISRCTN70923932).
Outcomes
The primary outcome measure is a binary composite out-come of any serious infectious (sepsis or wound infection) or ischaemic (permanent stroke, myocardial infarction, acute kidney injury or gut infarction) event in the first 3 months after randomization. Full details of qualifying
events and the manner in which they will be verified are available in the protocol [7].
Secondary outcome measures are:
Units of RBCs and other blood components transfused during a participant’s hospital stay,
Proportion of patients experiencing an infectious event,
Proportion of patients experiencing an ischaemic event,
EQ5D [9],
Duration of postoperative stay in intensive care or high dependency unit,
Duration of postoperative hospital stay,
All-cause mortality,
Significant pulmonary morbidity, comprising: (a) initiation of non-invasive ventilation (for example, continuous positive airway pressure ventilation), (b) reintubation/ventilation, or (c) tracheostomy,
Cumulative resource use, cost and cost-effectiveness. (This analysis is being undertaken by the Health Eco-nomics Research Centre at the University of Oxford and is not covered in this statistical analysis plan.)
Sample size
Based on previous data [1] and allowing for anticipated non-adherence to the allocated thresholds [7], the primary outcome frequencies were hypothesized to be 17% and 11% in the liberal and restrictive groups. A sample size of 1,468 was required to detect this difference with 90% power and 5% significance (two-sided test). The target sample size was inflated to 2,000 to allow for uncertainty about non-adherence, since higher than expected non-adherence would reduce power. Full details are reported elsewhere [7].
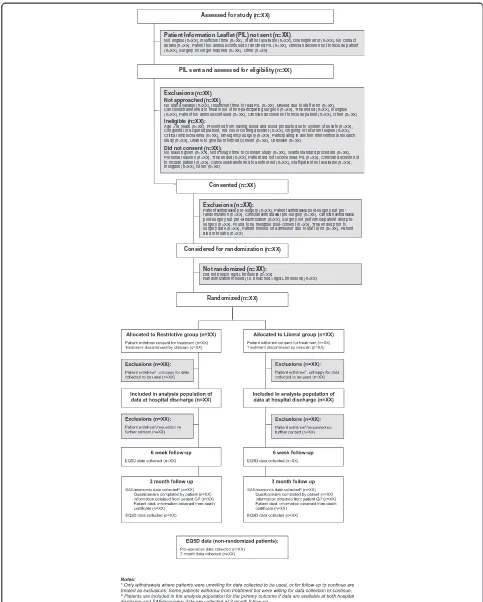
Flow of participants
The flow of participants will be described using a flow-chart (see Figure 1) as recommended by the Consoli-dated Standards of Reporting Trials (CONSORT) [10].
Participants consent to the study before surgery if they meet all of the pre-consent eligibility criteria (see Figure 1) and give written consent. They are then randomized if at any point post-surgery they meet the post-consent eligibil-ity criteria (haemoglobin concentration falls below 9 g/dl or haematocrit below 27%). This means that a significant proportion of patients (estimated to be approximately 30% from earlier studies [1]) consent to the study but are not randomized. Randomized patients should be given a RBC transfusion as soon as possible after haemoglobin or haematocrit levels breach the relevant thresholds, and at most within 24 hours.
Withdrawals
Assessed for study (n=XX)
Exclusions (n=XX):
Patient withdrawal surgery (n=XX), Patient withdrawal post-surgery but pre-randomization (n=XX), Clinician withdrawal pre-surgery (n=XX), Clinician withdrawal post-surgery but randomization (n=XX), Surgery not performed/patient died pre-surgery (n=XX), Found to be ineligible post-consent (n=XX), Trial ended prior to surgery date (n=XX), Patient missed on admission due to staff error (n=XX), Patient died in theatre (n=XX)
Considered for randomization (n=XX)
Exclusions (n=XX) Not approached (n=XX)
No staff available (n=XX), Insufficient time to read PIL (n=XX), Missed due to staff error (n=XX), Cancelled/transferred to theatre list of non-participating surgeon (n=XX), Trial ended (n=XX), Ineligible (n=XX), Patient too anxious/confused (n=XX), Clinician decision not to include patient (n=XX), Other (n=XX)
Ineligible (n=XX):
Age <16 years (n=XX), Prevented from having blood and blood products due to system of beliefs (n=XX), Congenital or acquired platelet, red cell or clotting disorder (n=XX), Ongoing or recurrent sepsis (n=XX), Critical limb ischaemia (n=XX), Emergency surgery (n=XX), Participating in another interventional research study (n=XX), Unable to give full informed consent (n=XX), Unknown (n=XX)
Did not consent (n=XX):
No reason given (n=XX), Not enough time to consider study (n=XX), Wants standard procedure (n=XX), Personal reasons (n=XX), Trial ended (n=XX), Patient did not receive/read PIL (n=XX), Clinician decision not to include patient (n=XX), Cancelled/transferred to another list (n=XX), Staff/patient not available (n=XX), Ineligible (n=XX), Other (n=XX)
Patient Information Leaflet (PIL) not sent (n=XX)
Not eligible (n=XX), Insufficient time (n=XX), Staff not available (n=XX), Oversight/error (n=XX), No contact details (n=XX), Patient too anxious/confused or declined PIL (n=XX), Clinician decision not to include patient (n=XX), Surgery no longer required (n=XX), Other (n=XX)
PIL sent and assessed for eligibility (n=XX)
Consented (n=XX)
Randomized (n=XX)
Not randomized (n=XX):
Did not breach 9g/dL threshold (n=XX)
[image:4.595.55.538.87.689.2]Randomization missed (i.e. breached <9g/dL threshold) (n=XX)
Figure 1Flow of participants.
instructions as to (a) whether data already collected can be used and (b) whether the patient is happy to partici-pate in follow-up sessions. In addition, clinicians can choose to permanently discontinue treatment according to the protocol for a patient; this does not constitute a withdrawal and data collection continues as planned but transfusions need no longer be given according to the study protocol.
Patient population
The analysis population will consist of all randomized pa-tients, excluding: (a) patients marked as ‘randomized in error’ and (b) withdrawn patients who were unwilling for data collected to be used. Randomization in error is ex-pected to happen rarely (<10 patients); it occurs when a member of research staff realizes shortly after randomization and prior to any intervention that a randomized participant is not in fact eligible. All study analyses will be performed on a modified intention-to-treat basis (including all random-ized patients, with the exception of withdrawn patients or those with missing outcome data).
Adherence to the study protocol
Assumptions regarding transfusion rates in the two groups were made in calculating the sample size [7]; if transfusion rates do not match these assumptions, the power of the study will be reduced. Therefore, measuring and assessing adherence with the transfusion protocol is critical. Non-adherence is defined in two ways: (a) the patient received a RBC transfusion outside of the protocol (‘extra’ transfu-sion) and (b) the patient was not given a RBC transfusion that, according to the protocol, should have been given (‘withheld’transfusion). Adherence will be assessed for the period from randomization to hospital discharge, although if a patient withdraws or has treatment discontinued, ad-herence after the time of withdrawal or discontinuation will not be assessed. For both types of non-adherence, in-stances will be classified as mild, moderate or severe (see Table 1), according to the likely influence on transfusion rates, and therefore possible influence on study outcomes.
The frequency of each type of non-adherence will be described by treatment allocation. Further descriptive analyses will be undertaken, to look at non-adherence in more detail, including: reasons for non-adherence, num-ber of deviations from the protocol per patient, haemo-globin or haematocrit levels at deviations and the day of the week and time of the day of deviations. Characteris-tics of patients with or without any non-adherence will be compared and non-adherence rates will be described by site.
Statistical analysis principles
Analysis principles and presentation of data will follow the guidance issued in the CONSORT statement [10].
Descriptive data
Pre-randomization characteristics (for example, patient demography, intra-operative details and pre-randomization RBC transfusions) will be described by treatment allocation for patients in the analysis population. Continuous variables will be summarized using the mean and standard devi-ation (or median and interquartile range if the distribution is skewed), and categorical data will be summarized as a number and percentage. Any imbalances in the character-istics of the patients will be described but statistical tests for imbalance will not be carried out in line with recom-mendations [10]. In addition, available characteristics will be described by: (a) non-consented and consented patients and (b) consented but not randomized (because threshold was not breached) and randomized patients (including pre-and intra-operative characteristics, transfusions, haemoglo-bin levels, EQ5D data and mortality).
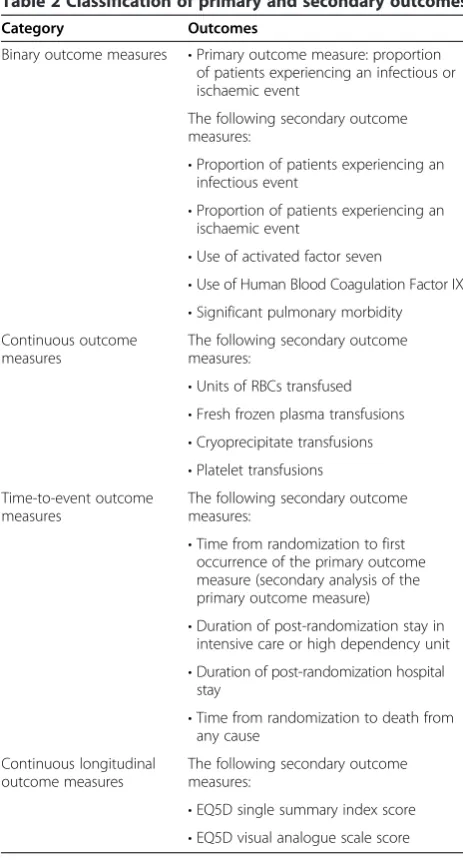
Outcome data
All outcomes listed in the study protocol will be analyzed under the umbrella of one of four types of outcome: (a) binary, (b) continuous, (c) time to event and (d) continu-ous longitudinal. Table 2 classifies each outcome.
General presentation and analysis techniques for each type of outcome are described next.
Binary outcomes
[image:5.595.305.539.100.280.2]The numbers and percentages of patients experiencing each outcome will be presented by treatment group and compared using logistic regression. Formal statistical comparisons of treatment effects will only be performed if more than ten patients in total experience the out-come (with at least one event in each treatment group). Treatment comparison estimates will be presented as adjusted odds ratios and 95% confidence intervals.
Table 1 Non-adherence to transfusion protocol
Transfusion outside of protocol
Transfusion according to protocol withheld
Mild Not applicable A transfusion took place, but more than 24 hours after the breach of the relevant transfusion threshold
Moderate Patient transfused, but patient did breach the relevant threshold for transfusion at some point postoperatively (before or after the transfusion outside of protocol)
Patient was not transfused following a breach, but the patient had previously had at least one post-randomization transfusion
Severe Patient transfused, and patient did not breach the relevant threshold for transfusion at any point postoperatively
Patient was not transfused following a breach, and patient had no post-randomization transfusions
Continuous outcomes
These will be summarized by the mean and standard de-viation (or median and interquartile range if data are skewed) in each treatment group and compared using linear regression. For untransformed data, treatment comparisons will be presented as adjusted differences in means with 95% confidence intervals, and for logarith-mically transformed data as adjusted ratios of geometric means with 95% confidence intervals. If a logarithmic transformation is not satisfactory other analysis or pres-entation methods will be sought.
Time-to-event outcomes
These will be summarized by the median and interquar-tile range in each treatment group and compared using Cox’s proportional hazards models, with treatment com-parisons presented as hazard ratios and 95% confidence
intervals. Such models require an assumption of propor-tional hazards to be met. Any patients with a time of zero (for example, the duration of post-randomization stay in an intensive care or high dependency unit might be zero if the patient was randomized after being dis-charged from the intensive care or high dependency unit) will be included in analyses by assuming a time of half of the smallest non-zero time to the event. Appropriate censoring variables will be used, as given in Table 3.
Continuous longitudinal outcomes
[image:6.595.56.288.93.524.2]These will be compared using a linear mixed-effects methodology with the treatment group and study design variables fitted as fixed effects, and patient terms as ran-dom effects. Separate parameter estimates will be incor-porated into models for: (a) the mean baseline response across both treatment groups and (b) each post-randomization time point for each treatment. This approach of ‘jointly’ modelling the baseline and post-intervention measurements avoids the necessity of ei-ther excluding cases with missing baseline measures or imputing missing baseline values. If the time by treat-ment interaction (post-intervention) is not statistically significant at the 10% level, an overall treatment effect will be reported. If the interaction is statistically signifi-cant, the changes in treatment effect with time will be described. Different variance/covariance structures will be explored (compound symmetry, first-order auto-regressive, Toeplitz and unstructured), and the structure that provides the best fit using the likelihood ratio test (or Akaike information criterion if compared models are not nested) will be used. Treatment comparisons will be pre-sented as adjusted differences in means with 95% confi-dence intervals.
Table 2 Classification of primary and secondary outcomes
Category Outcomes
Binary outcome measures •Primary outcome measure: proportion of patients experiencing an infectious or ischaemic event
The following secondary outcome measures:
•Proportion of patients experiencing an infectious event
•Proportion of patients experiencing an ischaemic event
•Use of activated factor seven
•Use of Human Blood Coagulation Factor IX
•Significant pulmonary morbidity Continuous outcome
measures
The following secondary outcome measures:
•Units of RBCs transfused
•Fresh frozen plasma transfusions
•Cryoprecipitate transfusions
•Platelet transfusions Time-to-event outcome
measures
The following secondary outcome measures:
•Time from randomization to first occurrence of the primary outcome measure (secondary analysis of the primary outcome measure)
•Duration of post-randomization stay in intensive care or high dependency unit
•Duration of post-randomization hospital stay
•Time from randomization to death from any cause
Continuous longitudinal outcome measures
The following secondary outcome measures:
•EQ5D single summary index score
•EQ5D visual analogue scale score
Table 3 Censor variables for time-to-event outcomes
Outcome Censor variable
Time from randomization to first occurrence of primary outcome
Date of 3 month follow-up questionnaire, if completed
Date of death, for patients who die prior to 3 month follow-up
Date of discharge from hospital, for patients who survive 3 months postoperatively but do not complete the follow-up questionnaire (which captures primary outcome events after hospital discharge)
Duration of post-randomization stay in intensive care or high dependency unit
Time of death in intensive care or high dependency unit
Duration of postoperative hospital stay
Time of death in hospital
Time to death Time of last follow-up (usually 3 months post-operation)
[image:6.595.304.540.534.733.2]Adjustment in models
The intention is to adjust all models for factors included in the cohort minimization: operation type (four different types) as a fixed effect and centre (17 different centres) as a random effect (or a shared frailty term in time-to-event models). Occasionally, the operation type might differ be-tween the study database and the randomization system because it has been entered incorrectly into the randomization system. In this case, the value from the study database will be used, as the operation type recorded on the database will have been confirmed to be correct in such instances. For all treatment comparisons, the liberal group will be the reference group.
Statistical significance
For hypothesis tests, two-tailedPvalues <0.05 are consid-ered statistically significant. Likelihood ratio tests will be used in preference to Wald tests for hypothesis testing.
Model assumptions
For all methods outlined, underlying assumptions will be checked using standard methods, for example, residual plots or log-log plots for proportional hazards. If assumptions are not valid, alternative methods of analysis will be sought (for example, by applying a logarithmic transformation or fitting a two-part mixed model for semi-continuous data [11]). If extreme outlying observations are found, whereby inclusion of such values results in an inadequate model fit, such obser-vations will be excluded from the main analyses and sensi-tivity analyses may be performed to examine the effect on the study’s conclusions.
Multiple testing
No formal adjustment will be made for multiple testing. However, the following measures to avoid problems with over-interpretation will be taken: (a) formal statistical comparisons will not be made for outcomes with low event rates, and (b) only pre-specified subgroup analyses will be performed and a significance level of 5% will be used for the tests for interaction for subgroup analyses despite being low powered tests. Consideration will be taken in the interpretation of results to reflect the num-ber of statistical tests performed and the consistency, magnitude and direction of treatment estimates for dif-ferent outcomes.
Missing data
All missing data will be described by treatment group. If the amount of missing data differs substantially between groups, potential reasons will be explored. The following approach will be used to handle missing data in analysis models.
Missing predictor data
By design, there will be no missing data for any of the randomization factors. All other potential predictors are preoperative measurements of continuous longitudinal outcomes; by using the joint modelling approach de-scribed, missing values for such data are considered in the context of missing longitudinal data (see next).
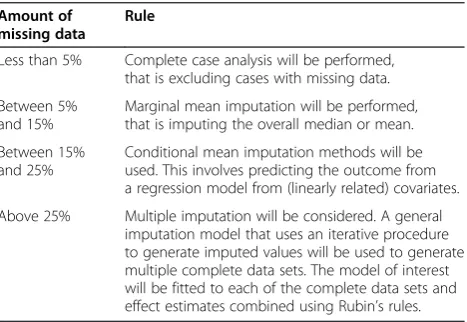
[image:7.595.306.540.572.733.2]Approaches for dealing with missing continuous out-come data measured at one time point are described in Table 4.
Missing longitudinal continuous outcome data
Preoperative values will be modelled jointly with those measured postoperatively, as described, thereby allowing all cases with at least one observation to be included. If appropriate (the level of missingness is >20%) then any variables that are predictive of missingness will be identi-fied, and if there is reason to suggest that an assumption of missing at random given these variables is reasonable (this is especially likely if the variable was measured pre-operatively) then such variables will be adjusted for in the models of interest. These models can be shown to provide unbiased estimates of the treatment effect; moreover, mul-tiple imputation approaches would not be expected to re-cover any additional information [12].
Missing binary or categorical outcome data
No formal imputation techniques will be used. However, for the primary outcome measure, the following approach will be followed. The element expected to have the highest amount of missing data is wound infection (identified via asepsis scoring [13,14]) measured in hospital and at 3-months follow-up. If in-hospital asepsis scores are missing and the following are true, the patient will be assumed to have no wound infection: (a) no antibiotics for suspected wound infection were prescribed in hos-pital, (b) follow-up is complete and the patient reported no problems with the healing of the wound at follow-up.
Table 4 Missing continuous outcome data measured at one time point
Amount of missing data
Rule
Less than 5% Complete case analysis will be performed, that is excluding cases with missing data.
Between 5% and 15%
Marginal mean imputation will be performed, that is imputing the overall median or mean.
Between 15% and 25%
Conditional mean imputation methods will be used. This involves predicting the outcome from a regression model from (linearly related) covariates.
Once this has been implemented, if the level of missing data is greater than 5%, this is likely to be mainly due to missing follow-up data and therefore separate treatment estimates will be made for the primary outcome: (a) at hospital discharge, and (b) at any time.
Subgroup analyses
Seven pre-specified subgroup analyses of the primary out-come are stated in the study protocol: (a) operation type (isolated coronary artery bypass graft versus other operation types), (b) age at operation (<75 years versus≥75 years), (c) preoperative diagnosis of diabetes (none versus diet, oral medication or insulin controlled), (d) preoperative diagnosis of lung disease (none versus chronic pulmonary disease or asthma), (e) preoperative renal impairment (estimated glom-erular filtration rate≤60 ml/min versus >60 ml/min), (f) sex (men versus women), (g) preoperative ventricular function (good (>50%) versus moderate or poor (≤50%)).
Each subgroup analysis will be performed by adding a relevant interaction term to the primary outcome logistic regression model (for example, for sex, a sex*treatment interaction term will be added to the model) [15]. The hy-pothesis for all subgroup analyses is that there will be no interaction. Odds ratios and 95% confidence intervals within each subgroup will be given alongsidePvalues from the results of tests for interactions.P values for treatment estimates within each subgroup will not be given, unless a statistically significant interaction is found at the 5% level.
Sensitivity analyses
The following sensitivity analyses have been identified; these were not pre-specified in the study protocol:
Examining treatment estimates for the primary outcome by site, ordering sites by rates of severe non-adherence with the transfusion protocol: the hypothesis is that the treatment effect should tend towards the null with increasing non-adherence.
Assessing the effect of the timing of primary outcome following randomization on the primary outcome by excluding all events that occurred in the first 24 hours after randomization: the hypothesis is that events in the first 24 hours are unlikely to be due to a post-randomization transfusion.
Assessing the effect of the transfusions before randomization on the primary outcome by excluding patients who were transfused prior to randomization.
Assessing the effect of acute kidney injury: acute kidney injury is defined according to the Acute Kidney Injury Network criteria [16] as either: (a) an increase in serum creatinine concentration (≥26.5μmol/l, or
≥150% change from baseline) over a period of less than 48 hours, (b) restricted urine output (<0.5 ml/ (kg h)) for more than 6 hours or (c) the need for renal
replacement therapy. Highest daily creatinine levels are recorded separately from clinical judgment of acute kidney injury, so the following sensitivity analyses are planned to re-analyze the primary out-come: (a) excluding patients identified with acute kidney injury who do not have an increase in serum creatinine concentration over a 48 hour period or less, according to the daily highest creatinine concentration values collected, (b) including patients who have not been identified as having acute kidney injury, but according to the daily highest creatinine concentration data have a rise in serum creatinine concentration that would meet the criteria (and who were not having haemofiltration or dialysis pre-operatively).
Serious primary outcome events: the pre-planned interim analysis after half the study participants had been recruited showed that the majority of the primary outcome events are either sepsis or acute kidney injury, and therefore the primary outcome will be re-analyzed including only the more‘serious’ events. This will mean the following changes to the definition of the overall primary outcome: (a) all myocardial infarctions, gut infarctions and strokes will be included, (b) only the most severe acute kidney injury cases (stage 3) will be included, (c) all wound infections identified via asepsis scoring will be excluded (the more serious wound infections will be identified via serious sepsis events), (d) serious pre-discharge sepsis events will be identified by the presence of sepsis plus organ failure (defined as: myocardial infarction, stroke, acute kidney injury, laparotomy for gut infarction and one or more of reintubation, acute respiratory distress syndrome, low cardiac output or tracheostomy), (e) post-discharge sepsis events will be included, as they require hospitalization.
Safety data
Adverse events will be tabulated by allocated treatment group; no formal comparisons will be made. Adverse events that meet the serious criteria (that is they (a) resulted in death, (b) were life threatening, (c) resulted in persistent or significant disability or incapacity, (d) prolonged an ongoing hospitalization or (e) resulted in hospitalization) will be identified (as serious adverse events) and all events will be divided into ‘expected’events listed in the study protocol and other ‘unexpected’events. Unexpected events will be independently coded by at least two trained research nurses blinded to treatment allocation using the Medical Diction-ary for Regulatory Activities [17]. Any discrepancies be-tween nurses in classification will be resolved by a cardiac surgeon also blinded to treatment allocation. System organ class terms will be used to group events, with groupings further broken down into preferred terms if necessary.
Meta-analysis
It is intended to perform a meta-analysis combining the primary outcome results from this study with any previ-ous systematic reviews and studies. This analysis will be performed using standard meta-analysis methods for binary outcomes, using a random effects model. Previous studies will be included in the meta-analysis if they fulfil the following criteria: (a) the patient population was pa-tients undergoing cardiac surgery, (b) restrictive and lib-eral RBC transfusion strategies are compared, although the actual haemoglobin concentration and haematocrit thresholds for transfusion may differ between studies, (c) the outcomes included in the meta-analysis are postopera-tive morbidity or mortality.
Pre-specified ancillary analyses
There are three pre-specified ancillary observational ana-lyses in the study protocol:
1. Estimating the relationship between the number of RBC units transfused, and the risk of the primary outcome or death from any cause, stratified by trial arm.
2. Investigating the relationship between percentage decline in haemoglobin concentration from the preoperative level and the risk of primary outcome or death from any cause, taking into account the number of RBC units transfused.
3. Investigating whether the age of the RBCs is associated with the risk of primary outcome or death from any cause.
To address analyses (a) and (b), three logistic regres-sion models will be fitted with the following explanatory variables:
1. Total number of RBC units transfused (either pre- or post-randomization)
2. Percentage decline in haemoglobin concentration from the preoperative level
3. Total number of RBC units transfused and percentage decline in haemoglobin concentration.
To address analysis (c), the age of the ‘oldest’ unit of RBCs received by a patient will be fitted as an explana-tory variable. The age will be determined by linking the donation numbers of all RBCs transfused to a blood bank database and retrieving the date of donation.
In all of these models, adjustment will be performed for any variables found to be potential confounders, defined as: variables associated with both the exposure and the outcome that are not an intermediary step on the causal pathway between the exposure and outcome, that signifi-cantly contribute to the relevant multivariable model
(defined as a likelihood ratioP value <0.05 or by modify-ing the effect estimate by greater than 10%). In analyses (a) and (b), the following variables have been identified as possible confounders: randomized allocation, operation type, centre (as a random effect), EuroSCORE, age and sex. Likewise for analysis (c), number of RBC units trans-fused, blood group, EuroSCORE, age and sex have been identified. For analyses (a) and (b), the instrumental vari-able method of controlling for confounding will also be explored, using randomized allocation as the instrumental variable [18].
Some potential issues have been identified. It may be sensible to restrict the analyses to include only patients who did not receive a proportionately large number of RBC units (for example, restrict the analysis to include those who received ten units or fewer). This approach would be used if, for example, the data obtained from pa-tients who received large numbers of RBC units resulted in outliers and caused models not to fit adequately.
In all of the analyses (with the exception of decline in haemoglobin concentration) there is a potential problem that some of the RBCs might be transfused after a primary outcome event. Therefore fitting these models might not be appropriate, owing to the timing of the exposure rela-tive to the outcome event. If this proves to be the case (for example, a non-negligible number of RBC units are given after the primary outcome measure or effect estimates do not make sense), alternative approaches will be considered [19], including:
Nested matched case-control study: each patient experiencing a primary outcome event (‘cases’) will be matched to a‘control’(by matching on at least centre and randomized allocation); other factors (for example, operation type) may also be used if sufficient matched controls are available). For both the‘case’and the
‘control’, any RBC units transfused after the time that the case first experienced the primary outcome will be excluded from analyses.
Time-to-event analyses with a time varying
covariate of RBC units given: this would address the issue of exposure time (for‘cases’, the event would be the primary outcome event, and for controls the last follow-up), but would ignore any blood given after the occurrence of a primary outcome event (that is, RBC units will only be excluded for‘cases’).
than 14 days old (yes or no), the number or percentage of RBC units given that are more than 14 days old, the use of blood that is older than the median age of all RBC units transfused (yes or no). There are also poten-tial problems with all of these approaches, for example, the use of any blood more than 14 days old is likely to be confounded by blood group and many of the methods that dichotomize patients into older versus younger blood will either need to exclude patients not transfused any RBC units, or to fit as a three-level variable of older blood, younger blood or no blood, which may in turn cause problems with interpretability.
Changes to the original analysis plan
At the time of registering the trial protocol, a basic analysis plan was written. This has been followed when writing the current detailed plan, with some additions made, namely: details of variables to adjust for in analyses, rules for deal-ing with missdeal-ing data, sensitivity analyses, meta-analysis and details of how the ancillary analyses will be performed.
Discussion
We prospectively present the approach that will be taken in the analysis of the TITRe2 randomized controlled trial. Publishing the statistical analysis plan will increase trans-parency and promote deeper understanding of the methods used within the study. This transparency should reduce the risk of reporting data- or method-driven results.
During the peer review of this paper, it was pointed out that the marginal mean imputation method is not advisable for any level of missing data because it is likely to under-estimate the variance of the treatment effect. We have not revised Table 4 because the analysis plan has since been ex-ecuted and, in the event, this method of imputation was not implemented. However, we acknowledge that the method is inappropriate. We have revised the analysis plan template in our trials unit so that this method will not be proposed in further statistical analysis plans.
In preparing the statistical analysis plan, we have very deliberately sought to include our plans for additional, or secondary, analyses using trial data that are not directly re-lated to the trial objectives. Doing this has compelled us to plan and consider the analysis approach and implications for the whole study collectively rather than in a fragmen-ted manner. We believe that this has helped us formulate these plans more precisely and allows us to document that the plans were set out in advance of any data exploration. We recommend this approach to other researchers; other-wise, because the researchers are the ones performing the primary analyses, it can be difficult for them to substanti-ate a claim of pre-specification for a secondary analysis and to avoid criticisms of selective reporting in ways that have recently been identified in reports of the primary re-sults of randomized controlled trials [20].
Abbreviations
CONSORT:Consolidated standards of reporting trials; RBC: Red blood cell.
Competing interests
The authors declare that they have no competing interests.
Authors’contributions
KP wrote the statistical analysis plan under the guidance of CAR and drafted the manuscript. RLN and GJM commented on the statistical analysis plan and reviewed the manuscript. BCR formulated the analysis objectives, commented on the statistical analysis plan and reviewed the manuscript. CAR formulated the analysis objectives, advised on the statistical analysis plan and reviewed the manuscript. All authors read and approved the final manuscript.
Authors’information
KP is the trial statistician. RLN is the junior trial statistician. GJM is the clinical lead in the trial. BCR is the chief investigator of the trial. CAR is the senior trial statistician.
Acknowledgements
The TITRe2 trial is funded by the National Institute for Health Research Health Technology Assessment programme (project number 06/402/94) and a full report will be published in Health Technology Assessment. Visit the Health Technology Assessment programme website (http://www.nets.nihr.ac.uk/ programmes/hta) for further project information. The views and opinions expressed are those of the authors and do not necessarily reflect those of the Health Technology Assessment programme, the National Institute for Health Research, the UK National Health Service or the Department of Health.
Author details 1
Clinical Trials and Evaluation Unit, School of Clinical Sciences, University of Bristol, Bristol, UK.2Department of Cardiovascular Sciences, University of Leicester, Leicester, UK.
Received: 11 February 2014 Accepted: 13 January 2015
References
1. Murphy GJ, Reeves BC, Rogers CA, Rizvi SI, Culliford L, Angelini GD. Increased mortality, postoperative morbidity, and cost after red blood cell transfusion in patients having cardiac surgery. Circulation. 2007;116:2544–52. 2. Koch CG, Li L, Duncan AI, Mihaljevic T, Cosgrove DM, Loop FD, et al.
Morbidity and mortality risk associated with red blood cell and blood-component transfusion in isolated coronary artery bypass grafting. Crit Care Med. 2006;34:1608–16.
3. Karkouti K, Wijeysundera DN, Yau TM, McCluskey SA, Chan CT, Wong PY, et al. Influence of erythrocyte transfusion on the risk of acute kidney injury after cardiac surgery differs in anemic and nonanemic patients. Anesthesiology. 2011;115:523–30.
4. Carson JL, Carless PA, Hebert PC. Transfusion thresholds and other strategies for guiding allogeneic red blood cell transfusion. Cochrane Database Syst Rev. 2012;4:CD002042.
5. Murphy MF, Murphy GJ, Gill R, Herbertson M, Allard S, Grant-Casey J. 2011 Audit of Blood Transfusion in Adult Cardiac Surgery. Birmingham: National Comparative Audit of Blood Transfusion; 2013.
6. Bennett-Guerrero E, Zhao Y, O’Brien SM, Ferguson Jr TB, Peterson ED, Gammie JS, et al. Variation in use of blood transfusion in coronary artery bypass graft surgery. JAMA. 2010;304:1568–75.
7. Brierley R, Pike K, Wordsworth S, Mumford A, Cohen A, Angelini GD, et al. A multi-centre randomised controlled trial of Transfusion Indication Threshold Reduction on transfusion rates, morbidity and healthcare resource use following cardiac surgery. Transfus Apher Sci. 2014;50:451–61. 8. International Conference on Harmonisation of Technical Requirements for
Registration of Pharmaceuticals for Human use: ICH harmonised tripartite guideline statistical principles for clinical trials E9. 1998. http://www.ich.org/ fileadmin/Public_Web_Site/ICH_Products/Guidelines/Efficacy/E9/Step4/ E9_Guideline.pdf.
9. EuroQol Group. EuroQol - a new facility for the measurement of health-related quality of life. Health Pol. 1990;16:119–208.
10. Schulz KF, Altman DG, Moher D, CONSORT Group. CONSORT 2010 statement: updated guidelines for reporting parallel group randomised trials. BMJ. 2010;340:c332.
11. Tooze JA, Grunwald GK, Jones RH. Analysis of repeated measures data with clumping at zero. Stat Methods Med Res. 2002;11:341–55.
12. Carpenter JR, Kenward MG. Missing data in clinical trials - a practical guide. Birmingham: National Health Service Coordinating Centre for Research Methodology, Publication RM03/JH17/MK. 2007. http://missingdata.lshtm.ac. uk/downloads/rm04_jh17_mk.pdf.
13. Wilson AP, Treasure T, Sturridge MF, Gruneberg RN. A scoring method (ASEPSIS) for postoperative wound infections for use in clinical trials of antibiotic prophylaxis. Lancet. 1986;1:311–3.
14. Gibbons C, Bruce J, Carpenter J, Wilson AP, Wilson J, Pearson A, et al. Identification of risk factors by systematic review and development of risk-adjusted models for surgical site infection. Health Technol Assess. 2011;15(30):1–156.
15. Assmann SF, Pocock SJ, Enos LE, Kasten LE. Subgroup analysis and other (mis)uses of baseline data in clinical trials. Lancet. 2000;355:1064–9. 16. Mehta RL, Kellum JA, Shah SV, Molitoris BA, Ronco C, Warnock DG, et al.
Acute kidney injury network: report of an initiative to improve outcomes in acute kidney injury. Critical Care. 2007;11:R31.
17. Medical Dictionary for Regulatory Activities. http://www.meddra.org/. 18. Greenland S. An introduction to instrumental variables for epidemiologists.
Int J Epidemiol. 2000;29(4):722–9.
19. Essebag V, Platt RW, Abrahamowicz M, Pilote L. Comparison of nested case-control and survival analysis methodologies for analysis of time-dependent exposure. BMC Med Res Methodol. 2005;5:5.
20. Rasmussen K, Schroll J, Gøtzsche, PC, Lundh, A. Underreporting of conflicts of interest among trialists: a cross-sectional study. 2013. http://www.peerre-viewcongress.org/2013/Plenary-Session-Abstracts-9-9.pdf
Submit your next manuscript to BioMed Central and take full advantage of:
• Convenient online submission
• Thorough peer review
• No space constraints or color figure charges
• Immediate publication on acceptance
• Inclusion in PubMed, CAS, Scopus and Google Scholar
• Research which is freely available for redistribution