Abstract: Gasoline produced in Egypt is a low-grade gasoline that contains high concentration of harmful components that are having a toll on our environment. In addition, those pollutants cause countless diseases and deaths annually to the Egyptian population. This paper targets two main sectors in the production of commercial gasoline. The improvement engine efficiency through the upgrading of octane number is first experimented by using a blendstock that ranges from gasoline fractions and Isomerates. An optimum was then chosen depending on the results obtained from different tests. Through those experiments, it was determined which samples obeyed the EU regulation for transportation emissions. Having an excellent gasoline with a high octane number but produced large quantities of harmful emissions was unacceptable. This leads to the section aim of this research, which was to produce an environmental gasoline. This meant that once the gasoline sample is combusted, it should produce limited amounts of emissions such as 1% benzene since benzene is carcinogenic.
A sample with euro 3 specification was produced and showed excellent gasoline properties such as an RON value of around 95 without the use of octane enhancers. A second sample showed better results satisfied euro 5 regulations and produced an even higher octane number than the euro 3 sample. This sample was the optimum environmental ETBE-gasoline high octane number blend. By understanding the composition of those samples, maximum yield of commercial gasoline could be produced. This would also lead to the reduction of pollutants in the environment. Completing this task with successful results means that this environmental high octane number gasoline could be produced and used in Egypt. Such blends should be produced on a large scale by exercising euro 3 and/or 5 regulations.
Index Terms: High Octane number, Gasoline – Ether Blend, Crude Oil, Blendstock
I. INTRODUCTION
Crude oil is a complex liquid that is composed of various elements. However, that mixture mainly contains hydrocarbons. [1-5] Hydrocarbons are molecules that are composed of both carbon and hydrogen molecules. [7-9] Organic materials as well as low concentration of metals are also present in crude oil. The carbon and hydrogen ratio greatly affects the physical characteristics of the crude oil. For example, as the hydrogen to carbon atom decreases, both the boiling point as well the gravitational force of the crude oil increases. [10-14] This would result in higher operating cost because more energy would be needed to separate the different cuts in the crude oil. On the other hand, high
Revised Manuscript Received on July 05, 2019.
Tarek M. Aboul - Fotouh , Department of Mining and Petroleum Engineering, Faculty of Engineering, Al-Azhar University, Nasr City, Cairo 11884, Egypt.
Sherif K. Ibrahim, Department of Chemical Engineering, The British University in Egypt, El Shorouk City, Cairo, Egypt
M. A. Sadek, Department of Chemical Engineering, The British University in Egypt, El Shorouk City, Cairo, Egypt
Hany A. Elazab , Department of Chemical Engineering, The British University in Egypt, El Shorouk City, Cairo, Egypt.
hydrogen to carbon ratio is beneficial to the refinery since less hydrogen would be required externally for processing. [9-18] Crude oil could be categorized under groups or elements. The groups are ranked in order of structure, reactivity and the number of carbon and/or hydrogen atoms. Those properties are well studied now and could be used to predict the characteristics of the crude oil as whole. [4,7, 19-20]
There are various elements in crude oil, some of which are essential whereas others are considered waste and must be removed before further use of the crude oil. The table below illustrates the different elements present in crude oil and an approximate weight percentage of each element.
An important cut from crude oil is Naphtha. Light Straight Run Naphtha (LSRN) and Heavy Straight Run Naphtha (HSRN) are both important for the production of gasoline. Both those cuts allow us to acquire great amount of gasoline. Gasoline is a complex mixture of over 500 hydrocarbons. Those hydrocarbons range from 5 to 12 carbons. [18-23] Fluidized Catalytic Cracking produces FCC gasoline from crude exiting from the atmospheric residue or the vacuum unit to the FCC unit. In addition, olefin gases are also produced here which is later sent to the alkylation unit where gasoline is also produced. FCC is the largest production unit of gasoline. Catalytic hydrocracking is also used to produce gasoline. However, this is used when the hydrogen to carbon ratio is low and hydrogenation occurs simultaneously with catalytic cracking. [24-35
Certain gasoline samples have a different octane numbers. That number allows us to understand the quality of that gasoline. [36-47] That is how the gasoline is graded into the different grades mentioned above. The octane number is a percentage of iso-octane in a certain pool of gasoline that contains both iso-octane (that has an octane number of 100) and heptane (that has an octane number of 0). For example, an 80-octane gasoline has an 80% iso-octane blend with 20% heptane (Bowden & Stavinoha , 2005). [48-53]
The octane number also allows us to know the most important feature of the fuel. That feature is the anti-knocking of the piston in spark ignition engines. A fuel with a low octane number would impulsively ignite the unused fuel before a spark was introduced to the piston. The fuel suddenly ignites due to the high compression by the piston forcing the fuel to ignite before a full cycle of the piston was to take place. In other words, this is how diesel engines ignite – with the use of compression stroke rather than wait for the spark to ignite the fuel. The aim of this work is
to ease and improve future work applied to the
High Octane Number Gasoline-Ether Blend
production of gasoline. This work would contribute to the reduction of air pollution.
This is done through the reduction of green house gas emissions such as carbon monoxide, Sulphur oxides (SOX), whether its sulphur dioxide (SO2) or sulphur trioxide (SO3). Moreover, nitrogen oxide concentrations would also increase due to the cleaner and safer combustion of fuel. By reducing nitrogen oxide as well as nitrogen dioxide, the environment would be cleaner resulting in better human health in the long run. Using environmental gasoline would also enable the greater use gasoline sources as well as other processes that would contribute to a higher and greater efficient gasoline. As a result, the yield of commercial gasoline would increase to support the increasing demand of automotive gasoline. An example of how the yield would increase is by sending gasoline to reformate as appose to sending to refinery process. This would be carried out through an economical approach in the refinery which would be energy effective thus cost efficient.
II. EXPERIMENTALWORK
2.1 Gasoline Blend Stock Sources
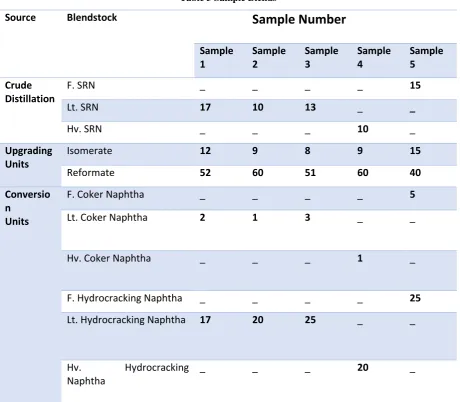
Unfortunately, some of the blend stock are unattainable here in Egypt. For that reason, producing a clone from this environmental gasoline pool is unachievable due to the limited or unavailability of some of the blend stocks. Nevertheless, Egypt does have some of the main upgrading processes and conversion units to produce a few of the blendstocks that shape the environmental gasoline pool. Using those limited blendstocks, a different gasoline pool was conducted and tested to evaluate whether or not it would be considered environmental. The table below shows the blendstock from crude distillation, upgrading processes and conversion units that are available in Egypt and crude distillation cuts that shape the gasoline pool produced.
[image:2.595.312.540.69.177.2]Table 1 shows the resources present in Egypt that would allow us to produce environmental gasoline. In addition, a source could be purchased to improve the quality of the gasoline produced. That source would include oxygenated compounds that could be MTBE, ethanol or ETBE.
Table 1 Gasoline Blendstock Sources
Crude Distillation
Straight Run Naphtha
Upgrading Units
Isomerate
Reformate
Conversion Units
Coker Naphtha
Hydrocracked Naphtha
Purchases
ETBE
Understanding the different blendstocks is important. However, knowing the different volumes of each blendstock is just as crucial. References to the environmental pool state optimized volumes of each blendstock. However, they also take into account blendstock from conversion units that Egypt does not have such as FCC naphtha.
Table 2 shows typical crude tower cut points in terms of the full naphtha. This illustrates temperatures which the light and
heavy naphtha are separated at. This is shown through each of their Initial Boiling Point (IBP) and End Boiling Point (EBP).
Table 2 Light & Heavy Naphtha Cuts
Cut
TBP IBP
(
oF)
TBP EBP
(
oF)
Light Naphtha
80-90
180-220
Heavy
Naphtha
180-220
330-380
2.2 Extracting Light and Heavy Naphtha
As shown in table 3, there was a wide range of blendstock used to produce 5 different samples. As stated earlier, all of the samples arrived in their full cut. This means that the light and heavy of straight run naphtha, coker naphtha and hydrocracking naphtha were unavailable. In order to produce blends with light and heavy naphtha, we first had to separate that full cut into light and heavy.
This was accomplished using distillation. ASTM D86 – 12 is a standard test method for distillation of petroleum products at atmospheric pressure. A certain amount of the full cut would be taken (either 100 ml or 200ml depending on the standardized flask) and run through this distillation test. The recovery obtained from this distillation at temperatures below 180 oF was the light naphtha. On the other hand, anything left in the flask after that temperature was reached was considered heavy naphtha since the IBP of heavy naphtha ranges between 180-220 oF. This was the separation technique used to extract both light and heavy naphtha from the full cut for the three different blend stocks.
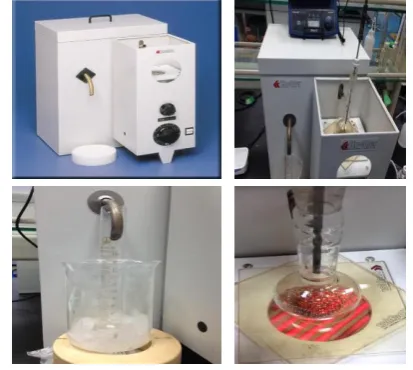
[image:2.595.323.530.492.677.2]K45000 front view distillation apparatus was used. The Koehler K45000 conforms the ASTM D86 test method and thus could be used. This unit is shown in the figure below.
[image:2.595.47.291.548.689.2]Table 3 Sample Blends
Source
Blendstock
Sample Number
Sample
1
Sample
2
Sample
3
Sample
4
Sample
5
Crude
Distillation
F. SRN
_
_
_
_
15
Lt. SRN
17
10
13
_
_
Hv. SRN
_
_
_
10
_
Upgrading
Units
Isomerate
12
9
8
9
15
Reformate
52
60
51
60
40
Conversio
n
Units
F. Coker Naphtha
_
_
_
_
5
Lt. Coker Naphtha
2
1
3
_
_
Hv. Coker Naphtha
_
_
_
1
_
F. Hydrocracking Naphtha
_
_
_
_
25
Lt. Hydrocracking Naphtha
17
20
25
_
_
Hv.
Hydrocracking
Naphtha
_
_
_
20
_
Figure 1 above shows the device used to conduct this test. As shown, a thermometer is placed at the top after ensuring the water bath is sufficiently filled with water. The thermometer rod is then placed into the standardized distillation flask at the neck where vapor would enter through a neck into the condensing tubes. As shown, the receiving cylinder is placed under the condensing tube. This receiving cylinder is placed in a beaker filled with ice. The ice surrounds the cylinder in order to prevent any recovery from evaporating again due to the gasolines high volatility. The final image shows how the flask is subjected to heat and how the flask is supported on the flask support board. Density test was measured using the ASTM D4052 that measures the density using digital density meter. Petroleum distillates as well as viscous oils could be used here at temperatures testing of 15oC and 35oC. Octane number test measures the knocking rating of liquid fuels for spark-ignition engines. Octane number is measured as the research octane number and motor octane numbers using ASTM tests D 2699 and D 2700 respectively. This test is very crucial to this research as one of the specific objectives is to produce a high octane number gasoline blend. As appose to previous method of having a four-stroke cylinder engine to test the fuel sample, an octane
meter was used to measure both those tests. This portable device produces results that are consistent with ASTM D 2699 and D 2700 tests.
III. RESULTSANDDISCUSSION
To seek a high-octane gasoline blend to satisfy euro 3 regulations without the addition of oxygenated compounds (in this case, no use of ETBE) was reached using the blendstock acquired. Table 14 showed the different volume percent of each blendstock without the use of purchases (ETBE)Increasing the octane number to euro 3 or even 4 standards along with complying with euro 3 exhaust emission regulations without the need of oxygenated compounds proves great results. In order to determine which of the samples tested (1 -5) represents the optimum sample for euro 3, various tests were conducted. Through those tests, some showed the potential of some samples and how they could be compared to euro 6 whereas some tests resulted in failure to comply with EU regulations and mandated this sample to be labeled as euro 3. Regardless, euro 3 is an upgrade to Egypt and is considered a new step
since Egypt still regulates at euro 2.
Table 4 Sample Densities & API
Sample
Number
Density
kg/m
3API
1
773.628
52.9
1
2
769.872
52.2
9
3
763.512
57.7
4
4
770.044
52.2
5
5
754.136
56.1
Table 4 shows the different density values for the tested gasoline blends produced. Density is related to the API of the gasoline sample. The higher the API, the lighter the sample is. The components present in the gasoline determine how heavy the sample becomes. For example, aromatics are known to be heavy components. Sample 4 contained blends made only from heavy naphtha cuts. This meant that this sample was the heaviest. As the sample becomes heavy the API value decreases. This therefore makes sense that this sample shows the lost API value since it contained the heaviest components. Sample 3 showed to be the highest API value because it was the lightest. The reason why this sample is the lightest because it contained the least amount of reformate. Reformate is composed of aromatics which are naturally heavy groups. Because of its low reformate volume, other blends volumes increased to produce the standardized 100 ml volume. That addition of volume came from light naphtha from light coker, LSRR and light hydrocracking naphtha. This all made this sample light, which resulted in a high API value.
[image:4.595.69.268.78.289.2]Octane number test is the main test to measure the efficiency of the fuel. It represents the anti-knocking properties. The higher the octane number, the better the fuel is. All samples were subjected to this test where the research octane number (RON) was obtained along with the motor octane number (MON). RON is the octane number at normal conditions whereas the MON is at severe conditions. Comparing the different octane numbers for the 5 samples, the optimum was picked according to the highest RON (which would give out the highest MON).
Table 5 Sample Octane Number (RON & MON)
Sample Number
RON
MON
1
95.5
85.3
2
96.8
87.3
3
95.4
85.3
4
96.8
88.4
5
90.7
83.1
[image:4.595.312.542.243.457.2]
Looking at the results above obtained through the octane meter, sample 2 and 4 give the same RON with a value of 96.8. This is the highest RON recorded from the above samples. In order to choose which, one to use as the optimum gasoline blend for euro 3, a comparison of the MON was conducted. Sample 4 has a higher MON of 88.4 but its aromatic contents was too high.
[image:4.595.66.272.717.787.2]Table 6 Samples with Various ETBE Volume Percent
Source
Blendstock
ETBE Volume %
ETBE
0
ETBE
5
ETBE
10
ETBE
15
ETBE
20
Crude
Distillation
F. SRN
15
14
13
12.5
12.5
Lt. SRN
-
-
-
-
_
Hv. SRN
_
_
_
-
_
Upgrading
Units
Isomerate
15
14
13.5
13
12.5
Reformate
40
38
36
35
30
Conversio
n
Units
F. Coker Naphtha
5
5
4.5
4.5
4
Lt. Coker Naphtha
-
-
-
_
_
Hv. Coker Naphtha
_
_
_
-
_
F. Hydrocracking Naphtha
25
24
23
20
21
Lt. Hydrocracking Naphtha
-
-
-
_
_
Hv. Hydrocracking Naphtha
_
_
_
-
_
Purchases
Ethyl-Tertiary
Butyl
Ether
(ETBE)
-
5
10
15
20
However, because of its high aromatic content, it only satisfies euro 3 regulations. Still, euro 3 is an improvement to Egypt and this sample could be produced cheaply since no oxygenated (octane enhancer) compounds were added. From the results acquired above from the tests conducted on the 5 samples, a sample other than the euro 4 optimum was chosen. That sample is labeled sample 5.
Sample 5 blendstock percentages is reminded below:
Table 7 Sample 5 Blend stock Volumes
Blendstock
Volume Percent
%
Full Straight Run Naphtha
15
Isomerate
15
Reformate
40
Full Coker Naphtha
5
Full Hydrocracking
Naphtha
25
This sample was taken and adjusted to fit different ETBE volume percentages of 5%, 10%, 15% and 20%. In addition, throughout the results and discussion, the 0% ETBE was also compared.
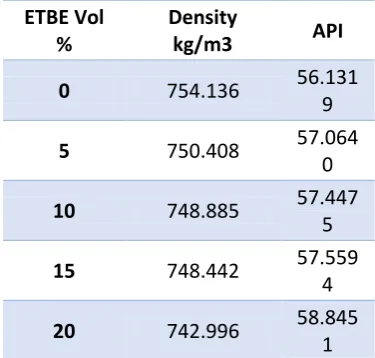
Table 7 shows the different volume percent of each blend stock is blended with the different ETBE volume percentages. Density test was conducted as stated by the ASTM D 4052 at test temperatures between 15oC and 35oC. Table 8 illustrates the effect on density as the volume percent of
[image:5.595.332.520.494.673.2]ETBE increases in the blend. Initially, the blend had a density of 754 kg/m3, however this gradually decreased. ETBE has a density of 745 kg/m3, which is much lower than the gasoline blend free of the additive. It therefore makes sense that as the volume of ETBE increases; it results in the overall decrease in density.
Table 8 ETBE Samples' Densities
ETBE Vol
%
Density
kg/m3
API
0
754.136
56.131
9
5
750.408
57.064
0
10
748.885
57.447
5
15
748.442
57.559
4
20
742.996
58.845
1
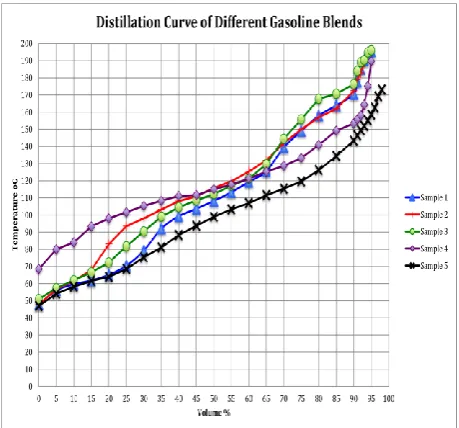
[image:5.595.52.286.519.673.2]Distillation curves allow us to observe the percentages of hydrocarbon evaporation and distill at various temperatures.
Figure 3 Distillation Curve of Tested ETBE-Gasoline Blends
Figure 3 illustrates the results of the 5 samples tested. ETBE 0%, ETBE 5%, ETBE 10%, ETBE 15% and ETBE 20% are plotted. The temperature was recorded at 5% volume intervals to improve precision as appose to the traditional 10% increments. Samples 0%, 5%, and 10%ETBE show steady results indicating that the amount of light to heavy components in the sample are quite similar. However, samples ETBE 15% and 20% should a steeper incline at volume percent of about 45% recovery. After that point, the temperature increased at a steeper gradient to achieve the following volume percent reading. An explanation to this is the evaporation and condensation of the lighter components followed by heavier ones. Before the 45% volume recovers, lighter components were recovered and at a steady increase in temperature. However, after the light components have disappeared and only the heavy is left behind, a higher temperature was needed to evaporate those components.
In addition, as stated above, the density of ETBE is lighter than the standard gasoline blend used. The addition of higher volume percentages such as 15% and 20% allowed the sample to contain lighter components than other samples containing less ETBE.
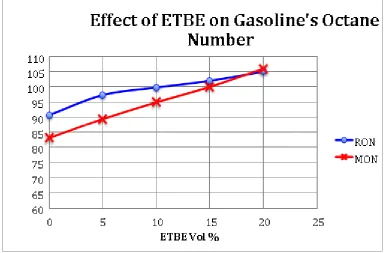
Octane Number represents one of the most important tests when determining the quality of the gasoline fuel. The higher the octane number the higher the quality and vice versa. All the ETBE volume percent samples ran this test and both the research octane number (RON) and motor octane number
(MON) were recorded. The graph below shows the effect on both the RON and MON when an increase in ETBE volume percent is added. As the volume ETBE is added to the gasoline blend, the higher the octane number is read for both the RON and MON. Looking at ETBE 0% and ETBE 5%, there is steep increase in RON. After that, as the ETBE increases in 5% increments, the RON increased but at a steady rate unlike the first 5%. On the other hand, MON increased at a steady rate as the ETBE volume increased in 5% volume increments. MON values are naturally lower than RON since RON is measured at more at east conditions whereas MON is at serve conditions. However, this was not the case at ETBE volume percent at around 18%. What this means is that at that specified volume, the MON has become higher than the RON. This was achieved with the shown volume percent on the graph above. This test is crucial in determining the optimum environmental high-octane gasoline blend for euro 5. Choosing the highest octane number as the optimum is not correct since other factors have to be taken into consideration.
Those factors are limited by the European regulations to preserve the environment. Factors such as aromatic content and oxygen content play a huge role here as discussed in euro regulations previously. This would be determined when discussing the other tests conducted on each sample.
Figure 4 ETBE Samples’ Octane Number (RON&MON)
After choosing an optimum sample to satisfy euro 3 regulations, another sample with a lower aromatic content had to be chosen. Sample 3 chosen for euro 3 had greater potential with its high RON and MON. in addition it complies with euro 3 aromatic content of less than 42%. However, it was set back due to its high aromatic content. To produce a euro 5 blend then, I had to reduce the aromatic content and so sample 5 was chosen that contained 34% aromatic content. This made it acceptable to euro 5 regulations. However, that decrease in aromatic content caused the octane number to decrease compared to the initial values. This produced gasoline with an RON of around 90. Gasoline with an RON 90 that is environmental is considered excellent. However, to increase the octane number ETBE was introduced. The different volume percent used allowed me to observe various results.
IV. CONCLUSION
It was concluded above the samples chosen from euro 3 and euro 5 standards. Both showed high octane numbers and most importantly followed European standards for environmental regulations to help preserve this environment. Optimum ETBE –gasoline blend produced that is environmentally friendly with a high octane number that satisfies euro 5 regulations.
Also, producing maximum yield of commercial gasoline by using Isomerate, petroleum fractions and ETBE.
Acknowledgment
The authors express their deep gratitude for the financial support from the British University in Egypt which enabled us to finish this work.
REFERENCES
1. Mirzoyev, V. (2012). GASOLINE AND ITS ADDITIVES (MTBE, ETBE AND TAME) IN EUROPE, RUSSIA AND UKRAINE . Retrieved
January 2012, from PROBLEMS OF LOCAL
SELF-GOVERNMENT:
http://www.samoupravlenie.ru/42-12_en.php Abdel Razak, A. (2009). Petroleum Refining . Cario.
2. Adminstration, E. I. (2000). MTBE, Oxygenates and Motor Gasoline. USA: EIA . AVL. EU Union Euro 5 & 6 . Bowden , J., & Stavinoha , L. (2005). Evaluation of Motor Gasoline Stability . Belviors Fuel , 16. 3. Chaudhuri , U. R. (2010). Fundamentals of Petroleum and
Petrochemical Engineering. Calcutta : CRC Press.
4. Commision, E. (n.d.). Commission plans legislative framework to ensure the EU meets its target for cutting CO2 emissions from cars. Retrieved from http://europa.eu/rapid/pressrelease_IP-07-155_en.htm 5. Croezen , H., & Kampman , B. (2009, July 23). The impact of ethanol and ETBE blending on refinery operations and GHG-emissions . Energy Policy , 1-13. da Silva , R. N., Catalun a, , R., Weber de. ene es , E., Samios, D., Piatnicki , C. . (2005). Effect of additives on the antiknock properties and Reid vapor pressure of gasoline . Fuel (84), 951-959.
6. EFOA. (2006). ETBE. EU: Technical Product Bulletin .
7. EPA. (2008). MTBE. Regulatory Determinations Support Document . 8. Fahim, M. A., Alsahhaf, T. A., & Elkilani, A. (2010). Fundamentals of
Petroleum Refining. Amsterdam.
9. Hamedi, A. S. (2010). elective Additives for Improvement of Gasoline Octane Number . Tikrit Journal of Eng. Sciences , 1-14.
10. Kenneith, R. EU Biofuels Regulations.
11. Little , D. M. (2011). An Introduction to Petroleum Refinery and Production of Ultra Low Sulphur Gasoline Deisel Fuel. ICCE. 12. Miller, J. (n.d.). Global Comparision Fuels . Retrieved from
Transportation Policy :
http://transportpolicy.net/index.php?title=Global_Comparison:_Fuels 13. Newell, R. G., & Rogers, K. (2003 ). The U.S. Experience with the
Phasedown of Lead in Gasoline. Washington,: Resoures .
14. Pujado , P., & Jones , D. (2006 ). Handbook of Petroleum Processing. Calgary : Springer
15. Rose, k. (2012). EU Biofuels Situation. Conservation of Clean Air and Fuel in Europe .
18. Soliman, M. (2009). Introduction to Modern Refining Engineering. Cairo: Dar El Hedia .
19. Solutions, A. P. (2011). Blending biofuels in the European Union . Accenture , 1-20.
20. Wagner, V. (2013, August ). EU Fuels: Diesel and Gasoline .
Retrieved from Transportation Policy :
http://transportpolicy.net/index.php?title=EU:_Fuels:_Diesel_and_Ga soline
21. Wallace, G. (2012). The Role of Bio-ethers in Meeting National Biofuel Targets . Brussels: EFOA.
22. Weber de ene es , E., Catalun a, , R., Samios, D., da Silva , R. 00 ). Addition of an azeotropic ETBE/ethanol mixture in eurosuper-type gasolines . Fuel , 2567–2577 .
23. Yuan, H. (2006). ETBE as an additive in gasoline: advantages and disadvantages . Norrköping, : The Tema Institute Campus Norrköping
24. B. Ashraf, M. A. Radwan, M. A. Sadek, H. A. Elazab International Journal of Engineering and Technology (UAE), 2018, 7, 1295-1298.
25. A. R. Mostafa, H. A.-S. Omar, A. E. Hany Agricultural Sciences, 2016, Vol.08No.02, 11.
26. N. S. Samir, M. A. Radwan, M. A. Sadek, H. A. Elazab International Journal of Engineering and Technology (UAE), 2018, 7, 1290-1294.
27. H. A. Elazab, M. A. Sadek, T. T. El-Idreesy Adsorption Science & Technology, 2018, 36, 1352-1365.
28. F. Zakaria, M. A. Radwan, M. A. Sadek, H. A. Elazab, International Journal of Engineering and Technology, 2018, 7, 4, 1983-1988.
29. R. Nasser, M. A. Radwan, M. A. Sadek, H. A. Elazab, International Journal of Engineering and Technology, 2018, 7, 4, 1989-1994.
30. M. Ghobashy, M. Gadallah, T. T. El-Idreesy, M. A. Sadek, H. A. Elazab, International Journal of Engineering and Technology, 2018, 7, 4, 1995-1999.
31. H. A. Elazab, Biointerface Research in Applied Chemistry, 2018, 8, 3314-3318.
32. H. A. Elazab, Biointerface Research in Applied Chemistry, 2018, 8, 3278-3281.
33. H. A. Elazab, M. A. Radwan, T. T. El-Idreesy International Journal of Nanoscience, 2018, 17, 3, 1850032.
34. M. A. Radwan, Omar Al-Sweasy, M. A. Sadek, Hany A. Elazab, “Investigating the Agricultural Applications of Acryl Amide based Hydrogel”, International Journal of Engineering and Technology(UAE), Volume 7, No 4.29, 168-171, November 2018.
35. Hany A. Elazab, “Investigation of Microwave-assisted Synthesis of
Palladium Nanoparticles Supported on Fe3O4 as an Efficient Recyclable Magnetic Catalysts for Suzuki Cross – Coupling, The Canadian Journal of Chemical Engineering, 2018.
36. Hany A. Elazab, Mamdouh Gadall, M. A. Sadek, Tamer T. El-Idreesy, “Hydrothermal Synthesis of Graphene supported Pd/Fe3O4 Nanoparticles as an Efficient Magnetic Catalysts for Suzuki Cross – Coupling”, Biointerface Research in Applied Chemistry, 2019.
37. M. A. Radwan, Mohamed Adel Rashad, M. A. Sadek, Hany A. Elazab, Synthesis, Characterization and Selected Application of Chitosan-Coated Magnetic Iron Oxide nanoparticles, Journal of Chemical Technology and Metallurgy, 2019.
38. Hany A. Elazab, S. A. Hassan, M. A. Radwan, M. A. Sadek, “Hydrothermal Synthesis of Palladium Nanoparticles Supported on Fe3O4: An Efficient Magnetic Catalysts for CO Oxidation,
International Journal of Innovative Technology and Exploring Engineering (IJITEE), 2019.
39. Hany A. Elazab, M. M. Seleet, Said M. A. Hassanein, M. A. Radwan, M. A. Sadek, Synthesis and characterization of Dinitro Pentamethylene Tetramine (DPT), International Journal of Innovative Technology and Exploring Engineering (IJITEE), 2019
40. Hany A. Elazab, M. M. Seleet, Said M. A. Hassanein, M. A. Radwan, M. A. Sadek, Follow-up and Kinetic Model Selection of Dinitro Pentamethylene Tetramine (DPT), International Journal of Innovative Technology and Exploring Engineering (IJITEE), 2019.
41. Hany A. Elazab, M. M. Seleet, Said M. A. Hassanein, M. A. Radwan, M. A. Sadek, 3,7-Dinitro-1,3,5,7-Tetraazabicyclo [3,3,1]Nonane (DPT):An important intermediate in the synthesis route of one of the most powerful Energetic materials (RDX/HMX), International Journal of Innovative Technology and Exploring Engineering (IJITEE), 2019.
42. W. Mohsen, M. A. Sadek, H. A. Elazab International Journal of Applied Engineering Research, 12, 14927-14930, 2017.
43. R. A. Mankarious, M. A. Radwan, M. Shazly, H. A. Elazab Journal of Engineering and Applied Sciences, 12, 2697-2701, 2017.
44. Marwa M. Naeem, M. A. Radwan, M. A. Sadek, H. A. Elazab Journal of Engineering and Applied Sciences, 12, 1179-1185, 2017.
45. Hany A. Elazab, S. Moussa, B. Gupton, M. El-Shall Journal of Nanoparticle Research. 2014, 16, 1-11, 2014.
46. Hany A. Elazab, S. Moussa, A. Siamaki, B. Gupton, M. El-Shall Catalysis Letters, 147, 1510-1522, 2017.
47. Hany A. Elazab, A. R. Siamaki, S. Moussa, B. F. Gupton, M. S. El-Shall Applied Catalysis A: General. 2015, 491, 58-69, 2015.
48. Hany A. Elazab, S. Moussa, K. W. Brinkley, B. Frank Gupton, M. Samy El-Shall Green Processing and Synthesis, 6, 413-424, 2017.
49. Hany A. Elazab, M. A. Sadek, Tamer T. El-Idreesy, “Facile Synthesis of Reduced Graphene Oxide-Supported Pd/CuO Nanoparticles as an Efficient Catalyst for Cross-Coupling Reactions”, Journal of Chemical Technology and Metallurgy, 2019.
50. Sherif Elbasuney, M. A. Radwan, Hany A. Elazab, “Steric stabilization of colloidal aluminium particles for advanced metalized- liquid rocket propulsion systems”, Journal of Chemical Technology and Metallurgy, 2019.
51. Sherif Elbasuney, M. A. Radwan, Hany A. Elazab, “Novel thermoset nanocomposite intumescent coating based on hydroxyapatite nanoplates for fireproofing of steel structures”, Journal of Chemical Technology and Metallurgy, 2019.
52. Hany A. Elazab, Tamer T. El-Idreesy, “Polyvinylpyrrolidone - Reduced Graphene Oxide - Pd Nanoparticles as an Efficient Nanocomposite for Catalysis Applications in Cross-Coupling Reactions”, Bulletin of Chemical Reaction Engineering and Catalysis, 2019.