Abstract: Anomaly detection is a challenging task for IoT data, which aims to identify observations that deviate from a nominal sample. Traditional distance-based, mostly anomaly-based methods of detection estimate the neighborhood distance between each view and suffer in high space from the curse of dimensionality. In this paper, we propose a hybrid semi-supervised model of anomaly detection for high-dimensional data consisting of two parts: a deep autoencoder (DAE) and an anomaly detector based on the nearest neighbor graphs (NNG). Benefiting from nonlinear mapping ability, the DAE is first trained to learn the essential features of a high-dimensional dataset to represent high-dimensional data in a more compact subspace. Several nonparametric anomaly detectors based on KNN are building those randomly sampled from the entire dataset from different subsets. All detectors of anomaly make the final prediction. The proposed method is evaluated on the ECG data set generated by the IoT Sensing element node and the results also ensure that the proposed hybrid model improves the accuracy of detection and reduces the complexity of the computation.
Index Terms: ECG, wearable sensors, anomaly, DAE, Deep autoencoder, NNG, KNN..
I. INTRODUCTION
Three critical symptoms are usually collected in an IoT-based health monitoring system. These are heartbeats, rates of pulses, and saturation of oxygen. As described above, sending only abnormal data via wireless links is more energy efficient. To decide whether a data stream of a real-time sensor contains anomalous data, an anomaly detection scheme must be used. Anomalies are known in various application domains as outliers[1], exceptions[2], aberrations, and surprises[3]. Detection of abnormality identifies samples that do not conform to the behavior expected. Standard samples usually have similar distributions in reality, while abnormal samples have different distributions. Detection of anomalies has been applied in many areas, including detection of fraud[4], detection of intrusion[5], and healthcare[6].
Revised Manuscript Received on June 05, 2019
K.V.Daya Sagar, Research Scholar, Shri Venkateshwara University, Gajraula, Uttar Pradesh., India.
DBK Kamesh, Professor, Mall Reddy Engineering College for Women, Maisammaguda, Secunderabad
In this paper, we propose a semi-supervised model for IoT medical data detection of anomalies consisting of two parts: a deep autoencoder(DAE) and an anomaly detector based on an ensemble-nearest neighbor graph (NNG).
The DAE is trained in unsupervised model and is used to map IoT medical high dimensional data into a feature space with lower dimensionality. This process solves the curse of dimensionality that exists in nearest neighbor calculations. This process dramatically reduces the computational cost of calculating the nearest neighbors and improves the detection accuracy compared with building a single anomaly detector using the complete dataset. We collect the heartbeat data from various sensor nodes from IoT health monitoring system to apply deep autoencoder and detect an abnormal signal or abnormal heartbeats within 40 seconds experts of the pulse when compared to regular heartbeat rate.
The rest of this paper is organized as follows. Section 2 brief ly presents other researchers ' related work. In Section 3, we detail the proposed hybrid model. The experimental results and discussion are provided in Section 4, and we conclude th e paper in Section 5
II. RELATED WORK
Detection of anomalies is widely used in many fields, and in past years different methods have been proposed. For more details, we refer the readers to good survey papers [ 3, 19-21 ]. We review several of the most widely used methods of de tection of anomalies and recent developments in this section. Heart arrhythmias result from any disturbance of regularity, rate, origin site, or conduction of cardiac electrical impulses[1][2]. In a sensor-based medical information system, we need to use an anomaly detection scheme that is not computationally expensive due to the limited power resources. In a seminal paper[4], the authors introduce the new issue of finding time series discords[4]. Time series disorders are subsequences of a longer time seri es that differ significantly from all other time series subseque nces. Time series disorders have many uses for data mining, including data cleaning, clustering quality improvement, and anomalies detection.
The scheme Adaptive Window Based Discord Discovery (AWDD) proposed in paper[4 ] motivated by the two systems in [ 6 ], Reference[32 ] proposed a non-parametric method for estimating the outlier degree for each test sample. It was thought that samples with
higher scores were outliers.
An Implementation of Anomaly Detection in IoT
Medical Data using Deep anomaly Detection
Models
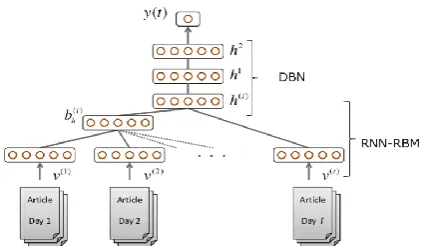
Figure 1: The Model architecture of DAE, DBN, and RBM.
A novel neighbor concept called natural neighbor (NN) was proposed. Subjects A and B were NNs if A was one of B and B's closest neighbors, one of A's nearest neighbors. The natural outlier factor (NOF) was calculated to measure the outliers from the inherent value, but without known counter samples it was difficult to determine the suitable threshold for outlier degree.
III. METHODOLOGY
III.1. Deep Autoencoder: DAE was developed from DBN, which was first proposed in [15]. A DAE is composed of two symmetrical DBNs that typically have more than one shallow layer representing the encoding half of the net and corresponding to the decoding net. A DBN can be obtained by stacking multiple RBMs. An RBM is an undirected graphical model with ℎ visible units V representing observations and hidden units learning to describe features. In contrast to the general Boltzmann machine, the nodes of an RBM are not connected at the same level. The trained RBM maps the input vector=| |x (also known< as V) to a feature space of dimensions, where and is the dimensionality of V. Figure 1 illustrates the model architectures of DAE, DBN, and RBM. As an autoencoder method, DAE seeks the solution by minimizing the reconstruction error. In the simplest case, where there is one hidden layer, the DAE encoder stage maps input into a smaller feature space that can be formulated as
h=σ(W.x+b), (1)
where x represents the input vector, σ is an element-wise activation function, such as a sigmoid function or a rectified linear unit, is a weight matrix, and̂ b is a bias vector.
In the decode stage, the output x is reconstructed from the mapped h, which has the same dimensions as x:
, (2)
where is the decoding matrix and is a vector of biases of the output layer.
The parameters are determined by optimizing the reconstruction error, such as the squared error:
(3)
In practice, the deep architecture of DBN demonstrates high power in nonlinear mapping. However, the presence of many layers implies a large number of parameters to learn, and the traditional back-propagation (BP) is not efficient without a proper initialization of the weights. Thus, pretraining is adopted to improve the boot of the parameters. One widely used pretraining method is to train each DBN layer as an individual RBM, where the hidden output of the previous layer is treated as the visible input for the subsequent layer. RBM encodes the energy between visible input vector v and hidden output h as given by
Where V𝑖 and ℎ𝑗 are the visible and hidden units, respectively; 𝑤𝑖𝑗 is the weight connecting units 𝑖 and 𝑗; 𝑀 denotes the number of visible units; 𝑁 represents the number of hidden units; and 𝑏𝑖 and 𝑐𝑗 are the biases for the visible and hidden units, respectively. The conditional distribution 𝑝(h | k) can be calculated as
The conditional distribution 𝑝(h | k) is calculated as
RBM is trained to determine the values of parameters 𝜃 such that (4) is minimized. After the RBM pretraining is complete, the parameters learnt on the layer wise basis are sed as the initial parameters to train the whole DAE via the traditional BP algorithm.
III.2. Anomaly Detector. Let 𝑆 = {𝑥 1, . . . , 𝑥𝑛} be the given normal training set sampled from a density 𝑓0 and 𝑥𝑖∈𝑅𝑑. Assume that the test sample is from amixed distribution of 𝑓0 and𝑓1.The task of anomaly detection is to determine whether the test sample is consistent with normal data or deviates from normal under the specified significance level:
𝑃(declare𝐻1 | 𝐻𝑜) ≤ 𝛼. Reference [18] proves that anomaly detection is equivalent to the thresholding 𝑝 value for multivariate data. The 𝑝 value of a test sample 𝜂 is defined as
Equation (7) can be considered to be a mapping 𝜂 →[0, 1]. For a given significance level 𝛼, 𝜂 will be declared as anomalous if 𝑝(𝜂) ≤ 𝛼.
Reference [18] proposed a method to estimate the 𝑝 value for test samples
We propose an ensemble method to calculate the
distance matrix for a test sample. This subsampling method can reduce the variance of the 𝑘-nearest neighbor distance and increase the robustness.
We first randomly sample 𝐿 subsets with replacement from the entire training set. Each subset has 𝑄 elements denoted as
𝑆𝑙 = {𝑥𝑙 1, . . . , 𝑥𝑙 𝑄}, 𝑙 = 1, . . . , 𝐿. For each element 𝑥𝑙 𝑞, we calculate the 𝑘th nearest neighbor distance among all subsets
𝑆𝑙; thus, 𝑥𝑙 𝑞 has 𝐿𝑘th nearest neighbor distances. The real
𝑘th nearest neighbor distance for each element is averaged by these 𝐿 values, which is formulated as
where 𝐷𝑖(⋅) denotes the 𝑘th nearest neighbor distance calculated from subset 𝑆𝑖 and 𝐺(⋅) is the real 𝑘th nearest neighborhood distance. The real 𝑘th nearest neighbor distance for a test sample 𝜂 is calculated using the methods mentioned above; then, its estimated 𝑝 value is calculated following (9) [18], by plugging the value into each subset 𝑆𝑙:
where i is an indicator function. For a given false alarm rate 𝛼, the final decision of 𝜂 is determined by (11):
[image:3.595.52.289.583.740.2]where 1 denotes an anomalous sample, and −1
represents a normal sample.
𝐶
(
⋅
) represents the
prediction result. We set
𝐿
as an odd number; thus,
themean
𝐶
(
𝜂𝑙
) cannot be zero.The
v
alue of
𝛼
controls the false alarm rate in the training data.
Figure 2: The flow chart of the proposed hybrid anomaly detection model[1].
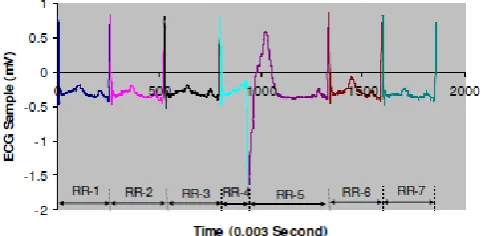
Figure3: A typical ECG Monitoring System for Collecting ECG data
Figure 3 displays a heartbeat standard one-cycle ECG signal. From Figure 3, the P wave, QRS wave to T wave consists of one cycle. P wave provides advantage information for both atria about the propagation time of the impulse. Then follow a flat trend called the PR segment as a result of the propagation of the electrical impulse from atria to ventricles. And follow with the complex QRS wave that you can see in the figure above. The complex of Q, R and S contain three small waves, i.e., small Q waves, high R waves, and small S waves. Due to the impulse propagation to the ventricles (Q wave), the QRS complex provides information about the ventricular systole.
Algorithm 1: The procedure of the proposed hybrid model[1]
Input: Training set 𝑂, query sample 𝜂, desired false alarm rate 𝛼, nearest neighbor 𝑘,
number of subsets 𝐿, number of elements in one subset 𝑄, hyperparameter
sets 𝜃for DAE.
Output: The label of query sample 𝐶(𝜂) (1) Train DAE with the whole training set 𝑂 and predefined parameter set 𝜃.
(2) Process 𝑂 and 𝜂 with the trained DAE. The dimension-reduced training set 𝑂 is
denoted as 𝑆.
(3) Generating 𝐿 subsets 𝑆𝑙= {𝑥𝑙
1, . . . , 𝑥𝑙
𝑄}.
(4) for 𝑙 = 1, . . . , 𝐿do
(5) for 𝑞 = 1, . . . , 𝑄do
(6) for 𝑖 = 1, . . . , 𝐿do
(7) Calculate the 𝑘th nearest neighbourhood distance 𝐷𝑖(𝑥𝑙𝑞) for 𝑥𝑙
𝑞in subset 𝑆𝑖. (8) end for
(9) Calculate 𝐺(𝑥𝑙 𝑞) with Eq. (8). (10) end for
(11) end for
(12) Repeat (6)–(9) to calculate 𝐺(𝜂𝑙). (13) for 𝑙 = 1, . . . , 𝐿do
(14) Calculate ̂ 𝑝(𝜂𝑙) with Eq. (9). (15) Calculate 𝐶(𝜂𝑙) with Eq. (10). (16) end for
IV. EXPERIMENTALRESULTSANDANALYSIS In the ECG Signal Anomaly detection have 12-lead ECG recordings (leads I, II, II, aVR, aVL,aVF, V1, V2, V3, V4, V5, and V6) Simulating 12-leads signals, normalized interval (-1) -> (1). In this data, we are analyzing with various deep anomaly detection algorithms, and we evaluate the proposed hybrid model with IoT Medical data like ECG monitoring data set and compare with other anomaly detection models. Practically algorithms are implemented in backend TensorFlow and fronted as Jupiter notebook.
IV.1.Experimental Methodology
IV.1.1. Used data sets and experimental setups. We choose data set from IoT based ECG monitoring system .ECG data set contains 279 attributes and has four groups of labels for different tasks. We conducted Several experiments with this dataset. In this scenario of experimentation one class was treated as the normal class, and the others were used as the anomalous class. In each experiment, 80% of the normal samples were randomly selected for training, and we generated a testing set with an equal number of normal samples and anomalous samples from the remaining samples. Thus, we can evaluate both the false alarm rate and the false acceptance rate to measure the performance of the proposed model.
Figure 4: Discord discovery Model for ECG Signal Analysis
The figure4 shows the simulations results of the proposed algorithm actual discord discovery model of ECG signal analysis
Figure5: ECG Signal Subsequence before Normalization In figure5 shows the ECG signal subsequent before normalization status
Figure5: ECG Signal Subsequence before Normalization In figure5 shows the ECG signal subsequent before normalization status
[image:4.595.47.290.355.473.2]Figure6: ECG Signal Subsequence after Normalization In figure6 shows the ECG signal subsequence after normalization status
Figure 7: Loss of ECG Signals
In figure7 shows, the actual loss of ECG normal signal and figure8 shows the abnormal status of signals apart from that we consider the accurate anomaly detection in the data set.
Figure8: Reading of ECG Signals abnormal variations
V.CONCLUSION
In this paper, we proposed a hybrid semi-supervised anomaly detection model for IoT based medical data the model consists of a DAE and an ensemble KNN-based anomaly detector. The DAE is trained in unsupervised mode to transform high-dimensional data into a more compact feature space. Considering that the distribution of the training set is more compact in the compact feature space, it is possible to build powerful anomaly detectors with a portion of a dataset rather than using the whole training set. The ensemble anomaly detectors have a smaller standard deviation than a single indicator built from
reduces the computational cost.
The experimental results are an analysis of IoT based health monitoring system ECG data set and demonstrate that the proposed model performs better than standalone algorithms. Considering that DAE training has been thoroughly researched and almost no parameters of the anomaly detector need to be trained, the hybrid model can easily be applied in various fields.
REFERENCES
1. Zhe Yang_, Qihao Zhou_, Lei Leiz, Member, IEEE, Kan Zheng_, Senior Member, IEEE, Wei Xiangy, Senior Member, IEEE, “An IoT-cloud Based Wearable ECG Monitoring System for Smart Healthcare,”Journal of Medical Systems · December 2016.
2. Mooi Choo Chuah, Fen Fu, “ECG Anomaly Detection via Time Series Analysis,” https://link.springer.com/chapter/ 10.1007/978-3-540-74767-3_14
3. V. J. Hodge and J. Austin, “A survey of outlier detection methodologies,” Artificial Intelligence Review, vol. 22, no. 2, pp. 85– 126, 2004.
4. Hongchao Song, Zhuqing Jiang, Aidong Men, and Bo Yang “A Hybrid Semi-Supervised Anomaly Detection Model for High-Dimensional Data,” HindawiComputational Intelligence and Neuroscience Volume 2017, Article ID 8501683, 9 pages
5. E. Suzuki, T. Watanabe, H. Yokoi, and K. Takabayashi, “Detect-ing interesting exceptions from medical test data with visual summarization,” in Proceedings of the Third IEEE International Conference on Data Mining, pp. 315–322, Melbourne, Fl, USA. 6. V. Chandola, A. Banerjee, and V. Kumar, “Anomaly detection: a
survey,” ACM Computing Surveys, vol. 41, no. 3, article 15, 2009. 7. R. J. Bolton and D. J. Hand, “Statistical fraud detection: A review,”
Statistical Science, vol. 17, no. 3, pp. 235–255, 2002.
8. A. Lazarevic, L. Ertoz, V. Kumar, A. Ozgur, and J. Srivastava, “A comparative study of anomaly detection schemes in network intrusion detection,” in Proceedings of the 3rd SIAM International Conference on Data Mining, San Francisco, Calif, USA, 2003.
9. S. C¸ ınar and N. Acır, “A novel system for automatic removal of ocular artifacts in EEG by using outlier detection methods and independent component analysis,” Expert Systems with Applications, vol. 68, pp. 36–44, 2017.
10.Z. Xue, Y. Shang, and A. Feng, “Semi-supervised outlier detection based on fuzzy-rough C-means clustering,” Mathematics and Computers in Simulation, vol. 80, no. 9, pp. 1911–1921, 2010. 11.B. Singh, N. Kushwaha, and O. P. Vyas, “Exploiting the anomaly
detection for high dimensional data using the descriptive approach of data mining,” in Proceedings of the 4th IEEE International Conference on Computer and Communication Technology, ICCCT 2013, pp. 121–128, and, September 2013.
12.Lazarevic and V. Kumar, “Feature bagging for outlier detection,” in Proceedings of the KDD-2005: 11th ACM SIGKDD International Conference on Knowledge Discovery and Data Mining, pp. 157–166, USA, August 2005.
13.M.-L. Shyu, S.-C. Chen, K. Sarinnapakorn, and L. Chang, “A novel anomaly detection scheme based on a principal component classifier,” in Proceedings of the 3rd IEEE Int. Conf. Data Mining, pp. 172–179, 2003.
14. M. Sakurada and T. Yairi, “Anomaly detection using autoencoders with nonlinear dimensionality reduction,” in Proceedings of the 2nd Workshop on Machine Learning for Sensory Data Analysis, (MLSDA ’14), pp. 4–11, Gold Coast, Australia QLD, Australia.
15.N. Abe, B. Zadrozny, and J. Langford, “Outlier detection by active learning,” in Proceedings of the 12th ACM SIGKDD international conference Knowledge discovery and data mining,504–509. 16.M. Zhao and V. Saligrama, “Anomaly detection with score functions
based on nearest neighbor graphs,” in Proceedings of the 23rd Annual Conference on Neural Information Processing Systems, NIPS 2009, pp. 2250–2258, 2009.
17.B. Scholkopf,¨ J. C. Platt, J. Shawe-Taylor, A. J. Smola, and R. C. Williamson, “Estimating the support of a high-dimensional distribution,” Neural Computation, vol. 13, no. 7, pp. 1443–1471, 2001.
18.D. M. J. Tax and R. P. W. Duin, “Support vector data description,” Machine Learning, vol. 54, no. 1, pp. 45–66, 2004.
19.M. Radovanovic,´ A. Nanopoulos, and M. Ivanovic,´ “Reverse nearest neighbors in unsupervised distance-based outlier detection,” IEEE
Transactions on Knowledge and Data Engineering, vol. 27, no. 5, pp. 1369–1382, 2015.
20.H. Liu, X. Li, J. Li, and S. Zhang, “Efficient outlier detection for high-dimensional data,” IEEE Transactions on Systems, Man, and Cybernetics, 2017.
AUTHORSPROFILE
K.V.Daya Sagar,Research Scholar, Shri Venkateshwara University, Gajraula, Uttar Pradesh., India, his research interests are Cloud Computing, IoT ,Cyber Security, Machine Learning and deep learning.
Dr. DUVVURI B K KAMESH,
![Figure 2: The flow chart of the proposed hybrid anomaly detection model[1].](https://thumb-us.123doks.com/thumbv2/123dok_us/8199542.260382/3.595.52.289.583.740/figure-flow-chart-proposed-hybrid-anomaly-detection-model.webp)