The Exorbitant Rise of Educational Expenditure
and Its Falling Impact on Economic Growth: An
Underlying Cause of Economic Slow-Down.
Rajarethinam Emmanuel, S.N. Sugumar, S. Chandrachud, S. Jansirani, S. Sudha
Abstract: The aspirational middle class of India has tripled its proportion of expenditure on education in the last three decades hoping for gainful employment of their progeny. But our public and the private educational institutions have failed to create an equally rewarding skillful and innovative class of graduates. The mismatch between the extent of resources consumed by educational institutions and the final output has structurally resulted in a slow-down of economy witnessed in recent times. Inspired by this direction of search, we would present evidence in this article to the effect that the mismatch between the burgeoning educational expenditure and the lackluster outcome in terms of knowledge and skills has seriously punctured the India-shining growth story that had just begun to pick up in the first decade of the millennium.
Key Words: Educational Expense, 5 trillion, GDP, Investment
I. INTRODUCTION
India, the sixth largest economy, remains far behind in per capita income. As per IMF, the country is ranked at 145th position with just $2199 of per capita income while the world’s average is at $11673. [1].
In the five year period of 2003-08, our economy grew at an impressive 8.7 % CAGR and that led to the widespread opinion that the 21st century belongs to countries like India and China. But the kind of reverse seen in recent years has surprised everyone across the globe. China maintained its pace of double digit growth for more than three decades and it is already the second largest economy today, commanding a 73rd rank in per capita as well [1].
Undoubtedly, our political and economic structure can never be compared with that of China. However, it’s incumbent upon us to explore the structural issues contributing to the slowdown of the economy.
The ill-conceived demonetization and the poorly-executed GST are repeatedly cited as the cause for the latest trigger in the slow-down. The NPAs of Banking and Non-banking Financial sectors and the stress in real-estate could also be the other major weaknesses. However, according to Raguram Rajan, the Ex RBI governor, even these issues could just be the symptom and not the fundamental reason. [2].
Revised Manuscript Received on December 05, 2019.
Dr. Rajarethinam Emmanuel, Asst. Prof. , Department of Economics,
Vels Institute of Science, Technology and Advanced Studies, Chennai, India.
Dr. S.N. Sugumar, Professor and Head of Department, Economics,
Vels Institute of Science, Technology and Advanced Studies, Chennai.
Dr. S. Chandrachud, Economist, currently serves as Professor in the
Department of Economics, VISTAS, Chennai, India.
Dr. S. Jansirani, Professor, Department of Economics, Vels Institute of
Science, Technology and Advanced Studies, Chennai, India.
Dr. S. Sudha, Asst. Prof. , Department of Economics, Vels Institute of
Science, Technology and Advanced Studies, Chennai, India.
The unemployment level is at its three year high of 8.4%, as per the study of the Center for Monitoring Indian Economy. [3].
It’s no secret that our country of over 1.25 billion, sends 12 million youngsters to the job market every year. According to the World Bank, India needs to create 8 million jobs annually just to keep the employment rate constant. [4]. The IT sector was absorbing the educated youth for the past two decades. Now due to automation, 1.2 lakh middle level employees might lose their jobs in 2020 alone. [5]
For quite many decades, economists warned of the ramifications of the jobless growth, witnessed in modern times. Now it certainly appears to be the case, with the successive data proving the trend leaving no one in doubt any longer.
What exactly is holding us back? Will the traditional methods of reducing taxes, writing off NPAs and widening the budget deficit, put the economy back on a high pitch growth?
These are the issues we would be addressing through this article.
Hypothesis: One of the major structural issues that hold India from utilizing its ample potentials for a double digit growth is the following:
The aspirational middle class of India has doubled and tripled its proportion of expenditure on education in the last three decades hoping for gainful employment of their progeny. But both our public and the private educational institutions have failed to create an equally rewarding skillful and innovative class of graduates. The mismatch between the extent of resources consumed by educational institutions and the final output has structurally resulted in a slow-down of growth witnessed in recent times.
Inspired by this direction of search, we would present evidence in this article to the effect that the mismatch between the burgeoning educational expenditure and the lackluster outcome in terms of knowledge and skills has seriously punctured the India-shining growth story that had just begun to pick up in the first decade of the millennium.
II. METHODOLOGY
To assess educational impact on the growth of economy, we need year-by-year data on GDP as well as educational expenditure. While such GDP data is certainly accessible, there’s no agency to provide year-by-year data on educational expenditure. However, we do have the NSS surveys on educational expenditure specifically for the years 1995-96, 2007-8 and 2014. From this highly reliable sample surveys held between a gap of 5 to 10 years, we can certainly arrive at the
sets can then be put into a regressive analysis.
A positive correlation between educational expenditure and GDP ought to be the case, given the fact that a higher percentage of well-trained population will contribute to the growth of economy. If on the contrary we do come across, a negative correlation or a mismatch of growth between the two - for instance educational expenditure shooting up abnormally and the GDP curve nose-diving after a peak - this would automatically imply a serious structural impediment that has finally resulted in the slow-down of the economy.
It could still be argued that the investment on education is a long-term capital expenditure and its impact on GDP can only be assessed at a much later stage. Even if we accommodate this argument, an abnormal growth seen in educational expenditure till 2014 for which we have the NSS data, ought to have yielded a comfortable growth level in GDP at least after a time-lag of 5 years which means by 2019 at least. We do have GDP data up to 2019 and we can easily verify whether or not there is a positive impact created. A methodology of analyzing the CAGR of educational expenditure till 2014 available from NSSO data against GDP growth extended up to 2019 and to verify if there is a correlation or a mismatch between the two, is therefore an extremely consistent one.
The time period taken up for this analysis can be roughly described as tri-decadal. The NSS data on household educational expenditure is available only for certain specific years and accordingly we would divide the entire time period into 3 phases for the purpose of our analysis.
Phase I : Between 1995-96 and 2007-08 Phase II: Between 2007-08 and 2014-15 Phase III: Between 2014-15 and 2018-19
III. RESULTS
Phase 1:
Between the two NSS surveys held in 1995-96 and 2007-08, we get to learn that there was a spectacular increase of 146% in the overall educational expense, incurred by households. Above the Higher Secondary level, this expenditure went up to 152%. This in effect implies that the overall educational expenditure was growing at a CAGR (Compounded Annual Growth Rate) of 12.17% and the college education expenditure was growing at a CAGR of 12.67% in phase I. Had all such expenditure resulted in a positive outcome, the economy should also have grown at a double digit level at least after a certain time lag. But the data we have on GDP ever since 2008 till the end of 2019 reveals a clear trend of decline. GDP growth had slowed-down from the 8.7% mark achieved in the period 2003-08 [6] all the way down to the 6.8% for the year 2018-19. [7]
We also find that the compounded annual growth rate in private consumption between 1997-03 was just 4.6% and it went up to 7.5% between 2003-08. [6]. This implies that the overall consumption growth was perfectly in tune with the growth in GDP. It’s only the educational expenditure that appears to have skyrocketed in the last three decades, without making a corresponding impact on GDP.
The line of argument becomes clearer, when one considers the next phase of NSS data on educational expenditure. Phase 2:
Between 2007-08 (64TH round NSS) and 2014 (71st round NSS) there has been an increase of 176 % in the overall
educational expense. And much of it was due to the increasing enrolment in private educational institutions starting right from LKG onwards. While the college education expenditure saw a 100% increase in the given period, there was a 96% increase in the technical education and a 86 % increase in the vocational education.
At primary level the expenditure was Rs. 1111 in government institutions compared to Rs. 10623 in private institutions.
At upper primary level, the average expenditure was Rs. 1869 in government institutions compared to Rs. 13808 in private institutions
At secondary level, the average expenditure was Rs. 3724 in government institutions as against Rs. 15785 in private institutions.
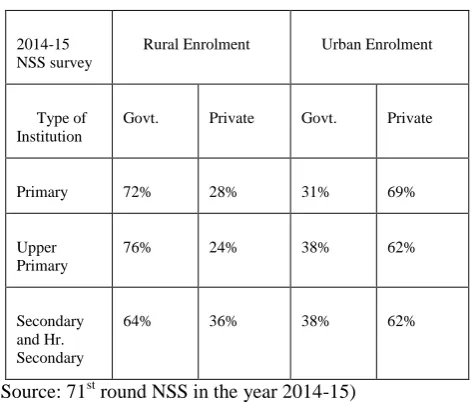
[image:2.595.308.545.345.546.2]Above this the expenditure for private institutions was three times that of the government institutions. There’s a clear trend of privatization in education right from class 1 onwards and in the upcoming decades, the cost of education is expected to maintain a similar pace of increase. As per the 71st round of NSS for the year 2014-15, enrolment in private institutions is about 30% in rural area and it has already reached a 69% share in the urban area.
Table 1: Share of enrolment in Govt. and Private institutions as per NSS held in 2014-15.
2014-15 NSS survey
Rural Enrolment Urban Enrolment
Type of Institution
Govt. Private Govt. Private
Primary 72% 28% 31% 69%
Upper Primary
76% 24% 38% 62%
Secondary and Hr. Secondary
64% 36% 38% 62%
(Source: 71st round NSS in the year 2014-15)
In terms of CAGR, the overall educational expense for the period 2007-14 was at a staggering 29.3% when the growth in private consumption was just at 8.1%. This is already a 3.6 times above the normal consumption growth and it hardly matches with the GDP growth rate up until 2019.
Phase 3:
From RBI and CSO data, CAGR of GDP factor cost and private consumption can be tabulated. Apart from a slight variation between the two, which actually implies an increase or decrease in Gross Fixed Capital Formation and Government Expenditure, there’s no major surprise here.
But the household expenditure on education, as already shown, is on a sharp rise. With a clear trend of privatization of education, this expenditure is set to rise even further and the estimate for 2014-19, Phase III of our analysis, can be easily fixed at a CAGR of 35%. Interestingly, as per the leaked report of the most
3.3% in average monthly expenditure of Indians between the year 2011-12 to 2017-18. Spending on health and education however has increased from 7.4% within this time period [8]. Given such relentless increase in educational expenditure, the estimate for 2014-19 projected to be of 35% increase since the 2008-14 NSO held exclusively on educational expenditure is by no means an exaggeration. If anything, the actual data for 2018-19 would only be on the higher side.
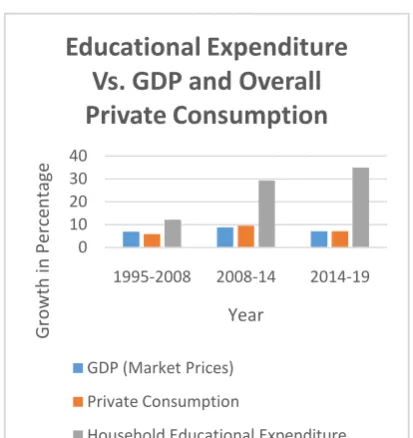
[image:3.595.305.548.180.412.2]With the available statistical tool, we can now embark on a clear mapping of the trends in GDP, private consumption and educational expenditure of households for all three phases of the study.
Table 2: A comparison table from Phase 1 to 3 revealing the rising cost of education and the decline of GDP
growth.
Description/Year 1995-2008 (Phase 1)
2008-14 (Phase 2)
2014 -19 (Phase 3)
GDP (Factor Cost)/GVA (Basic prices)
6.96 8.77 7.04
Private consumption
5.9 9.5 7.28
Household Educational Expenditure
12.1 29.3 35
(Estimate)
(Source: RBI, CSO, NSSO)
[image:3.595.56.263.544.763.2]A conclusive finding of the lack of performance of educational institutions and the jobless growth of the present economy comes out in a telling manner from the above table.
The comparison table for all three phases can also be shown in a bar diagram.
Chart 1:
IV. DISCUSSION & ADDITIONAL SUPPORTIVE DATA
The sharp decrease in Gross fixed capital formation observed in Phase III of our study is yet another indicator of the structural malaise of the economy. However, this again is partly due to the rising cost of education and the lack of innovation and entrepreneurship that could have otherwise contributed to a diversification of economy.
Table 3: A comparative analysis of growth in GDP, consumption and fixed capital formation (percent per year)
Description/Year 1997-03 2003-08 2008-12 2012-18
GDP (Factor Cost)/GVA (Basic prices)
5.4 8.7 7.7 6.9
GDP (Market prices)
5.3 8.8 7.3 7.1
Private consumption
4.6 7.5 8.1 7.1
Government consumption
6.5 5.8 9.2 6.2
Gross fixed capital formation
6.7 16.2 8.6 5.6
Source: (Mohan, 2019)
In Table 3, the current recession comes out as a clear trend. The achievement of 8.7% growth witnessed in 2003-08 has dipped to 7.7% in 2008-12 and to 6.9% in 2012-18.
The 16.2% growth in gross fixed capital formation during 2003-08 is by all standards an outstanding performance. This ought to have led to a high growth in GDP in the next phase of 2008-12.
It is understandable that the consumption growth was at 7.5% in 2003 -08 when GDP growth was at 8.7%. But in the next four years, when GDP growth had flattened to 7.7%, consumption continued to grow at 8.1%. The rise in educational expenditure is one possible explanation of this persistent growth in consumption.
The investments made by the individuals and the government, be it on education or other infrastructure failed to create the momentum with which the GDP could continue to sustain an above 8% mark. Instead, as the income levels started dragging down and lack of jobs began to haunt, people have been compelled to reduce both their consumption and their savings.
The unmistakable trend becomes abundantly clear in the following table.
0 10 20 30 40
1995-2008 2008-14 2014-19
G
ro
w
th
in
Perc
en
ta
ge
Year
Educational Expenditure
Vs. GDP and Overall
Private Consumption
GDP (Market Prices)
Private Consumption
Table 4: Savings and Investment Rates: (Percent to GDP)
Description/Y ear
1997-03
2003-08
2008-11
2011-18
Household -Financial
10 11.2 10.7 7.2
Private Corporate sector
3.9 7.2 7.9 11
Public Authorities
-3.6 -1.1 -1.7 -1.0
Public sector enterprises
3.3 4.0 3.0 2.3
Gross Domestic savings
24.5 33.3 33.1 32.1
Source: [6]
The Household financial savings have fallen from 11.2% of GDP in 2003-08 to 10.7% in 2008-11 and to a shocking low of 7.2% in 2011-18. The public sector savings have also come down. It’s only the private corporate sector that has managed to increase its savings from 3.9% of GDP in 1997-03 to 11% in 2011-18. Essentially, funds and potentials appear to be locked up with Corporates and the households at large have been made the poorer.
A 7% of GDP that has now transferred from household savings to corporate savings over a period of two decades gives a huge story in itself.
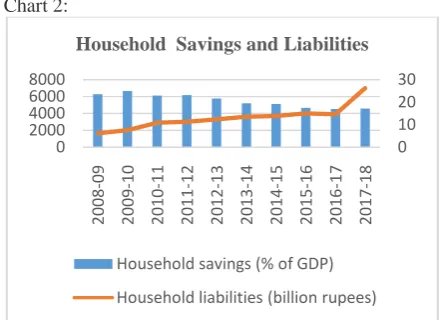
Interestingly, while the household savings have come down, the credit extended to them has sharply increased from 2008 onwards, even as the NPAs from the industrial sector has compelled the Banks to turn towards the retail customers.
Chart 2:
Source: RBI, Economic Survey 2019, CRISIL
From the chart, it’s easy to see that the household savings is coming down and the retail liabilities have shot up in the last two years.
[image:4.595.55.277.494.654.2]Education undoubtedly has become a costly proposition. The increasing share of private educational institutions has also come out clearly from the NSO surveys. To obtain quality education parents have increasingly moved towards the private institutions; but this also automatically implies an exorbitant rise in the cost of education.
Table 5: A comparison table of educational expenses in the last three NSS surveys on the subject
Household expenses
1995-96 (52nd
round of NSSO)
July 2007- June 2008 (64th round)
2014( 71ST
round Jan – June) General
education
Overall Rs. 997 Above HS Rs. 2923
Overall Rs. 2461 Above HS Rs. 7360
General Education Rs. 6788 Above HS Rs. 14738
Technical Education
Rs. 32112 Rs. 62841
Vocational Education
Rs. 14881 Rs. 27676
As per the Value of Education survey, undergraduate and post-graduate studies cost Rs. 7.77 lakh. The break-up for this expenditure is given as follows:
Rs. 2.93 lakh for course fees
Rs. 1.46 lakh for accommodation
Rs. 22,346 for academic material like books
Rs. 47,400 for other bills and utilities
Rs. 50,400 for clothes and make-up [9]
Industries and Educational institutions are hardly in sync. Unemployment remains a huge issue mainly for three reasons. 1) Universities do not produce employable candidates 2) Graduates lack the sources and the entrepreneurship to come up with new industries 3) Research and innovation at the level of industries have not produced new technology and jobs that can engage the millions of graduates passing out of educational institutions. The mismatch of the rising educational expenditure and the final outcome therefore acts as a serious structural ill that causes the slow-down in the long run.
V. CONCLUSION AND FUTURE SCOPE
The methodology adopted in this study namely arriving at CAGR from NSS data and comparing it with the annual series on GDP and overall consumption is unconventional. However the indications with respect to educational expenditure are extremely strong and hence the hypothesis stands on a valid footing. The mismatch between the rising cost of education and the poor outcome is one major cause of the current slow-down in the economy.
In addition, there are also other structural issues contributing to the slow-down and given the scope of this article they could not be discussed here.
To arrive at a rigorous calculation between educational expenditure and the performance of the Indian economy, we require year-on-year data on both fronts. It is highly recommended therefore that policy makers arrange for rigorous consumption data under separate heads such as education, rather than clubbing it with health and services in general.
0 10 20 30
0 2000 4000 6000 8000
2008
-09
2009
-10
2010
-11
2011
-12
2012
-13
2013
-14
2014
-15
2015
-16
2016
-17
2017
-18
Household Savings and Liabilities
Household savings (% of GDP)
REFERENCE
1. International Monetary Fund. GDP per capita of India (2019, September) Retrieved from https://www.imf.org/external/pubs/ft/weo/2019/01/weodata/weorept.a spx?pr.x=57&pr.y=10&sy=2019&ey=2024&ssd=1&sort=country&ds =.&br=1&c=534&s=NGDPDPC%2CPPPPC&grp=0&a=
2. Sunday Times of India. Rajan says majoritarianism taking India down ‘dark, uncertain path’ (2019, October)
3. Business Today. Unemployment rate hits three-year high of 8.4% in August: CMIE. (2019, August 11). Retrieved from: https://www.businesstoday.in/sectors/jobs/unemployment-rate-hits-three-year-high-of-84-in-august-cmie/story/377306.html.
4. Sharma.K. Indian economy surprises with return to 8% growth (2018, August 31) Retrieved from: https://asia.nikkei.com/Economy/Indian-economy-surprises-with-return-to-8-growth.
5. Ghosh M. 1.2 lakh IT employees can lose their job as per this industry veteran (But Why?) (2019 November 10) Retrieved from: www.trak-in.cdn.ampproject.org.
6. Mohan R. Moving India to a new growth trajectory: Need for a comprehensive push (2019) New Delhi. Brookings India Research Paper No.072019
7. RBI Handbook of Statistics on Indian Economy (2019) Retrieved from: www.rbi.org.in
8. Waghmare A. Households are spending more on discretionary items: Economics Survey (2019 July 5). Retrieved from:
https://www.business-standard.com/article/economy- policy/households-are-spending-more-on-discretionary-items-economic-survey-119070500024_1.html.
9. Economic Times. How parents save for child’s university education expenses (2018 August 06) Retrieved from: https://economictimes.indiatimes.com/wealth/plan/how-parents-save-
for-childs-university-education-expenses/articleshow/65267884.cms?from=mdr.
10. Business Line. India is nowhere near 8% growth rate: Anantha Nageswaran (2019 October 4) Retrieved from: https://www.thehindubusinessline.com/economy/india-is-nowhere-near-8-gdp-growth-rate-anantha-nageswaran/article29595319.ece. 11. Thomas M. The cost of getting a decent education in India is
skyrocketing (2015 July 7) Retrieved from: https://qz.com/india/445500/the-cost-of-getting-a-decent-education-in-india-is-now-staggering/.
12. National Statistical Organisation. NSS 64st round. Education in India:
2007-08 (2010) New Delhi
13. National Statistical Organisation.. Education in India: NSS 71st round (2014) New Delhi
14. 14 National Statistical Organisation.. Education in India: NSS 52nd
round (1995-96) New Delhi
AUTHORS PROFILE
Dr. Rajarethinam Emmanuel has undertaken
rigorous research over a period of 32 years on the Science of Consciousness and the natural connections between physics, biology, mind, society and religion. His Inter-disciplinary Doctoral Thesis in Philosophy and Economics was entitled: An Integral View of Nature, Mind, Economy and Society to Foster Individual Evolution. Besides publishing a number of research articles in Scopus indexed journals, he has also authored five books: 1. Evolution Beyond Man, 2. Science of Consciousness, 3. Roots of Evolution 4. Untrained Multitude and 5. Parinaamap Paarvayil Manam - A collection of Poems in Tamil on the topic Mind. He is currently employed as Asst. Prof. at the Department of Economics, Vels Institute of Science, Technology and Advanced Studies, Chennai – 117.
Dr. S.N. Sugumar is Professor and Head of
Department, Economics, at Vels Institute of Science, Technology and Advanced Studies, Chennai. Previously he was the Head of the Department at RKM Vivekanda College, Mylapore. He has 33 years of teaching experience and has presented a number of research papers on HRD and Development issues in Regional,
National and International conferences. He is the recipient of prestigious awards, such as Bharat Seva Ratan Gold Medal, AASIRIYAR CHEMMAL and Best Teacher Award.
Dr. Chandrachud Sivaramakrishanan,
Economist, currently serves as Professor in the Department of Economics, VISTAS, VELS Institute of Science, Technology and Advanced Studies, Chennai, India. His research area is in Mathematical Economics, Business Economics, Health Economics and International Economics. He has published 57 research papers and also published 2 books. He started an economics lab called WISE Lab - world Institute for Scientific Economics Lab. Scopus Author ID – 57195615646 Orcid Author ID- 0000-0002-5635-5172 Researcher ID - G1767-2017. He was the best outgoing student from Madras Christian college during 1995-97 batch and he has been awarded on teachers day, 2017 for his Ph.D., work and received the longest service award from VISTAS with cash award in 2018.
Dr. Jansirani is serving as Professor in
Department of Economics, VISTAS, Chennai. She has 18 years of teaching experience and has guided 5 Ph. D scholars and 6 M.Phil candidates. She was the senate member of the University of Madras. She has organized several symposiums and seminars for M.B.A students. She has presented 10 research papers at National and International Conferences; published 20 Research Papers and has participated in many International Conferences and seminars. She can be reached at [email protected]
.
Dr. S. Sudha is serving as Asst. Professor of