See discussions, stats, and author profiles for this publication at: https://www.researchgate.net/publication/301964994
OSoMe: The IUNI observatory on social media
Article in PeerJ · May 2016
DOI: 10.7287/peerj.preprints.2008v1
CITATION
1
READS
74
29 authors, including:
Some of the authors of this publication are also working on these related projects:
Evolving Ideal Ratio Masks for Audio Signal Separation
View project
SPIDAL: CIF21 DIBBs: Middleware and High Performance Analytics Libraries for Scalable Data Science
View project
Luca Maria Aiello Yahoo
52PUBLICATIONS 427CITATIONS
SEE PROFILE
Emilio Ferrara
University of Southern California 102PUBLICATIONS 965CITATIONS
SEE PROFILE
Bruno Gonçalves New York University
80PUBLICATIONS 2,506CITATIONS
SEE PROFILE
David Scott McCaulay
Indiana University Bloomington 32PUBLICATIONS 76CITATIONS
OSoMe: The IUNI Observatory on Social Media
Clayton A. Davis*1,2, Giovanni Luca Ciampaglia1,3, Luca Maria Aiello†4,
Keychul Chung2, Michael Conover†5, Emilio Ferrara†6, Alessandro Flammini1,2,3, Geoffrey Fox2, Xiaoming Gao†7, Bruno Gonçalves†8, Przemyslaw
Grabowicz†9, Alex Hong2, Pik-Mai Hui2, Scott McCaulay3, Karissa McKelvey†10, Mark Meiss†11, Snehal Patil†4, Chathuri Peli Kankanamalage3, Valentin Pentchev3, Judy Qiu2, Jacob Ratkiewicz†11, Alex Rudnick†11, Benjamin
Serrette3, Prashant Shiralkar1,2, Onur Varol1,2, Lilian Weng†12, Tak-Lon Wu†13, Andrew Younge2, and Filippo Menczer1,2,3
1Center for Complex Networks and Systems Research, Indiana University, USA 2School of Informatics and Computing, Indiana University, USA
3Network Science Institute, Indiana University, USA 4Yahoo! Inc, USA
5LinkedIn Inc, USA
6Information Sciences Institute, University of Southern California, USA 7Facebook Inc, USA
8Center for Data Science, New York University, USA 9Max Planck Institute for Software Systems, Germany
10US Open Data, USA 11Google Inc, USA 12Affirm Inc, USA 13Amazon Inc, USA
Abstract
1
The study of social phenomena is becoming increasingly reliant on big data from
on-2
line social networks. Broad access to social media data, however, requires software
3
development skills that not all researchers possess. Here we present the IUNI
Observa-4
tory on Social Media, an open analytics platform designed to facilitate computational
5
social science. The system leverages a historical, ongoing collection of over 70 billion
6
public messages from Twitter. We illustrate a number of interactive open-source tools
7
to retrieve, visualize, and analyze derived data from this collection. The Observatory,
8
now available atosome.iuni.iu.edu, is the result of a large, six-year collaborative effort
9
coordinated by the Indiana University Network Science Institute.
Introduction
11
The collective processes of production, consumption, and diffusion of information on
12
social media are starting to reveal a significant portion of human social life, yet
scien-13
tists struggle to get access to data about it. Recent research has shown that social media
14
can perform as ‘sensors’ for collective activity at multiple scales (Lazer et al., 2009). As
15
a consequence, data extracted from social media platforms are increasingly used
side-16
by-side with — and sometimes even replacing — traditional methods to investigate
17
hard-pressing questions in the social, behavioral, and economic (SBE) sciences (King,
18
2011; Moran et al., 2014; Einav and Levin, 2014). For example, interpersonal connections
19
from Facebook have been used to replicate the famous experiment by Travers and
Mil-20
gram (1969) on a global scale (Backstrom et al., 2012); the emotional content of social
21
media streams has been used to estimate macroeconomic quantities in country-wide
22
economies (Bollen et al., 2011; Choi and Varian, 2012; Antenucci et al., 2014); and
im-23
agery from Instagram has been mined (De Choudhury et al., 2013; Andalibi et al., 2015)
24
to understand the spread of depression among teenagers (Link et al., 1999).
25
A significant amount of work about information production, consumption, and
dif-26
fusion has been thus aimed at modeling these processes and empirically discriminating
27
among models of mechanisms driving the spread of memes on social media networks
28
such as Twitter (Guille et al., 2013). A set of research questions relate to how social
29
network structure, user interests, competition for finite attention, and other factors
af-30
fect the manner in which information is disseminated and why some ideas cause viral
31
explosions while others are quickly forgotten. Such questions have been address both
32
in an empirical and in more theoretical terms.
33
Examples of empirical works concerned with these questions include geographic
34
and temporal patterns in social movements (Conover et al., 2013b,a; Varol et al., 2014),
35
the polarization of online political discourse (Conover et al., 2011b,a, 2012), the use of
36
social media data to predict election outcomes (DiGrazia et al., 2013) and stock market
37
movements (Bollen et al., 2011), the geographic diffusion of trending topics (Ferrara
38
et al., 2013), and the lifecycle of information in the attention economy (Ciampaglia et al.,
39
2015).
40
On the more theoretical side, agent-based models have been proposed to explain
41
how limited individual attention affects what information we propagate (Weng et al.,
42
2012), what social connections we make (Weng et al., 2013b), and how the structure
43
of social and topical networks can help predict which memes are likely to become
vi-44
ral (Weng et al., 2013a, 2014; Nematzadeh et al., 2014; Weng and Menczer, 2015).
45
Broad access by the research community to social media platforms is, however,
lim-46
ited by a host of factors. One obvious limitation is due to the commercial nature of these
47
services. On these platforms, data are collected as part of normal operations, but this is
48
seldom done keeping in mind the needs of researchers. In some cases researchers have
49
been allowed to harvest data through programmatic interfaces, or APIs. However, the
50
information that a single researcher can gather through an API typically offers only a
51
limited view of the phenomena under study; access to historical data is often restricted
52
or unavailable (Zimmer, 2015). Moreover, these samples are often collected using ad-hoc
53
procedures, and the statistical biases introduced by these practices are only starting to
54
be understood (Morstatter et al., 2013; Ruths and Pfeffer, 2014; Hargittai, 2015).
55
A second limitation is related to the ease of use of APIs, which are usually meant
56
for software developers, not researchers. While researchers in the SBE sciences are
increasingly acquiring software development skills (Terna et al., 1998; Raento et al., 2009;
58
Healy and Moody, 2014), and intuitive user interfaces are becoming more ubiquitous,
59
many tasks remain challenging enough to hinder research advances. This is especially
60
true for those tasks related to the application of fast visualization techniques.
61
A third, important limitation is related to user privacy. Unfettered access to sensitive,
62
private data about the choices, behaviors, and preferences of individuals is happening at
63
an increasing rate (Tene and Polonetsky, 2012). Coupled with the possibility to
manip-64
ulate the environment presented to users (Kramer et al., 2014), this has raised in more
65
than one occasion deep ethical concerns in both the public and the scientific
commu-66
nity (Kahn et al., 2014; Fiske and Hauser, 2014; Harriman and Patel, 2014; Vayena et al.,
67
2015).
68
These limitations point to a critical need for opening social media platforms to
re-69
searchers in ways that are both respectful of user privacy requirements and aware of
70
the needs of SBE researchers. In the absence of such systems, SBE researchers will have
71
to increasingly rely on closed or opaque data sources, making it more difficult to
re-72
produce and replicate findings — a practice of increasing concern given recent findings
73
about replicability in the SBE sciences (Open Science Collaboration, 2015).
74
Our long-term goal is to enable SBE researchers and the general public to openly
75
access relevant social media data. As a concrete milestone of our project, here we present
76
anObservatory on Social Media — an open infrastructure for sharing public data about
77
information that is spread and collected through online social networks. Our initial
78
focus has been on Twitter as a source of public microblogging posts. The infrastructure
79
takes care of storing, indexing, and analyzing public collections and historical archives
80
of big social data; it does so in an easy-to-use way, enabling broad access from scientists
81
and other stakeholders, like journalists and the general public. We envision that data
82
and analytics from social media will be integrated within a nation-wide network of
83
social observatories. These data centers would allow access to a broad range of data
84
about social, behavioral, and economic phenomena nationwide (King, 2011; Moran et al.,
85
2014; Difranzo et al., 2014).
86
Our team has been working toward this vision since 2010, when we started
collect-87
ing public tweets to visualize, analyze, and model meme diffusion networks.1 The IUNI
88
Observatory on Social Media (OSoMe) presented here is developed through a
collabora-89
tion between the Indiana University Network Science Institute (IUNI,iuni.iu.edu), the
90
IU School of Informatics and Computing (SoIC,soic.indiana.edu), and the Center for
91
Complex Networks and Systems Research (CNetS,cnets.indiana.edu). It is available
92
atosome.iuni.iu.edu.
93
Data Source
94
Social media data possess unique characteristics. Besides rich textual content, explicit
95
information about the originating social context is generally available. Information often
96
includes timestamps, geolocations, and interpersonal ties. The Twitter dataset is a
pro-97
totypical example (McKelvey and Menczer, 2013b,a). The Observatory on Social Media
98
1The websitetruthy.indiana.eduwas created to host our first demo, motivated by the application of
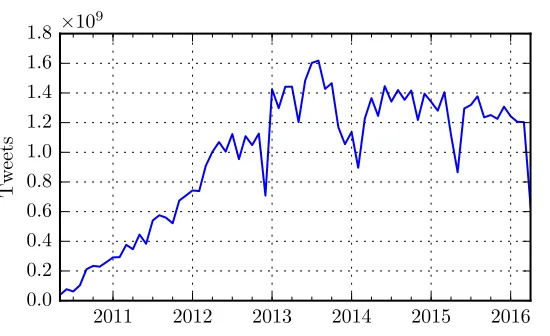
2011 2012 2013 2014 2015 2016 0.0
0.2 0.4 0.6 0.8 1.0 1.2 1.4 1.6 1.8
Tw
eets
[image:6.612.177.452.76.244.2]×109
Figure 1: Number of monthly messages collected and indexed by OSoMe. System failures have caused occasional interruptions of the collection system.
is built around a Terabyte-scale historical (and ongoing) collection of approximately70
99
billion public tweetsto date. The data has been collected from a random 10% stream
100
sample of public Twitter posts and dates back to mid 2010.2 The high-speed stream from
101
which the data originates has a rate that ranges in the order of 106−108 tweets/day.
102
Figure 1 illustrates the growth of the Twitter collection over time.
103
System Architecture
104
Performing analytics at this scale presents specific challenges. The most obvious has to
105
do with the design of a suitable architecture for processing such a large volume of data.
106
This requires a scalable storage substrate and efficient query mechanisms.
107
The architecture the Observatory builds upon the Apache Big Data Stack (ABDS)
108
framework (Jha et al., 2014; Qiu et al., 2014; Fox et al., 2014). Development has been
109
driven over the years by the need for increasingly demanding social media analytics
110
applications (Gao et al., 2011; Gao and Qiu, 2013, 2014; Gao et al., 2014, 2015; Wu et al.,
111
2016). A key idea behind our enhancement of the ABDS architecture is the shift from
112
standalone systems to modules; multiple modules can be used within existing software
113
ecosystems. In particular, we have focused our efforts on enhancing two well-known
114
Apache modules, Hadoop (The Apache Software Foundation, 2016b) and HBase (The
115
Apache Software Foundation, 2016a).
116
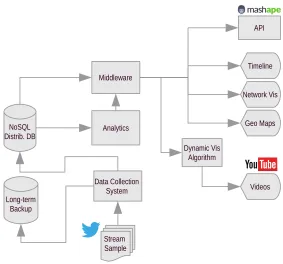
The architecture is illustrated in Figure 2. The data collection system receives data
117
from the Twitter Streaming API. Data are first stored on a temporary location and then
118
loaded into a distributed storage layer on a daily basis. At the same time, long-term
119
backupsare stored on tape to allow recovery in case of data loss or catastrophic events.
120
The design of theNoSQL distributed DBmodule was guided by the observation that
121
queries of social media data often involve unique constraints on the textual and social
122
context such as temporal or network information. To address this issue, we leveraged
123
2Research based on this data was deemed exempt from review by the Indiana University IRB under
Stream Sample Data Collection
System Long-term
Backup NoSQL
Distrib. DB Analytics Middleware
Geo Maps Timeline
Network Vis
Videos Dynamic Vis
Algorithm
[image:7.612.167.450.69.333.2]API
Figure 2: Flowchart diagram of the OSoMe architecture. Arrows indicate flow of data.
the HBase system as the storage substrate and extended it with a flexible indexing
124
framework. The resulting IndexedHBase module (Wiggins et al., 2016) allows one to
125
define fully customizable text index structures that are not supported by current
state-126
of-the-art text indexing systems, such as Solr (The Apache Software Foundation, 2016c).
127
The custom index structures can embed contextual information necessary for efficient
128
query evaluation.
129
The pipelines commonly used for social media data analysis consist of multiple
algo-130
rithms with varying computation and communication patterns. For example, building
131
the network of retweets of a given hashtag will take more time and computational
re-132
sources than just counting the number of posts containing the hashtag. Moreover, the
133
temporal resolution and aggregation windows of the data could vary dramatically, from
134
seconds to years. A number of different processing frameworks could be needed to
per-135
form such a wide range of tasks. To design the analytics module of the Observatory
136
we choose Hadoop, a standard framework for Big Data analytics. We use YARN (The
137
Apache Software Foundation, 2016d) to achieve efficient execution of the whole pipeline,
138
and integrate it with IndexedHBase. An advantage deriving from this choice is that the
139
overall software stack can dynamically adopt different processing frameworks to
com-140
plete heterogeneous tasks of variable size.
141
A distributed message-passing task queue, and an in-memory key/value store
im-142
plement themiddlewarelayer needed to connect the backend of the Observatory with the
143
frontend apps. We use Celery (Solem and Contributors, 2016) and RabbitMQ (Pivotal
144
Software, Inc, 2016) to implement such layer.
145
The Observatory user interface follows a modular architecture too, and is based on
146
a number of apps, which we describe in greater detail in the following section. Three
147
of the apps (Timeline, Network visualization, and Geographic maps) are directly accessible
within OSoMe through Web interfaces. We rely on the popular video-sharing service
149
YouTube for the fourth app, which generates meme diffusion movies (Videos) using a fast
150
dynamic visualization algorithm(Grabowicz et al., 2014) specifically designed for temporal
151
networks. Finally, the Observatory provides access to raw data via a programmatic
152
interface (API).
153
Applications
154
Storing and indexing tens of billions of tweets is of course pointless without a way to
155
make sense of such a huge trove of information. The Observatory lowers the barrier
156
of entry to social media analysis by providing users with several ready-to-use,
Web-157
based data visualization tools. Visualization techniques allow users to make sense of
158
complex data and patterns (Card, 2009), and let them explore the data and try different
159
visualization parameters (Rafaeli, 1988). In the following, we give a brief overview of
160
the available tools.
161
It is important to note that, in compliance with the Twitter terms of service
(Twit-162
ter, Inc., 2016), OSoMe does not provide access to the content of tweets. However,
163
researchers can obtain numeric object identifiers in response to their queries. This
infor-164
mation can then be used to retrieve tweet content via the official Twitter API.
165
Temporal Trends 166
The Trends tool produces time series plots of the number of tweets including one or
167
more given hashtags; it can be compared to the service provided by Google Trends,
168
which allows users to examine the interest toward a topic reflected by the volume of
169
search queries submitted to Google over time.
170
Users may specify multiple terms in one query, in which case all tweets containing
171
any of the terms will be computed; and they can perform multiple queries, to allow
172
comparisons between different topics. For example, let us compare the relative tweet
173
volumes about the World Series and the Superbowl. We want our Super Bowl timeline
174
to count tweets containing any of #SuperBowl, #SuperBowl50, or #SB50. Since hashtags
175
are case-insensitive and we allow trailing wildcards, this query would be “#superbowl*,
176
#sb50.” Adding a timeline for the “#worldseries” query results in the plot seen in
177
Figure 3. Each query on the Trends tool takes on the order of five seconds; this makes
178
the tool especially suitable for interactive exploration of Twitter conversation topics.
179
Diffusion and Co-occurrence Networks 180
In a diffusion network, nodes represent users and an edge drawn between any two
181
nodes indicates an exchange of information between those two users. For example, a
182
user could rebroadcast (retweet) the status of another user to her followers, or she could
183
address another user in one of her statuses by including a mention to their user
han-184
dle (mention). Edges have a weight to represent the number of messages connecting
185
two nodes. They may also have an intrinsic direction to represent the flow of
infor-186
mation. For example, in the retweet network for the hashtag #IceBucketChallenge, an
187
edge from userito user jindicates that jretweeted tweets by icontaining the hashtag
188
#IceBucketChallenge. Similarly, in a mention network, an edge fromito jindicates that
Figure 3: Number of tweets per day about the Super Bowl (in blue) and the World Series (in orange), from September 2015 through February 2016. The Y-axis is in logarithmic scale, shifted by one to account for null counts. The plot shows two outages in the data collection that occurred around mid-November 2015 and mid-January 2016.
i mentioned j in tweets containing the hashtag. Information diffusion network,
some-190
times also called information cascades, have been the subject of intense study in recent
191
years (Gruhl et al., 2004; Weng et al., 2012; Bakshy et al., 2012; Weng et al., 2013b,a;
192
Romero et al., 2011).
193
Another type of network visualizes how hashtags co-occur with each other.
Co-194
occurrence networks are also weighted, but undirected: nodes represent hashtags, and
195
the weight of an edge between two nodes is the number of tweets containing both of
196
those hashtags.
197
OSoMe provides two tools that allow users to explore diffusion and and co-occurrence
198
networks.
199
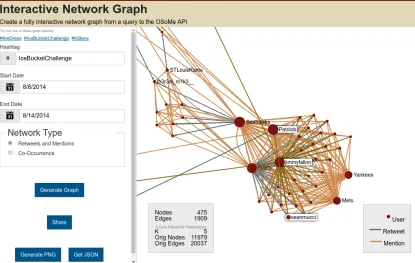
Interactive Network Visualization
200
TheNetworkstool enables the visualization of how a given hashtag spreads through the
201
social network via retweets and mentions (Figure 4) or what hashtags co-occur with
202
a given hashtag. The resulting network diagrams, created using a force-directed
lay-203
out (Kamada and Kawai, 1989), can reveal topological patterns such as influential or
204
highly-connected users and tightly-knit communities. Users can click on the nodes
205
and edges to find out more information about the entities displayed — users, tweets,
206
retweets, and mentions — directly from Twitter. Network are cached to enable fast
207
access to previously-created visualizations.
Figure 4: Interactive Network Visualization Tool. A detail of the network of retweets and mention for a hashtag commonly linked to “Ice Bucket Challenge,” a popular Internet phenomenon from 2014. The size of a node is proportional to its strength (weighted degree). For visualization purposes, the size of large networks is reduced by extracting theirk-core (Alvarez-Hamelin et al., 2005) withksufficiently large to display 1,000 nodes
or less (k=5 in this example). The detail shows the patterns of mention and information
broadcasting occurring between celebrities, as the viral challenge was taking off.
Animations
209
Because tweet data are time resolved, the evolution of a diffusion or co-occurrence
net-210
work can be also visualized over time. Currently theNetworkstool visualizes only static
211
networks aggregated over the entire search period specified by the user; we aim to add
212
the ability to observe the network evolution over time, but in the meantime we also
pro-213
vide theMoviestools, an alternative service that lets users generate animations of such
214
processes (Figure 5). We have successfully experimented with fast visualization
tech-215
niques in the past, and have found that edge filtering is the best approach for efficiently
216
visualizing networks that undergo a rapid churn of both edges and nodes. We have
217
therefore deployed a fast filtering algorithm developed by our team (Grabowicz et al.,
218
2014). The user-generated videos are uploaded to YouTube, and we cache the videos in
219
case multiple users try to visualize the same network.
220
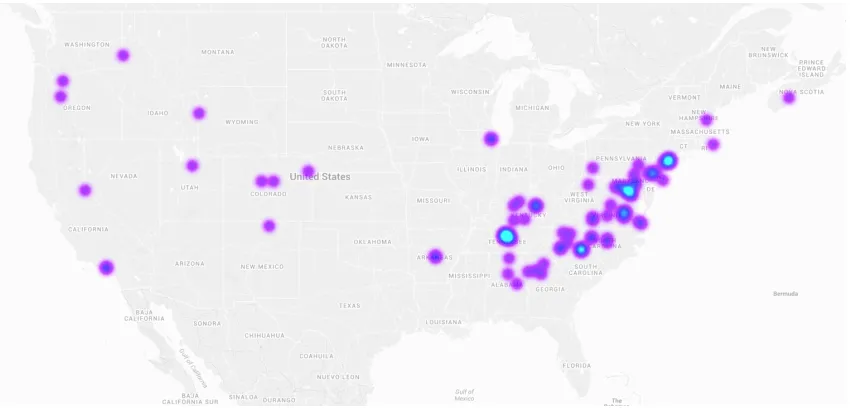
Geographic maps 221
Online social networks are implictly embedded in space, and the spatial patterns of
222
information spread have started to be investigated in recent years (Ferrara et al., 2013;
223
Conover et al., 2013a). TheMaps tool enables the exploration of information diffusion
a
b
Figure 5: Temporal information diffusion movies. (a) The interface of theMoviestool let
users specify a hashtag, a temporal interval, and the type of diffusion ties to visualize
(retweets, mentions, or hashtag co-occurrence). (b) Example of a generated movie frame,
showing a retweet network for the #IceBucketChallenge hashtag.
[image:11.612.99.531.447.651.2]through geographic space and time. A subset of tweets (ranging between≈ 3% in the
225
historical data and≈0.3% in recent years) contain exact latitude/longitude coordinates
226
in their metadata. By aggregating these coordinates into a heatmap layer superimposed
227
on a world map, one can observe the geographic signature of the attention being paid
228
to a given meme. Figure 6 shows an example. Our online tool goes one step further,
229
allowing the user to explore how this geographic signature evolves over a specified time
230
period, via a slider widget.
231
It takes between 30 and 90 seconds to prepare one of these visualizations ex novo.
232
We hope to reduce this lead time with some backend indexing improvements. To enable
233
exploration, we cache all created heatmaps for a period of one week. While cached,
234
the heatmaps can be retrieved instantly, enabling other users to browse and interact
235
with these previously-created visualizations. In the future we hope to experiment with
236
overlaying diffusion networks on top of geographical maps, for example using
multi-237
scale backbone extraction (Serrano et al., 2009) and edge bundling techniques (Selassie
238
et al., 2011).
239
API 240
We expect that the majority of users of the Observatory will interact with its data
pri-241
marily through the tools described above. However, since more advanced data needs
242
are to be expected, we also provide a way to export the data for those who wish to create
243
their own visualizations and develop custom analyses. This is possible either within the
244
tools, via export buttons, and through a read-only HTTP API.
245
The OSoMe API is deployed via the Mashape management service. Four public
246
methods are currently available. Each takes as input a time interval and a list of tokens
247
(hashtags and/or usernames):
248
• tweet-id: returns a list of tweet IDs mentioning at least one of the inputs in the
249
given interval;
250
• counts: returns a count of the number of tweets mentioning each input token in
251
the given interval;
252
• time-series: for each day in the given time interval, returns a count of tweets
253
matching any of the input tokens;
254
• user-post-count: returns a list of user IDs mentioning any of the tokens in the
255
given time frame, along with a count of matching tweets produced by each user.
256
Conclusion
257
The IUNI Observatory on Social Media is the culmination of a large collaborative effort
258
at Indiana University that took place over the course of six years. We hope that it will
259
facilitate computational social science and make big social data easier to analyze by a
260
broad community of researchers, reporters, and the general public. The lessons learned
261
during the development of the infrastructure may be helpful for future endeavors to
262
foster data-intensive research in the social, behavioral, and economic sciences.
263
We encourage the research community to create new social media analytic tools by
264
building upon our system. For example, one could mashup the OSoMe API with the
BotOrNot API (Davis et al., 2016), also developed by our team, to evaluate the extent to
266
which Twitter campaigns are sustained by social bots.
267
The opportunities that arise from the Observatory, and from computational social
268
science in general, could have broad societal impact. Systematic attempts to mislead
269
the public on a large scale through “astroturf” campaigns and social bots have been
un-270
covered using big social data analytics, inspiring the development of machine learning
271
methods to detect these abuses (Ratkiewicz et al., 2011a; Ferrara et al., in press;
Subrah-272
manian et al., 2016). Allowing citizens to observe how memes spread online may help
273
raise public awareness of the potential dangers of social media manipulation.
274
Acknowledgements 275
The authors would like to acknowledge Alessandro Vespignani and Johan Bollen for
276
discussions leading to the early vision of an Observatory on Social Media; and Gary
277
Miksik, Allan Streib, and Koji Tanaka for their kind assistance with system
administra-278
tion. This work was supported in part by NSF (grants CCF-1101743 and OCI-1149432),
279
the J.S. McDonnell Foundation (grant 220020274), the Swiss National Science
Founda-280
tion (fellowship PBTIP2_142353), the Lilly Endowment, the Center for Complex
Net-281
works and Systems Research (CNetS), the Digital Science Center (DSC), and the Indiana
282
University Network Science Institute (IUNI). Any opinions, findings, and conclusions or
283
recommendations expressed in this material are those of the author(s) and do not
neces-284
sarily reflect the views of the funding agencies. Finally, we are deeply grateful to Twitter
285
for supporting computational social science research, including the efforts described in
286
this paper, by granting our lab elevated access to the public stream of tweets.
287
References
288
J. I. Alvarez-Hamelin, L. Dall’Asta, A. Barrat, and A. Vespignani. Large scale networks
289
fingerprinting and visualization using the k-core decomposition. InAdvances in Neural
290
Information Processing Systems 18 (NIPS), pages 41–50, 2005.
291
N. Andalibi, P. Ozturk, and A. Forte. Depression-related imagery on instagram. InProc.
292
18th ACM Conf. Companion on Computer Supported Cooperative Work & Social Computing 293
(CSCW), pages 231–234, 2015. doi: 10.1145/2685553.2699014.
294
D. Antenucci, M. Cafarella, M. Levenstein, C. Ré, and M. D. Shapiro. Using social media
295
to measure labor market flows. Working Paper 20010, National Bureau of Economic
296
Research, March 2014.
297
L. Backstrom, P. Boldi, M. Rosa, J. Ugander, and S. Vigna. Four degrees of separation.
298
InProceedings of the 4th Annual ACM Web Science Conference, WebSci ’12, pages 33–42,
299
2012. doi: 10.1145/2380718.2380723.
300
E. Bakshy, I. Rosenn, C. Marlow, and L. Adamic. The role of social networks in
infor-301
mation diffusion. InProceedings of the 21st ACM International Conference on World Wide
302
Web, pages 519–528, 2012.
303
J. Bollen, H. Mao, and X. Zeng. Twitter mood predicts the stock market. Journal of
304
Computational Science, 2(1):1–8, 2011.
S. Card. Information visualization. InHuman-computer interaction: design issues, solutions, 306
and applications, pages 181–216. CRC Press, 2009.
307
H. Choi and H. Varian. Predicting the present with google trends. Economic Record, 88
308
(s1):2–9, 2012.
309
G. L. Ciampaglia, A. Flammini, and F. Menczer. The production of information in the
310
attention economy. Scientific Reports, 5:9452, 2015. doi: 10.1038/srep09452.
311
M. Conover, B. Gonçalves, J. Ratkiewicz, A. Flammini, and F. Menczer. Predicting the
312
political alignment of Twitter users. InProc. 3rd IEEE Conference on Social Computing
313
(SocialCom), 2011a.
314
M. Conover, J. Ratkiewicz, M. Francisco, B. Gonçalves, A. Flammini, and F. Menczer.
315
Political polarization on Twitter. InProc. 5th International AAAI Conference on Weblogs
316
and Social Media (ICWSM), 2011b.
317
M. Conover, C. Davis, E. Ferrara, K. McKelvey, F. Menczer, and A. Flammini. The
318
geospatial characteristics of social movement communication networks. PLoS ONE, 8
319
(3):e55957, 2013a.
320
M. Conover, E. Ferrara, F. Menczer, and A. Flammini. The digital evolution of occupy
321
wall street. PLoS ONE, 8(3):e64679, 2013b.
322
M. D. Conover, B. Gonçalves, A. Flammini, and F. Menczer. Partisan asymmetries in
323
online political activity. EPJ Data Science, 1:6, 2012.
324
C. A. Davis, O. Varol, E. Ferrara, A. Flammini, and F. Menczer. Botornot: A system
325
to evaluate social bots. In Proc. WWW Developers Day Workshop, 2016. doi: 10.1145/
326
2872518.2889302. URLhttp://arxiv.org/abs/1602.00975.
327
M. De Choudhury, M. Gamon, S. Counts, and E. Horvitz. Predicting depression via
328
social media. InProc. 7th Intl. AAAI Conf. on Weblogs and Social Media (ICWSM), 2013.
329
D. Difranzo, J. S. Erickson, M. J. K. T. Gloria, J. S. Luciano, D. L. McGuinness, and
330
J. Hendler. The web observatory extension: Facilitating web science collaboration
331
through semantic markup. In Proc. 23rd Intl. Conf. on World Wide Web Companion,
332
pages 475–480, 2014. doi: 10.1145/2567948.2576936.
333
J. DiGrazia, K. McKelvey, J. Bollen, and F. Rojas. More tweets, more votes: Social media
334
as a quantitative indicator of political behavior. PLoS ONE, 8(11), 2013.
335
L. Einav and J. Levin. Economics in the age of big data. Science, 346(6210):
336
1243089–1243089, Nov 2014. ISSN 1095-9203. doi: 10.1126/science.1243089.
337
E. Ferrara, O. Varol, F. Menczer, and A. Flammini. Traveling Trends: Social Butterflies
338
or Frequent Fliers? In Proc. 1st ACM Conf. on Online Social Networks (COSN), pages
339
213–222, 2013.
340
E. Ferrara, O. Varol, C. Davis, F. Menczer, and A. Flammini. The rise of social bots.
341
Commun. ACM, in press. arXiv preprint arXiv:1407.5225.
S. T. Fiske and R. M. Hauser. Protecting human research participants in the age of big
343
data. Proceedings of the National Academy of Sciences, 111(38):13675–13676, 2014. doi:
344
10.1073/pnas.1414626111.
345
G. C. Fox, S. Jha, J. Qiu, and A. Luckow. Towards an understanding of facets and
346
exemplars of big data applications. InProceedings of 20 Years of Beowulf: Workshop to
347
Honor Thomas Sterling’s 65th Birthday, pages 7–16, 2014.
348
X. Gao and J. Qiu. Supporting end-to-end social media data analysis with the
Indexed-349
HBase platform. InProceedings of the 6th Workshop on Many-Task Computing on Clouds,
350
Grids, and Supercomputers (MTAGS) at SC13, 2013.
351
X. Gao and J. Qiu. Supporting queries and analyses of large-scale social media data with
352
customizable and scalable indexing techniques over nosql databases. In Proceedings
353
of the 14th IEEE/ACM International Symposium on Cluster, Cloud and Grid Computing 354
(CCGrid 2014), pages 587–590, 2014.
355
X. Gao, V. Nachankar, and J. Qiu. Experimenting Lucene Index on HBase in an HPC
En-356
vironment. InProceedings of ACM High Performance Computing meets Databases workshop
357
(HPCDB’11) at SuperComputing 11, pages 25–28, 2011.
358
X. Gao, E. Roth, K. McKelvey, C. Davis, A. Younge, E. Ferrara, F. Menczer, and J. Qiu.
359
Supporting a social media observatory with customizable index structures:
Archi-360
tecture and performance. In Cloud Computing for Data Intensive Applications, pages
361
401–427. Springer, 2014.
362
X. Gao, E. Ferrara, and J. Qiu. Parallel clustering of high-dimensional social media data
363
streams. In Proc. 15th IEEE/ACM International Symposium on Cluster, Cloud and Grid
364
Computing (CCGrid), pages 323–332, 2015.
365
P. A. Grabowicz, L. M. Aiello, and F. Menczer. Fast filtering and animation of
366
large dynamic networks. EPJ Data Science, 3(1):27, 2014. doi: 10.1140/epjds/
367
s13688-014-0027-8.
368
D. Gruhl, R. Guha, D. Liben-Nowell, and A. Tomkins. Information diffusion through
369
blogspace. In Proceedings of the 13th International ACM Conference on World Wide Web,
370
WWW ’04, pages 491–501, 2004. doi: 10.1145/988672.988739.
371
A. Guille, H. Hacid, C. Favre, and D. A. Zighed. Information diffusion in online social
372
networks. SIGMOD Rec., 42(1):17, 2013. doi: 10.1145/2503792.2503797.
373
E. Hargittai. Is Bigger Always Better? Potential Biases of Big Data Derived from Social
374
Network Sites. The Annals of the American Academy of Political and Social Science, 659(1):
375
63—-76, 2015. doi: 10.1177/0002716215570866.
376
S. Harriman and J. Patel. The ethics and editorial challenges of internet-based research.
377
BMC Med, 12(1), 2014. doi: 10.1186/s12916-014-0124-3.
378
K. Healy and J. Moody. Data visualization in sociology. Annual review of sociology, 40:
379
105—128, 2014. doi: 10.1146/annurev-soc-071312-145551.
S. Jha, J. Qiu, A. Luckow, P. Mantha, and G. C. Fox. A tale of two data-intensive
381
paradigms: Applications, abstractions, and architectures. In Proceedings of the 3rd
382
International Congress on Big Data Conference (IEEE BigData), 2014.
383
J. P. Kahn, E. Vayena, and A. C. Mastroianni. Opinion: Learning as we go: Lessons from
384
the publication of facebook’s social-computing research. Proceedings of the National
385
Academy of Sciences, 111(38):13677–13679, 2014. doi: 10.1073/pnas.1416405111.
386
T. Kamada and S. Kawai. An algorithm for drawing general undirected graphs.
Infor-387
mation Processing Letters, 31(1):7 – 15, 1989.
388
G. King. Ensuring the data-rich future of the social sciences. Science, 331(6018):719–721,
389
2011. doi: 10.1126/science.1197872.
390
A. D. Kramer, J. E. Guillory, and J. T. Hancock. Experimental evidence of massive-scale
391
emotional contagion through social networks. Proceedings of the National Academy of
392
Sciences, 111(24):8788–8790, 2014.
393
D. Lazer, A. S. Pentland, L. Adamic, S. Aral, A. L. Barabasi, D. Brewer, N. Christakis,
394
N. Contractor, J. Fowler, M. Gutmann, et al. Life in the network: the coming age of
395
computational social science. Science, 323(5915):721, 2009.
396
B. G. Link, J. C. Phelan, M. Bresnahan, A. Stueve, and B. A. Pescosolido. Public
concep-397
tions of mental illness: labels, causes, dangerousness, and social distance. Am J Public
398
Health, 89(9):1328–1333, 1999. doi: 10.2105/AJPH.89.9.1328.
399
K. McKelvey and F. Menczer. Design and prototyping of a social media observatory. In
400
Proc. 22nd Intl. Conf. on World Wide Web (WWW) Companion, pages 1351–1358, 2013a.
401
K. McKelvey and F. Menczer. Truthy: Enabling the Study of Online Social Networks. In
402
Proc. 16th ACM Conference on Computer Supported Cooperative Work and Social Computing 403
Companion (CSCW), 2013b.
404
E. F. Moran, S. L. Hofferth, C. C. Eckel, D. Hamilton, B. Entwisle, J. L. Aber, H. E.
405
Brady, D. Conley, S. L. Cutter, K. Hubacek, et al. Opinion: Building a 21st-century
406
infrastructure for the social sciences. Proceedings of the National Academy of Sciences,
407
111(45):15855–15856, 2014.
408
F. Morstatter, J. Pfeffer, H. Liu, and K. M. Carley. Is the Sample Good Enough?
Com-409
paring Data from Twitter’s Streaming API with Twitter’s Firehose. In Proc. 7th Intl.
410
AAAI Conf. on Weblogs and Social Media (ICWSM), 2013.
411
A. Nematzadeh, E. Ferrara, A. Flammini, and Y.-Y. Ahn. Optimal network modularity
412
for information diffusion.Phys. Rev. Lett., 113:088701, 2014. doi: 10.1103/PhysRevLett.
413
113.088701.
414
Open Science Collaboration. Estimating the reproducibility of psychological science.
415
Science, 349(6251), 2015. doi: 10.1126/science.aac4716.
416
Pivotal Software, Inc. RabbitMQ, 2016. URLhttps://www.rabbitmq.com/. Last accessed
417
April 27, 2016.
J. Qiu, S. Jha, A. Luckow, and G. C. Fox. Towards hpc-abds: An initial high-performance
419
big data stack. InProceedings of 1st ACM Big Data Interoperability Framework Workshop:
420
Building Robust Big Data ecosystem, 2014.
421
M. Raento, A. Oulasvirta, and N. Eagle. Smartphones: An emerging tool for
so-422
cial scientists. Sociological Methods & Research, 37(3):426–454, 2009. doi: 10.1177/
423
0049124108330005.
424
S. Rafaeli. Interactivity: From new media to communication. Sage annual review of
425
communication research: Advancing communication science, 16(CA):110–134, 1988.
426
J. Ratkiewicz, M. Conover, M. Meiss, B. Gonçalves, A. Flammini, and F. Menczer.
De-427
tecting and tracking political abuse in social media. In Proc. 5th Intl. AAAI Conf. on
428
Weblogs and Social Media (ICWSM), 2011a.
429
J. Ratkiewicz, M. Conover, M. Meiss, B. Gonçalves, S. Patil, A. Flammini, and F. Menczer.
430
Truthy: Mapping the spread of astroturf in microblog streams. InProc. 20th Intl. World
431
Wide Web Conf. Companion (WWW), 2011b.
432
D. M. Romero, B. Meeder, and J. Kleinberg. Differences in the mechanics of information
433
diffusion across topics: Idioms, political hashtags, and complex contagion on Twitter.
434
InProc. 20th Intl. Conf. on World Wide Web (WWW), pages 695–704, 2011. doi: 10.1145/
435
1963405.1963503.
436
D. Ruths and J. Pfeffer. Social media for large studies of behavior. Science, 346(6213):
437
1063–1064, 2014. doi: 10.1126/science.346.6213.1063.
438
D. Selassie, B. Heller, and J. Heer. Divided edge bundling for directional network data.
439
IEEE Transactions on Visualization and Computer Graphics, 17(12):2354–2363, 2011. doi:
440
10.1109/TVCG.2011.190.
441
M. Á. Serrano, M. Boguná, and A. Vespignani. Extracting the multiscale backbone of
442
complex weighted networks. Proceedings of the National Academy of Sciences, 106(16):
443
6483–6488, 2009.
444
A. Solem and Contributors. Celery, 2016. URLhttp://www.celeryproject.org/. Last
445
accessed April 05, 2016.
446
V. Subrahmanian, A. Azaria, S. Durst, V. Kagan, A. Galstyan, K. Lerman, L. Zhu, E.
Fer-447
rara, A. Flammini, F. Menczer, et al. The DARPA Twitter Bot Challenge. IEEE
Com-448
puter, 2016. Forthcoming. Preprint arXiv:1601.05140.
449
O. Tene and J. Polonetsky. Privacy in the age of big data: a time for big decisions.
450
Stanford Law Review Online, 64:63, 2012.
451
P. Terna et al. Simulation tools for social scientists: Building agent based models with
452
swarm. Journal of artificial societies and social simulation, 1(2):1–12, 1998.
453
The Apache Software Foundation. Apache HBase, 2016a. URLhttp://hbase.apache.
454
org/. Last accessed April 05, 2016.
455
The Apache Software Foundation. Hadoop, 2016b. URL http://hadoop.apache.org/.
456
Last accessed April 05, 2016.
The Apache Software Foundation. Apache Solr, 2016c. URLhttp://lucene.apache. 458
org/solr/. Last accessed April 05, 2016.
459
The Apache Software Foundation. Apache Hadoop YARN, 2016d. URLhttp://hadoop.
460
apache.org/docs/current/hadoop-yarn/hadoop-yarn-site/YARN.html. Last
ac-461
cessed April 05, 2016.
462
J. Travers and S. Milgram. An experimental study of the small world problem.
Sociome-463
try, pages 425–443, 1969.
464
Twitter, Inc. Developer policy. Available at: https://dev.twitter.com/overview/
465
terms/policy, Internet Archive: https://web.archive.org/web/20160311122344/ 466
https://dev.twitter.com/overview/terms/policy, 2016. Last accessed:
467
04/09/2016.
468
O. Varol, E. Ferrara, C. Ogan, F. Menczer, and A. Flammini. Evolution of online user
469
behavior during a social upheaval. InProc. ACM Web Science Conference (WebSci), 2014.
470
E. Vayena, M. Salathé, L. C. Madoff, and J. S. Brownstein. Ethical challenges of big data
471
in public health. PLoS Comput Biol, 11(2):e1003904, 2015. doi: 10.1371/journal.pcbi.
472
1003904.
473
L. Weng and F. Menczer. Topicality and impact in social media: Diverse messages,
474
focused messengers. PLoS ONE, 10(2):e0118410, 2015.
475
L. Weng, A. Flammini, A. Vespignani, and F. Menczer. Competition among memes in a
476
world with limited attention. Sci. Rep., 2(335), 2012.
477
L. Weng, F. Menczer, and Y.-Y. Ahn. Virality prediction and community structure in
478
social networks. Sci. Rep., 3(2522), 2013a.
479
L. Weng, J. Ratkiewicz, N. Perra, B. Gonçalves, C. Castillo, F. Bonchi, R. Schifanella,
480
F. Menczer, and A. Flammini. The role of information diffusion in the evolution of
481
social networks. In Proc. 19th ACM SIGKDD Conference on Knowledge Discovery and
482
Data Mining (KDD), 2013b.
483
L. Weng, F. Menczer, and Y.-Y. Ahn. Predicting successful memes using network and
484
community structure. In Proc. Eighth International AAAI Conference on Weblogs and
485
Social Media (ICWSM), 2014.
486
T. B. Wiggins, X. Gao, and J. Qiu. IndexedHBase, 2016. URL http://salsaproj.
487
indiana.edu/IndexedHBase. Last accessed April 05, 2016.
488
T.-L. Wu, B. Zhang, C. A. Davis, E. Ferrara, A. Flammini, F. Menczer, and J. Qiu. Scalable
489
query and analysis for social networks: An integrated high-level dataflow system with
490
pig and harp. In M. Thai, H. Xiong, and W. Wu, editors,Big Data in Complex and Social
491
Networks. Chapman and Hall/CRC, 2016. Forthcoming.
492
M. Zimmer. The Twitter archive at the library of congress: Challenges for information
493
practice and information policy. First Monday, 20(7), 2015.