International Journal of Innovative Technology and Exploring Engineering (IJITEE) ISSN: 2278-3075, Volume-8, Issue- 6S4, April 2019
Abstract— In numerous investigates, regardless of whether or not beneficial or hypothetical, an inquiry that emerges in performing examination of change is the Homogeneity of Variance suspicion. Severa analysts have checked out terrific assessments for trying out homogeneity of fluctuation and reached determinations dependent on the power and shortcomings of these checks with out considering the effectiveness of these exams below transferring reproduces and gatherings. This paper is devoted to looking on the productivity of Bartlett and Levenes assessments for trying out homogeneity of change depending on each power and kind I blunder beneath transferring variety of reproduces and gatherings (with same contrasts organized with the aid of strategies) for single course ANOVA through one thousand reproductions of arbitrary ordinarily disseminated facts for each mixture of imitates and gatherings. The aftereffects of the exam uncovered that, all in all, type I blunder price diminishes from zero.1 to zero.05 and after that remaining elements quite tons in a degree as the amount of repeats builds unbiased of the quantity of gatherings. Anyways, it seems while range of gatherings is three or a good deal less, Levenes take a look at is better, and Bartlett take a look at is higher when variety of collecting increments. As for kind II blunder, each check brought approximately consistent abatement in mistake rate as sort of recreates and gatherings increments. Be that as it may, each check executed inadequately even with 30 duplicates for every collecting irrespective of the truth that Bartlett test achieved advanced to Levenes at better variety repeats. Turning into test want to be selected by using structure of the data and want to kind I mistake and type II blunder.
Keywords:— type I error, type II error, simulation, testing assumptions
I. INTRODUCTION
Finding out Homogeneity of fluctuation is frequently of enthusiasm as a starter to investigation of difference (ANOVA). Trying out Homogeneity of Variance (HOV) is an basically greater tough hassle than contrasting strategies or proportions of region through and huge. That is while you take into account that the usual test insights for endorse examinations are typically institutionalized to be hearty to non-ordinariness, specifically with huge examples. Curiously, everyday speculation test insights for contrasting fluctuations are not correctly institutionalized with be robust to non-typicality. Asymptotically, these measurements are
Revised Manuscript Received on April 12, 2019.
B. Odoi, University of Mines and Technology, Tarkwa, Ghana. ([email protected])
S. Samita, University of Peradeniya, Sri-Lanka. ([email protected]) S. Al-Hassan, University of Mines and Technology, Tarkwa, Ghana. ([email protected])
S. Twumasi-Ankrah, Kwame Nkrumah University of Science and Technology, Kumasi, Ghana. ([email protected])
not dissemination unfastened, but depend upon the kurtosis of the decide dispersions.
Each measurable approach have hidden suppositions. Once in a while, infringement of those presumptions won't in reality have an effect on find out ends. In particular cases, infringement of suspicions is primary to huge ends. Building up that statistics meet the presumptions of the technique is a regular segment of all quantitatively primarily based research [1]. One of the most acknowledged ground-breaking trial of HOV, if the hidden populaces are regular, is the Bartlett take a look at [2]. As constant with reenactments directed with the resource of certain analysts, Bartlett's check has been commonly applied in past studies, as a latest of intensity for the okay bunch homogeneity of difference assessments [3]. [4] delivered that, with non-ordinary facts, Bartlett has and box's exams can be carried out if the examples are truely massive. As an extended manner as type I and type II mistake charge, Levenes take a look at had decrease kind I blunder than Bartlett test [5]. This paper tries to build up the skillability of Bartlett and Levene checks, the most broadly diagnosed checks applied for trying out HOV, under converting extensive type of reproduces and gatherings in unmarried route ANOVA, notwithstanding the shortcomings accentuated thru sure analysts making those test appearance so mediocre for use.
II. METHODS USED
The consideration in ANOVA is
k
random samples ofsize
n
i, wheren
i is thei
th sample size or number ofreplicates from the
i
th population (group), one from each ofthe
k
populations with means,
i and variances,
i2 where1, 2,
i
k
. The basic problem in ANOVA is to determine whether k populations have common
. The F-test in ANOVA assumes that, in each of the population the variable studied has a common variance
2. Hence, it is necessary to investigate whether a common variance exists across populations before testing equality of population means.Efficiency of Bartlett and Levenes Tests for
Testing Homogeneity of Variance Under
Varying Number of Replicates and Groups in
Replicates And Groups In One – Way Anova A. Bartlett’s Test
Bartlett's test is an inferential strategy used to survey the fairness of fluctuation in different populaces. Bartlett's measurement [6] was initially proposed to test the Homoscedasticity of two typically disseminated populaces. Afterward, it was reached out to test the equity of change for different populace [7]. In Bartlett's test, the in test need not to be equivalent. Be that as it may, ought not be littler than 3, and frequently it is expressed that ought to be bigger than 5. It tests the invalid theory that the populace differences are equivalent. It has been demonstrated that Bartlett's test is unprejudiced [8] and reliable [9]. One of its real shortcoming, notwithstanding, is that it is very delicate (that is non-hearty) to the takeoffs from typicality [10]. This test has been regularly utilized by numerous specialists ([11]; [12]; [13]; [14]; [15]; [16]) to test the homogeneity of differences.
The test statistic
B
is given by
2 2
1
1
( ) ln 1 ln
1 1 1
1
3 1 1
k
p i i
i k
i i
n k s n s
B
k n n k
(1)where 2
21
1 1
i n
i ij i
j i
s X X
n
is the variance ofreplicates of the
i
th group,k
number of groups,n
i
number of replicates for the
i
th group, and1 k i i
n
n
.The pooled variance
2 2 1 1 1 1 k i i i p k i i n s s n
is the weighted
average of the sample variance. At least two variances are said to be significantly different at significance level
if2,k 1
B
.B. Levene’s Test
Levene’s test [17] is also used to test if
k
samples have equal variances. The Levene’s test was derived from the common F- ratio in one- way ANOVA with thej
thobservation in
i
th group,y
ij being replaced by its absolutedeviation from its group mean,
Z
ij
y
ij
y
i. wherey
i.is the estimate measure center of the
i
th group. The Levene test is less sensitive than the Bartlett test to departure from normality [18]. Given that a variable y with total numberof observations
n
divided intok
groups, wheren
i is thenumber of replicates for the
i
thgroup, then the Levene’s test statistic is
2 . .. 1 2 . 1 1 ( )1 ( )
i k i i i n k ij i i j
n k n z z
W
k z z
(2)where . 1
i n ij j i i
z
z
n
and .. 1 1i n k ij i j
z
z
n
Levene test rejects the null hypothesis that the variances are equal at the significant level of
if W F,k1,nkwhere
F
,k 1,n k is the upper critical value of the F-distribution. This test has been commonly employed by many researchers and has proven to be very powerful ([19]; [20]; [21]; [22]; [23]; [24]; [25]; [26]).
C. Simulation Study
The investigation was directed utilizing mimicked information created from R factual programming. Utilizing the produced information, the exhibition of Bartlett and Levenes tests were assessed. As indicated by the targets, reproductions were completed under various situations of recreates and gatherings for each. Thousand (1000) reenactments were done for every situation and information were produced to fulfill the ordinary dissemination with parameters indicated in Table 1.
Table 1 Structure of the Data for Simulation Number of groups Number of replicates for each group Means of groups Variances of groups 3 3, 4, 5, 6, 8,
10, 15, 20, 25
15, 25, 35 constant variance 2
5
3 3, 4, 5, 6, 8, 10, 15, 20, 25
15, 25, 35 unequal variance
2
5,7,9
4 3, 4, 5, 6, 8, 10, 15, 20, 25
15, 25, 35, 45 constant variance 2 5
4 3, 4, 5, 6, 8, 10, 15, 20, 25
15, 25, 35, 45
unequal variance
2 5, 7, 9,11
5 3, 4, 5, 6, 8, 10, 15, 20, 25
15, 25, 35, 45, 55
constant variance
2
5
5 3, 4, 5, 6, 8, 10, 15, 20, 25
15, 25, 35, 45, 55
unequal variance 2
5, 7,9,11,13
D. Type I and Type II error rate
In this study, type I error rates were calculated based on the proportion of times each test incorrectly concluded that distribution had unequal variances at
0.05. [image:2.595.313.540.55.169.2] [image:2.595.300.554.398.629.2]International Journal of Innovative Technology and Exploring Engineering (IJITEE) ISSN: 2278-3075, Volume-8, Issue- 6S4, April 2019 III. ANALYSIS OF RESULTS
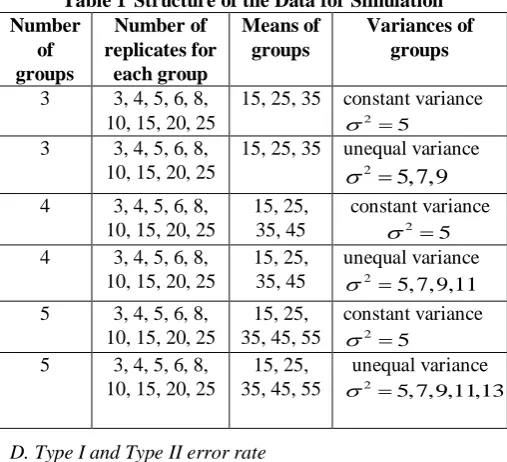
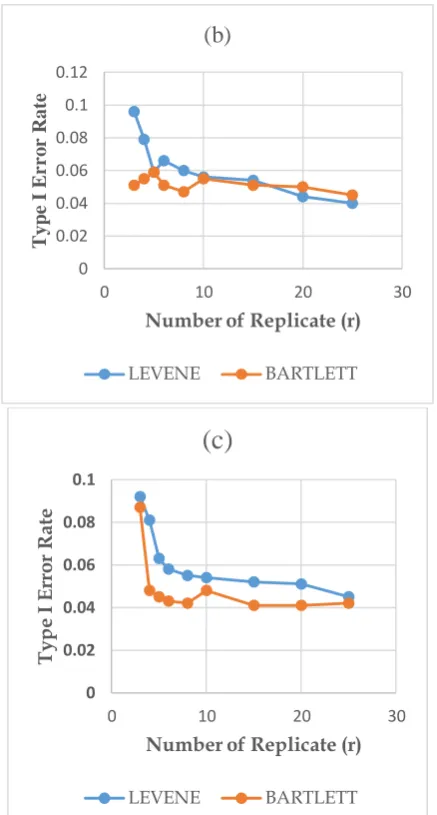
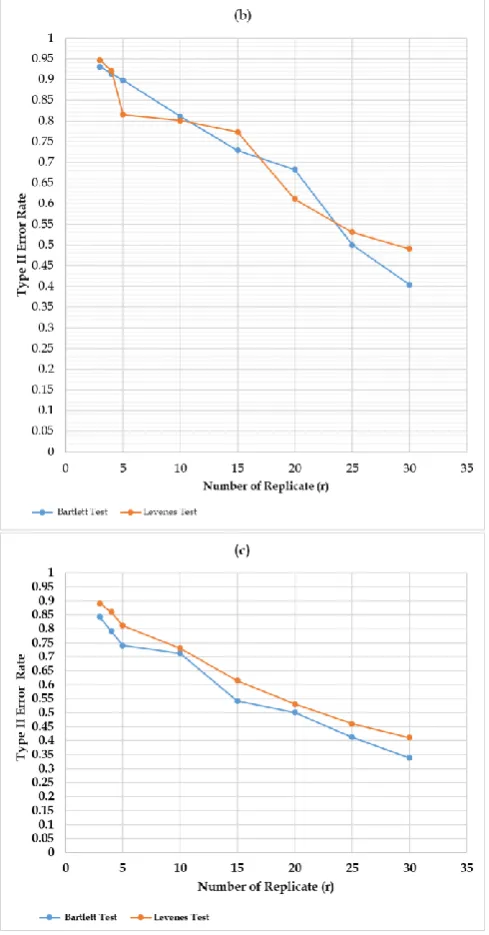
[image:3.595.317.536.48.456.2]The aftereffects of the investigation uncovered that, for all gathering sizes, the two exams added about high type I mistake rate of about 0.1 whilst type of recreates for each accumulating is not exactly round five, and little by little diminished up to about zero.05 whilst extensive sort of duplicates methods to cope with five. It stayed pretty an lousy lot unaltered beyond 5 reproduces, impartial of the amount of gatherings. With three gatherings, It become visible that, Levenes test executed extraordinarily better when the amount of imitates is beyond five (parent 1 (a)). With the 4 gathering case, it changed into determined that, beyond five duplicates, execution of the two checks to be quite lots equal with slight development with the growth of quantity of repeats (discern 1 (b)). For the 5 collecting case, Bartlett test became actually higher contrasted with Levenes, irrespective of the truth that the instance of improvement with form of recreates become identical with the two tests. On this manner, it might appear that Bartlett check plays better with better wide type of gatherings, and the Levenes check is better when the amount of gatherings is 3 or a whole lot less. Regarding type II blunder, the 2 checks had a steady lessening in kind II mistake charge with the growth of style of imitates, independent of the amount of gatherings but finished in all respects ineffectively. The instance on change modified into pretty an awful lot direct with the boom of number of duplicates. It changed into stressful to see that, the two exams were horrible despite 20 reproduces. (decide 2). Anyways, it changed into sure that both test had a faded type II blunder beneath all accumulating sizes with the enlargement of wide variety of recreates. With 3and four gatherings (determine 2a), no take a look at changed into palatable even at 30 imitates (type II blunder bigger than 0.4). Albeit the two assessments are sprucing off higher with the increase of wide sort of imitates, it appears Bartlett check is carrying out desired quicker over that of Levenes. Actually, in spite of 5 gatherings, but Bartlett take a look at took place kind II blunder fee diminishing to 0.3 at the same time as quantity of recreates completed 30.
Figure 1 Type I Error Rate at Different Groups and Replicates (a) number of groups 3, (b )number of groups
4, (c) number of groups 5
0 0.02 0.04 0.06 0.08 0.1 0.12
0 10 20 30
Ty
p
e
I
E
rr
or
R
ate
Number of Replicate (r)
(a)
LEVENE BARTLETT
0 0.02 0.04 0.06 0.08 0.1 0.12
0 10 20 30
Typ
e
I
Er
r
o
r
R
ate
Number of Replicate (r)
(b)
LEVENE BARTLETT
0 0.02 0.04 0.06 0.08 0.1
0 10 20 30
Ty
p
e
I
E
rr
or
R
ate
Number of Replicate (r)
(c)
Replicates And Groups In One – Way Anova
Figure 2 Type II Error Rate at Different Groups and Replicates (a) number of groups 3, (b) number of groups
4, (c) number of groups 5
IV. CONCLUSION
It's miles vital and strategic for analysts to pick the maximum proficient take a look at in attempting out homogeneity of fluctuation (HOV). In view of the reproductions on this studies, manifestly, one take a look at (both Bartlett or Levenes) can not be prescribed as for every type I and type II mistake. At the off hazard that the need is kind II mistake, no take a look at may be prescribed in spite of 30 recreates. Be that as it could, the 2 tests are acting higher with the enlargement of wide sort of duplicates in step with bunch sincerely as variety of gatherings. In spite of amount of gatherings, Bartlett plays higher with sizeable wide style of repeats. It seems to be each take a look at may be relied upon to perform properly with big style of
seems Bartlett take a look at performs higher with the growth of range of gatherings. Alongside those strains, one may moreover pick any of these checks relying at the need to type I blunder fee and type II mistake fee, and the amount of duplicates according to collecting utilized within the research.
REFERENCES
1. Lemeshko, B., Yu, E. Mirkin, "Bartlett take a look at in estimations with possibility prison recommendations now not similar to might be anticipated." dimension strategies, vol. Forty seven, no. 10, pp. 960-968, 2004.
2. nevertheless,A. W. What's greater, White, A. P., "The difficult randomization check as an alternative in assessment to the F test in examination of alternate." British journal of Mathematical and Statistical Psychology, vol. 34, no. 2, pp. 243-252, 1981.
3. O'Brien, R.G., "effective techniques for trying out heterogeneity of fluctuation affects in factorial plans." Psychometrika, vol. Forty three, no. Three, pp.327-342, 1978. 4. Legendre, P. What's extra, Borcard, D., "Measurable
correlation of univariate trial of homogeneity of variations." magazine of Statistical Computation and Simulation, pp. 514, 2008.
5. Vorapongsathorn, T., Taejaroenkul, S. What's extra, Viwatwongkasem, C., "A correlation of kind I and depth of Bartlett's take a look at, Levene's test and Cochran check under infringement of presumptions." Songklanakarin J. Sci. Tecnol, vol. 26, no. 4, pp. 537-547, 2004.
6. Bartlett, M. S., "residences of adequacy and measurable checks." proceedings of the Royal Society of London. Arrangement A, Mathematical and bodily Sciences, pp .268-282, 1937.
7. Snedecor G. W.And Cochran, W. G., Statistical techniques, 8th edition, Lowa kingdom university Press. Ames, IA, 1989. 8. Pitman, E. J. G., "Trial of Hypotheses regarding location and
Scale Parameters." Biometrika, 31, pp. Two hundred-25, 1939.
9. Brown, G. W., "on the electricity of the L1 check for Equality of severa Variances." Ann. Math. Element., vol.10, pp. 119-128, 1939.
10. container, George EP. "Non – typicality and tests on variations." Biometrika, vol. 40, no. 3/4, pp. 318-335, 1953. 11. Conover, W. J., Johnson, M. E. What's more, Johnson, M. M.,
"A Comparative investigation of checks for homogeneity of variations, with applications to the out of doors mainland rack imparting facts." Technometrics, vol.Four, no. 23, pp. 351-361, 1981.
12. Lim, T. S. What's greater, Loh, W. Y. A correlation of trial of fairness of modifications. Computational statistics and statistics evaluation, vol. 22, no. 3, pp. 287-301, 1996. 13. Ott R. L., Longnecker M. T., "A prologue to measurable
strategies and statistics studies." Belmont, CA: Cengage studying, 2010.
14. Scheffe, H., "the relationship of manage graphs to exam of change and chi-square tests." mag of the yank Statistical association, vol. Forty , no. 239, pp. 425-431, 1947.
15. Sharma, D. What's more, Kibria, B.G., "On some check measurements for checking out homogeneity of modifications:" a close to record. Diary of Statistical Computation and Simulation, vol. Eighty 3, no. 10, pp. 1944-1963, 2013.
International Journal of Innovative Technology and Exploring Engineering (IJITEE) ISSN: 2278-3075, Volume-8, Issue- 6S4, April 2019
Homogeneity of Variance in a unmarried-difficulty ANOVA models (SAS)." journal of current achieved Statistical strategies, vol.Sixteen, no. 2, pp. 506-539, 2017.
17. Levene, H., "powerful assessments for correspondence of variations in dedication to likelihood and statistics (Ed) 1." Olkin: Stanford university Press, Palo Alto, 1960.
18. Brown, M. B. What's more, Forsythe, A. B., "active checks for the equity of variations." journal of the yankee Statistical association, vol.69, no. 369, pp. 364-367, 1974.
19. Ramsey, P.H., "attempting out adjustments in highbrow and instructive research." mag of instructional facts, vol. 19, no. 1, pp. 23-42, 1994.
20. D. D. Boos and C. Brownie, "Contrasting Variances and unique Measures of Dispersion." Statistical technological know-how vol. 19, no. 4, 571–578, 2004.
21. Mendes, M. What is more, Ozcaya Turhan, N., "some other choice in checking out for homogeneity of variations." magazine of Statistical research, vol. Forty, no. 2, pp. Sixty five-83, 2006.
22. Lee, H. B., Katz, G. S. What's greater, Restori, A. F., "A Monte Carlo studies of seven homogeneity of change checks." mag of mathematics and facts, vol.6, no. Three, pp. 359-366, 2010.
23. Wang, Y., Rodríguez de Gil, P., Chen, Y. H., Kromrey, J. D., Kim, E. S., Pham, T., Nguyen, D. What is more, Romano, J. L., "Contrasting the presentation of methodologies for checking out the homogeneity of fluctuation suspicion in one-difficulty ANOVA models." academic and highbrow estimation, vol. 7, no .2, pp. 305-329, 2017.
24. Conover, W. J., Guerrero-Serrano, A.J. What is more, Tercero-Gómez, V. G. "A file on 'a close to analyze of exams for homogeneity of distinction." mag of Statistical Computation and Simulation, vol.88, no. 8, pp. 1454-1469, 2018.
25. Kim, Y. J. What's extra, Cribbie, R. An., "ANOVA and the change homogeneity supposition: Exploring a superior protect." British magazine of Mathematical and Statistical Psychology, vol.71, no.1, pp. 1-12, 2018.