PARTIAL LEAST SQUARE APPROACH TO SECOND
ORDER FACTOR IN BEHAVIOURAL STUDY OF
ACCOUNTING INFORMATION SYSTEM
Mohd Tarmizi Ibrahim*, Saiyidi Mat Roni**Accounting Research Institute, Universiti Teknologi Mara, Malaysia* Faculty of Accountancy Universiti Teknologi MARA (Melaka) Malaysia**
ABSTRACT
Theories are developed to explain an observed phenomenon in an effort to understand why and how things happen. Theories thus, use latent variables to estimate conceptual parameters. The level of abstraction depends, partly on the complexity of the theoretical model explaining the phenomenon. The conjugation of directly-measured variables leads to a formation of a first-order factor. A combination of theoretical underpinnings supporting an existence of a higher-order components, and statistical evidence pointing to such presence adds advantage for the researchers to investigate a phenomenon both at an aggregated and disjointed dimensions. As partial least square (PLS) gains its tractions in theory development, behavioural accounting discipline in general should exploit the flexibility of PLS to work with the higher-order factors. However, technical guides are scarcely available. Therefore, this article presents a PLS approach to validate a higher-order factor on a statistical ground using accounting information system dataset.
Keywords:Second-order factor, partial least square, PLS
INTRODUCTION
Partial least square (PLS) which was pioneered by Wold (1985), lends its relevance in the theory building. This helps researchers to explain an observed phenomenon into components that can be understood, hence acted upon. Although theories are designed to simplify explanations as why and how things happen, the level of abstractions at which the components in a theoretical model are represented can render the model too complex to evaluate or measure with relatively precision.
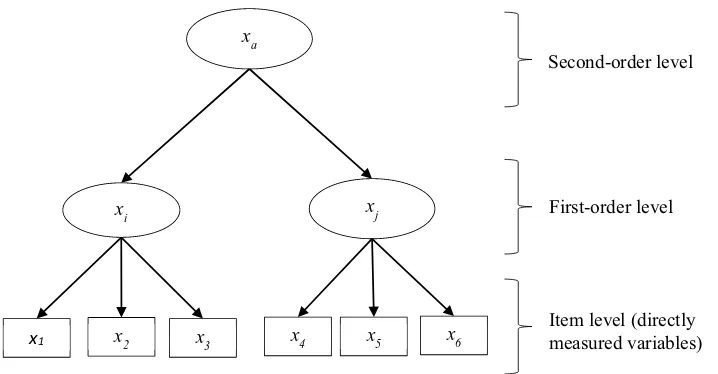
In situations where variables are not directly measured, the researchers approximate the components that make up building blocks of a theory. The components, referred as latent variables (LVs) or factors are represented by a conjugations of related indicators. As shown in Figure 1,
x
i and xj are LVs which compose of their respective blocks of indicators x1, x2,…, x6. This level of abstraction known as first-order factor.Figure 1.Reflective first- and second-order factors
As LVs can be measured at any level of abstraction (Hair, Black, Babin, & Anderson, 2010), a higher-order LV represents factors that apparently distinct, yet related, lower-order latent variables (Chen, Sousa, & West, 2005). The use of a higher-order in a structural equation modelling (SEM), particularly covariance-based SEM, results in more a parsimonious model.
For interpretative purposes, with sound theoretical backings and sufficient statistical parameters to support an aggregation of the first-order to higher-order factors, the use of second-order factor can provide a new dimension for the researchers to examine the phenomenon of interest. In this article, we use theory of planned behaviour to illustrate how PBC are populated into a single second-order factor which forms a basis for other statistical tests within the context of accounting information system.
Theory of Planned Behaviour
Theory of planned behaviour (TPB) is a widely-used theory used to explain behaviour in many disciplines. TPB consists of five components where the outcome variable is actual behaviour (behaviour) that can be predicted directly by intention and perceived behaviour control (PBC). Intention is further affected by attitude,subjective norm, and PBC. As mentioned earlier, PBC is a higher-order factor which is derived from a conjugation of efficacy and control. The relationship of these components is illustrated in Figure 2.
x1 x2 x3
xi xj
x4 x5 x6
xa
Figure 2. Theory of planned behaviour
The focus of this article is to illustrate how PBC can be unitarily designed at a higher-order level from two lower-order constructs. Therefore, discussion on the theoretical aspect of each component is not demonstrated.
METHODOLOGY
A total of 387 responses received from middle managers from regional industrial estate across Malaysia peninsular. This data are used to illustrate PLS approach to second-order factor. The survey instrument was designed to approximate the respondent’s predispositions toward dysfunctional behaviour related to the use of firm’s accounting information system. Three main components of theory of planned behaviour (intention, attitude, and subjective norm) were measured using items adapted from prior work. Perceived behaviour control on the other hand, was measured using its lower-order components, efficacy and control, based on five items. All items were put on a 7-point Likert scale. WarpPLS 5.0 was later used to build and test the model with the firs-order and second-order factors. The steps to validate the measurement model are detailed in the following section.
INTENTION BEHAVIOUR ATTITUDE
SUBJECTIVE NORM
PBC
EFFICACY
Table 1 summarises the number of items used to measure each TPB component.
Table 1. Item measure for construct
Construct/Factor Nitems References
Intention (INTENT) 5 Chatterjee (2008)
Venkatesh, Morris, Gordon, and Davis (2003) Attitude (ATT) 2 Chatterjee (2008)
Venkatesh et al. (2003) Subjective norm (SN) 3 Ajzen (1991)
Chatterjee (2008) Venkatesh et al. (2003) Self-efficacy
(EFFICACY)
3 Thompson, Higgins, and Howell (1991) Venkatesh et al. (2003)
Controllability (CONTROL)
2 Ajzen (1991)
First-Order Component Validation
Theoretically, an item is said to have sufficient convergent validity when the item measures a latent variable (LV) or factor for which it is designed for. From statistical point of view, this usually means items having high loading (> .50) on their parent factor (Hair et al., 2010; Kline, 2010; Schumacker & Lomax, 2012) and crossload low on other factors give an indication of good convergent validity. The loadings should also be statistical significant as p-values are used as validation parameters in a confirmatory factor analysis. Additionally, average variance extracted (AVE) for each LV should exceed a minimum threshold of .50 (Hair et al., 2010; Urbach & Ahlemann, 2010), and a minimum composite reliability (CR) of the construct has to be at .70.
In order to assess discriminant validity of a construct, Fornell and Larcker (1981) suggest that, square-root of AVE of a construct has to be higher than the construct’s correlations with other constructs. In addition, variance inflation factor (VIF), a measure of collinearity, is to remain below 5.0, although 3.30 is a normally practiced as a stringent threshold.
The result of the model with the first-order factor shows that the criteria for factor loadings, crossloadings, AVE, CR and multicollinearity VIF test were met. This is summarised in Table
[image:5.482.82.409.71.191.2]2.
Table 2. Construct correlation matrix and average variance extracted (AVE) for first-order factor
ATT SN EFFICACY CONTROL INTENT VIF
ATT (.975) 3.070
SN .772 (.954) 3.291
EFFICACY .642 .681 (.980) 3.595
CONTROL .574 .636 .806 (.872) 2.996
INTENT .770 .772 .711 .643 (.924) 3.433
Second-Order Component Validation
The initial stage produces parameter estimates for the components and also computes their factor scores. The factor score for EFFICACY and CONTROL were then used as the scores to compute the higher-order PBC.
Hair, Black, Babin, Anderson, and Tatham (2006) suggest that a higher-order construct to be assessed in a similar manner as in the lower-order construct structure. Therefore, reliability, discriminant and convergent validity were checked again against acceptable threshold values.
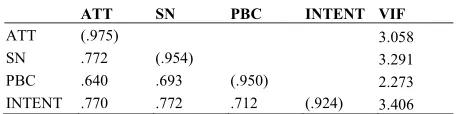
[image:6.482.127.355.281.338.2]Outputs from this stage show that EFFICACY and CONTROL had significant loading on PBC (loading = .95, p < .001). Further, AVE of PBC was .90. Table 3further supports discriminant validity of PBC with the square-root of AVE that was higher than the maximum shared variance among the constructs. Other parameter estimates for ATT, SN, and INTENT were all satisfactory.
Table 3. Construct correlation matrix and average variance extracted (AVE) for second-order factor
ATT SN PBC INTENT VIF
ATT (.975) 3.058
SN .772 (.954) 3.291
PBC .640 .693 (.950) 2.273
INTENT .770 .772 .712 (.924) 3.406
CONCLUSION
The flexibility in partial least square (PLS) allows researchers to advance our knowledge to illuminate patterns in an apparently chaotic phenomenon. This flexibility also provides us lenses to look at a theory at different level of aggregation which gives us a broad understanding of an observed phenomenon.
As shown in the article, perceived behaviour control (PBC) from theory of planned behaviour (TPB) was theoretically vindicated as unitary at a higher-order of abstraction which was a result of a conjugation of two distinct latent variables. Using dataset in behavioural study in accounting information system (AIS), the theoretical argument was confirmed through statistical validations with PLS. When there is a sound theoretical underpinning supporting the existence of lower- and higher-order factors, researchers are encouraged to validate the connotation with statistical evidence. Having examining the models at both levels can enhance discussions and contribute to the pool of existing knowledge.
REFERENCES
Ajzen, I. (1991). The theory of planned behavior. Organizational Behavior and Human Decision Processes, 50(2), 179-211. doi:10.1016/0749-5978(91)90020-t
Chatterjee, S. (2008). Unethical behavior using information technology. (Ph.D. 3370378), Washington State University, United States -- Washington. ABI/INFORM Complete; ProQuest Central; ProQuest Dissertations & Theses (PQDT) database.
Chen, F. F., Sousa, K. H., & West, S. G. (2005). Teacher's Corner: Testing Measurement Invariance of Second-Order Factor Models. Structural Equation Modeling: A Multidisciplinary Journal, 12(3), 471-492. doi:10.1207/s15328007sem1203_7
Djajadikerta, H. G., Mat Roni, S., & Trireksani, T. (2015). Dysfunctional information system behaviors are not all created the same: Challenges to the generalizability of security-based research. Information & Management, 52(8), 1012-1024.
doi:http://dx.doi.org/10.1016/j.im.2015.07.008
Fornell, C., & Larcker, D. F. (1981). Evaluating structural equation models with
unobservable variables and measurement error. JMR, Journal of Marketing Research, 18(1), 39.
Greene, G., & D'Arcy, J. P. (2010, 16-17 June 2010). Assessing the impact of security culture and the employee-organisation relationship on IS security compliance. Paper
presented at the 5th Annual Symposium on Information Assurance 2010, New York.
Hair, J. F., Black, W. C., Babin, B. J., & Anderson, R. E. (2010). Multivariate data analysis (7 ed.). Upper Saddle River, NJ, USA: Prentice-Hall, Inc.
Hair, J. F., Black, W. C., Babin, B. J., Anderson, R. E., & Tatham, R. L. (2006). Multivariate data analysis (6 ed.). New Jersey: Pearson Prentice Hall.
Kline, R. B. (2010). Principles and Practice of Structural Equation Modeling, Third Edition (3 ed.). New York: Guilford Publications.
Schumacker, R. E., & Lomax, R. G. (2012). A Beginner's Guide to Structural Equation Modeling : Third Edition (3 ed.). Hoboken: Taylor and Francis.
Thompson, R. L., Higgins, C. A., & Howell, J. M. (1991). Personal computing: Toward a conceptual model of utilization. MIS Quarterly, 15(1), 125-143.
Urbach, N., & Ahlemann, F. (2010). Structural Equation Modeling in Information Systems Research Using Partial Least Squares. Journal of Information Technology Theory and Application, 11(2), 5-40.
Venkatesh, V., Morris, M. G., Gordon, B. D., & Davis, F. D. (2003). User Acceptance of Information Technology: Toward a Unified View. MIS Quarterly, 27(3), 425-478.