Rochester Institute of Technology
RIT Scholar Works
Theses Thesis/Dissertation Collections
8-1-2011
Design and development of a sustainability toolkit
for simulation modeling and analysis
Xi Zhou
Follow this and additional works at:http://scholarworks.rit.edu/theses
This Thesis is brought to you for free and open access by the Thesis/Dissertation Collections at RIT Scholar Works. It has been accepted for inclusion in Theses by an authorized administrator of RIT Scholar Works. For more information, please [email protected].
Recommended Citation
Rochester Institute of Technology
DESIGN AND DEVELOPMENT OF A SUSTAINABILITY TOOLKIT FOR
SIMULATION MODELING AND ANALYSIS
A Thesis
Submitted in partial fulfillment of the
requirements for the degree of
Master of Science in Industrial Engineering
in the
Department of Industrial & Systems Engineering
Kate Gleason College of Engineering
by
Xi Zhou
DEPARTMENT OF INDUSTRIAL AND SYSTEMS ENGINEERING
KATE GLEASON COLLEGE OF ENGINEERING
ROCHESTER INSTITUTE OF TECHNOLOGY
ROCHESTER, NEW YORK
CERTIFICATE OF APPROVAL
M.S. DEGREE THESIS
The M.S. Degree Thesis of Xi Zhou
has been examined and approved by the
thesis committee as satisfactory for the
thesis requirement for the
Master of Science degree
Approved by:
____________________________________ Dr. Michael E. Kuhl, Thesis Advisor
____________________________________ Dr. Andres Carrano
ABSTRACT
A simulation-based sustainability toolkit is developed in this research, in order to
efficiently provide the capability of modeling and evaluating the sustainability related
performance measures in systems of interest. As sustainability related issues, such as energy
consumption, emissions, and waste generation are becoming a more integrated part of
operational and long-term planning decisions, simulation modeling is needed to analyze the
system performance not only from the traditional system performance measures such as
productivity and efficiency, but also taking into account the environmental impacts within the
studied system in order to aid in decision-making. This research introduces the concept and
general methodology to develop such a sustainability toolkit for simulation and provides a
prototype implementation of the toolkit using commercially available discrete event simulation
software. In particular, toolkit modules have been developed for modeling and evaluating the
sustainability aspects of transportation and logistics systems, industrial and manufacturing
processes, and warehouse material handling systems. Furthermore, general sustainability toolkit
modules are constructed to model other systems of interest. The toolkit contains a flexible
framework which enables the simulation modeling and analysis of the sustainability related
performance measures as easily as traditional system performance measures. The toolkit will
enable the users to efficiently simulate complex systems taking into account system
TABLE OF CONTENTS
ABSTRACT ... ii
1 INTRODUCTION... 1
2 PROBLEM STATEMENT ... 4
3 LITERATURE REVIEW ... 7
3.1 Sustainability Related Issues and Measurements ... 7
3.2 Discrete-Event Simulation Overview ... 9
3.2.1 Discrete-Event Simulation Components ... 10
3.2.2 Discrete-Event Simulation Execution ... 10
3.2 Simulation Software... 14
3.3 Simulation Applied to Sustainability ... 14
4 RESEARCH SCOPE AND METHODOLOGY ... 18
4.1 Sustainability Toolkit Development Methodology ... 20
4.2 Application Areas of the Sustainability Toolkit ... 22
4.3 Development and Implementation of the Sustainability Toolkit ... 25
4.4 Verification, Validation and Testing of the Sustainability Toolkit ... 26
4.4.1 Verification of the Toolkit ... 27
4.4.2 Validation of the Toolkit ... 28
4.4.3 Testing of the Toolkit... 28
5 DEVELOPMENT OF SYSTEM-BASED TOOLKIT MODULES ... 30
5.1 Transportation and Logistics Modules... 31
5.1.1 Transportation and Logistics Modules Development ... 39
5.1.2 Verification, Validation and Testing of the Transportation and Logistics Modules ... 53
5.1.3 Capabilities and Limitations of the Transportation and Logistics Modules ... 55
5.1.4 Summary of the Transportation and Logistics Modules ... 56
5.2 Process with Emissions Module ... 57
5.2.1 Process with Emissions Module Development ... 61
5.2.2 Verification, Validation and Testing of the Process with Emissions Module ... 69
5.2.3 Process with Emissions Module Component for Injection Molding Process ... 70
5.2.4 Process with Emissions Module Component for Plastics Processing ... 74
5.2.5 Capabilities and Limitations of the Process with Emissions Module ... 78
5.2.6 Summary of the Process with Emissions Module... 79
5.3 Material Handling Modules ... 79
5.3.1 Material Handling Modules Development... 84
5.3.2 Verification, Validation and Testing of the Material Handling Modules ... 96
5.3.4 Summary of the Material Handling Modules ... 98
5.4 General Collection Modules ... 98
5.4.1 General Collection Modules Development ... 101
5.4.2 Verification, Validation and Testing of the General Collection Modules ... 111
5.4.3 Summary of the General Collection Modules ... 112
6 CONCLUSIONS & RECOMMENDATION FOR FUTURE RESEARCH ... 113
6.1 Conclusions ... 113
6.2 Recommendations for Future Research ... 114
REFERENCES ... 119
APPENDICES ... 127
Appendix A. ARENA Template Development for Transportation and Logistics Modules ... 127
A-1. Module Dialogue Interface ... 127
A-2. Module Logic Window ... 129
A-3. Module Underline Logic SIMAN Code ... 133
Appendix B. ARENA Template Development for Industrial Processes Module ... 136
B-1. Module Dialogue Interface ... 136
B-2. Module Logic Window ... 140
B-3. Module Underline Logic SIMAN Code ... 146
Appendix C. ARENA Template Development for Material Handling Modules... 150
C-1. Module Dialogue Interface ... 150
C-2. Module Logic Window ... 153
C-3. Module Underline Logic SIMAN Code ... 157
Appendix D. ARENA Template Development for General Collection Modules ... 159
D-1. Module Dialogue Interface ... 159
D-2. Module Logic Window ... 161
1 INTRODUCTION
Sustainability related issues, such as energy consumption, emissions and overall
environmental impact, have become increasingly important in business decisions. However,
traditional decision support tools such as simulation have primarily focused on the operational
aspects of industrial and service systems such as efficiency, productivity, and cost with little
attention given to the efficient analysis of environmental impact. A sustainability toolkit for
simulation modeling and analysis is needed to supplement the traditional system performance
measures with sustainability related system performance measures. This toolkit is intended to
contain a flexible framework to enable the modeling and analysis of sustainability-related factors
and performance measures. The toolkit should also be designed for ease of implementation, so
decision-makers can have sustainability performance measures as readily available as traditional
performance measures when making decisions.
Sustainability is commonly viewed as having three dimensions: the social dimension, the
economic dimension, and the environmental dimension (United Nations General Assembly,
2005). The social dimension mainly focuses on the human health and safety issues and also the
human relationship to nature. The economic dimension is a subfield of economics dealing with
the economic effects of sustainability issues. The environmental dimension studies how nature
and the environment (e.g. the ecosystem) changes and affects humans (see Figure 1-1).
Industrial and service businesses have grown extremely fast during the past century, and
productivity has often taken a higher priority in decision making than the environmental impacts
of a manufacturing or service system. As a cost, world energy consumption and waste generation
has increased dramatically. According to Energy Information Administration (2008), total
global demand for energy will increase by as much as 50 percent by 2025 (DOE, 2006). Waste,
including municipal solid waste, commercial waste and hazardous waste, has been generated and
emitted to the environment. U.S. Environmental Protection Agency reports that in 2007, there
was 254 million tons of municipal solid waste that was generated in United States, which is 4.62
pounds per person per day (EPA, 2008). The Energy Information Administration (2007) reports
that total U.S. carbon dioxide emissions in 2007 were 6,022 million metric tons, which increases
by 17% over that in 1990. Total U.S. methane emissions in 2007 were 700 million metric tons.
Both gases, known as greenhouse gases, are largely produced by industries such as energy
generation industry and manufacturing industry. Parallel to the increasing trends in energy
consumption and waste generation, the cost associated with the energy consumption and waste
disposal is increasing as well due to the limitation of overall available energy and land.
Figure 1 - 1: Three Dimensions of Sustainability
As a result, sustainability related issues have become increasingly important and
represent a necessary support component in decision-making. When evaluating a system
configuration, decision-makers should be able to examine the system not only from the
traditional performance measures such as productivity, efficiency and cost, but also take into
material selection in manufacturing systems or the fuel alternatives determination in
transportation systems are especially affected by the corresponding environmental impacts. The
efficient and effective analysis of sustainability related system performance measures is
2 PROBLEM STATEMENT
Simulation modeling is a tool which is used widely to model complex systems and
evaluate system performance, in order to help with decision making. Simulation has been proved
to be an efficient method in modeling industry and service systems where the experimentation
with real system configurations is costly (Law, 2007). Simulation modeling assists the decision
maker to analyze the system configuration without actually running the real system. Traditional
system performance measures in simulation consist of measures such as productivity, efficiency,
resource utilization, and cost. The current off-the-shelf simulation packages are so well designed
that most of the traditional performance statistics can be shown to the user as a part of the default
output report. With the trend of increasing energy cost and invention of environment friendly
resources, businesses are taking into account sustainability impact when analyzing system
configurations.
Currently there exist few simulation packages which are able to evaluate the
sustainability issues as a built-in integrated part of the simulation software. In order to model a
system with sustainability performance measures, more modeling effort and time is required than
modeling of traditional performance measures. The existing simulation tools have primarily
focused on the operational aspects of industrial and services systems with little attention given to
the sustainability impacts. This research intends to supplement the traditional performance
measures that are provided in current simulation packages with the system performance
measures that are environment focused. To address this issue, there is a need to develop a
simulation-based sustainability toolkit. The sustainability toolkit should have the capability of
evaluating the environmental impacts and collecting sustainability performance measures. Thus,
• Design a methodology for creating generalized modules for modeling and collecting
sustainability measures: The development methodology should cover the aspects
including selecting a study system, defining the sustainability performance measure,
defining the simulation state variable, determining the simulation events, and formulating
the mathematical and logical relationship in order to perform the collection of the
sustainability statistics.
• Identify systems and system components where the application of the sustainability toolkit
would have significant impact in decision-making: To develop such a sustainability
toolkit, the application areas of the toolkit are researched and identified. The toolkit is
developed and used for the specified systems of interest. The sustainability issues within
a particular system should be evaluated to determine if there is a need to develop such a
sustainability toolkit for the system.
• Implement and integrate the sustainability toolkit to off-the-shelf commercial simulation
software and produce a generalization of the toolkit: A target simulation package is
selected to implement the development of the sustainability toolkit. The objective of
developing the toolkit also includes providing the users with an easy-to-use
implementation of a flexible structure that allows for user-specified changes and updates.
Therefore, a generic sustainability toolkit needs to be produced which is application area
independent.
• Conduct verification, validation and testing of the sustainability toolkit: In order to
provide credibility and trust to the user to use the sustainability toolkit, the toolkit needs
to be verified, validated and tested to have the desired usage ability, which is to collect
measures as readily as other traditional system performance measures. The assumptions
made in developing the toolkit need to be documented and verified.
With the development and implementation of the simulation-based sustainability toolkit,
decision makers may be able to model and evaluate systems of interest for the environmental
impacts in a much easier way. The sustainability related performance measures, along with the
traditional performance measures, should be able to be returned to the user at the same time to
3 LITERATURE REVIEW
This chapter summarizes the current body of knowledge relevant to this research. Section
3.1 includes scientific research and results on sustainability issues and metrics. Section 3.2
introduces discrete-event simulation in general. Current simulation software comparison and
availability is discussed in section 3.3. The last portion of the chapter reviews some related
research work on simulation applied to sustainability.
3.1 Sustainability Related Issues and Measurements
Sustainability, as introduced in section 2, is a pattern of resources usage that “[meets] the
needs of the present without compromising the ability of future generations to meet their own
needs” defined by the World Commission on Environment and Development (United Nations
General Assembly, 1987). It contains three major dimensions. They are economic dimension,
social dimension and environmental dimension. This research is primarily focused on the
environmental dimension.
From a globe scale, the environmental dimension includes the elements such as
atmosphere, ocean, water, land and forest. The main sustainability related issues in atmosphere
system are the air pollution. The pollutants of sulphur oxides cause the acid rain. Particulate
matters produce the photochemical smog. The chlorofluorocarbons (CFCs) degrade the ozone
layer and the increasing generation of greenhouse gases, including carbon dioxide and methane,
is very likely to have caused most of the increases in global average temperature since the
mid-20th century (IPCC, 2007). Sustainability issues in the ocean system are primarily focused on
over-fishing. The lost of forests due to human use is also significant. World Resources Institute
quarter of the world’s ice-free land (WRI, 1998). During the 20th century, the freshwater
ecosystems are declining even faster than marine or land ecosystems (Hoekstra, 2006).
In order to quantify the sustainability-oriented performance of human activities, the
sustainability metrics have to be identified and established. There exist a vast number of methods
and approaches to define the sustainability measures, indicators and metrics. Some research
approaches from the ecosystems’ perspective and studies the input and output balance of nature.
Because markets are not providing the price of many ecosystem services, Costanza et al. (1997)
estimate the economic value of 17 ecosystem services, including the gas regulation ecosystem,
climate regulation ecosystem, water regulation ecosystem, waste treatment ecosystem, etc., and
evaluate the estimated minimum value of the entire biosphere ecosystem to be in the range of
US$16 – 54 trillion per year. Zhang et al. (2006) conduct and employ a metabolism model and a
harmonious development model, to measure and evaluate the sustainability level in the complex
urban ecosystem (CUE) for several major cities in China. Ecological footprint, as a popular
sustainability measurement, is a method that estimates the necessary biologically productive area
to meet the human demand (Holmberg et al., 1999).
Life cycle assessment (LCA) is a method to measure and evaluate the environmental
impact of a given product or service over its entire life span (Curran, 1996). LCA provides an
overall framework and numerous studies have been done to develop methods for LCA since
1960s (Matthews et al., 2002). Matthews et al. (2002) analyze the connections between the risk
analysis (RA) and LCA and present several methods for incorporating risk analysis into LCA.
Hendrickson et al. (2006) introduce another approach, the economic input-output life cycle
assessment approach (EIO-LCA), to provide the environmental impact from an aggregate view
Other sustainability measures are studied within a particular industrial system or process.
Martins et al. (2007) propose four sustainability metrics, including material intensity, energy
intensity, potential chemical risk, and potential environmental impact, to the chemical processes.
Jeon and Amekudzi (2005) review and characterize the sustainability measures in transportation
systems. In their paper, system effectiveness and efficiency, and the impacts of the system on the
natural environment are the two most used measures in transportation systems. Malherbe and
Mandin (2007) study the health-risk assessment for volatile organic compounds (VOC)
emissions during outdoor ship painting.
3.2 Discrete-Event Simulation Overview
Simulation techniques have been widely used in industry and research areas during the
last two decades. The application areas where simulation has been found as a powerful tool
include manufacturing systems (e.g. semiconductor manufacturing), inventory systems,
computer network application, military applications, logistics and transportation systems,
financial decisions and business process and service organizations (e.g. emergency department in
hospitals). Recently, simulation techniques have been applied to construction engineering,
project management and supply chain management areas. In general, simulation is used to model
a complex system numerically where no analytic solution current exists (Law, 2007).
In real-life practice, numerous systems are described as an objective or a discrete set of
objectives moving from point to point with one movement at a time, which is referred as the
transaction-flow world view (Schriber and Brunner, 2008). In those cases, systems change or
update only at some particular time within a discrete set of time points. Discrete-event simulation
is used to model such a system. In this section, the general mechanism of modeling using
3.2.1 Discrete-Event Simulation Components
The crucial components in the discrete-event simulation include entities, system states,
resources, operations and events. To demonstrate the definition of these components, it is
assumed that a system with a single server providing the services to the incoming customer is
studied. Using the transaction-flow world view, the moving objective in this system is a
customer. A customer moves from point to point which includes arriving at the system,
requesting the server, capturing the server, releasing the server, and leaving. Entity designates a
unit of the moving objective, a customer in this case. System states, or system state variables, are
measurements and indicators of the operation to describe the system at any simulation time.
System states can vary for different purposes of study. In the single service example, the system
state is defined as the total number of customers in the system. Resources describe such
modeling components that provide service to the entity. Thus, the server is the resource in the
demonstration example. Operations are the steps carried out by the entity, including arriving,
requesting, capturing, releasing and leaving in this case. Further, events are those operations, the
occurrence of which changes the system states instantaneously. Since the arriving operation of a
customer causes the total number of customers in system to increase by one unit, and the leaving
operation causes it to decrease by one, these two operations are events. Thus, in discrete-event
simulation, system states are updated by and only by the occurrence of events which are
performed by entities, at a discrete set of time points (Law, 2007).
3.2.2 Discrete-Event Simulation Execution
The execution of discrete-event simulation is formed by its nature. Entities take actions
by moving to an operation point in the transaction-flow world view (e.g. customer arrives at the
time-points, the simulation model “freezes” the current simulation time and starts to process the
entities’ movements. This phase where entities accomplish the scheduled movements is
introduced by Schriber and Brunner (1998) as entity movement phase (EMP).
During the entity movement phase, if multiple entities have scheduled movements at the
same simulation time point, they all move immediately at no real time. However, the process
order for those entities in simulation time depends on the modeling system (e.g. the capturing
service movement of the next customer happens the same time as the leaving movement of the
current customer, but the current one has to leave first). The current moving entity (real time) is
referred as active state entity and stored in the active-entity list. There is always only one entity
in the active-entity list. Other entities, which are scheduled to move at the same simulation time,
are stored in the current events list waiting to enter the active-entity list. These entities are in
ready state. Thus, during the entity movement phase, the entity in the active-entity list is
processed first, and next entity from the current events list transfers to the active-entity list. The
phase continues until all the entities in the current events list are processed.
Entities take actions and change the system states during the entity movement phase.
Then, the system stays stable and unchanging until the next event occurs. In order to model the
system as simulation time passing by, the general execution is to advance the simulation time to
the next earliest event and skip the time in between. This time-advance mechanism is known as
next-event time advance approach (Law, 2007). And this phase in simulation modeling is
introduced by Schriber and Brunner (1998) as clock update phase (CUP).
To demonstrate the mechanism during the clock update phase, several entity states and
entity lists are first introduced. Entities are delayed in a simulation model, either for a given
are in the time-delayed state. In the later case, entities are in the condition-delayed state. The
main difference between these two delay states is that the delay time is known for entities in
delayed state and is undetermined for entities in condition-delayed state. Entities in
time-delayed state are stored in the future events list. The list is unique. Entities stored in the future
events list have their own known moving time in the future. Entities are ordered from top to
bottom in such a way that their moving time is increasing. Entities in condition-delayed state are
stored in the delay list. A simulation model contains one or multiple potential delay lists. Each
one of the delay lists corresponds to one particular condition. During the clock update phase,
simulation system checks the future events list and delay list. If the entities in the corresponding
delay list are scheduled to move, either their moving time is reached or their specified conditions
are resolved, they will be transferred into current events list.
After completing the CUP, simulation system enters EMP to process the current event
list. The loop between EMP and CUP continues until the ending simulation condition appears.
To summarize how discrete-event simulation models execute, the steps in the two main phases
are listed as follows. The entity movement phase includes the tasks:
• Accomplish all current events in the current events list;
• Update the system states, system performance measures;
• Update the future events list and delay lists;
• Go to clock update phase if the simulation does not end.
The clock update phase consists of:
• Move the simulation clock to the next earliest event time;
• Update the current events list by removing the entities from the future events list and
• Go to entity movement phase if the simulation does not end.
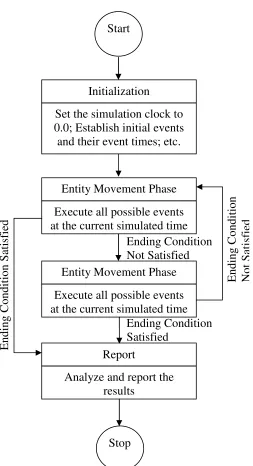
Figure 3-1 shows the flow chart of the execution in a single simulation run (Schriber and
Brunner, 1998).
Figure 3 - 1: Simulation Execution of a Single Replication (Schriber and Brunner, 1998) Start
Initialization
Set the simulation clock to 0.0; Establish initial events and their event times; etc.
Entity Movement Phase
Execute all possible events at the current simulated time
Entity Movement Phase
Execute all possible events at the current simulated time
Report
3.2 Simulation Software
These exists a vast amount of software that is available for discrete-event simulation,
which serves for the commercial purpose and the research purpose as well. According to the
biennial survey of discrete-event simulation software in 2007 conducted by INFORMS, there are
more than forty tools for discrete-event simulation (Swain, 2007).
The current simulation software is categorized into two major groups. They are
general-purpose simulation software, and application-oriented simulation software. The general-general-purpose
simulation software is able to solve various discrete-event simulation systems. The
application-oriented simulation software is used for one particular type of system, including manufacturing
system, supply chain system, process reengineering system, contact center system, health care
system and animation (Law, 2007 and Banks, 1998). Some of the commonly used
general-purpose simulation software includes ARENA (Rockwell, 2005 and Kelton et al., 2006), Extend
(Imagine That, 2006), and GPSS/H (Henriksen and Crain, 1998).
In the application-oriented simulation software category, AutoMod, ProModel and
WITNESS are used for manufacturing system. ProcessModel and SIMPROCESS are designed to
model process reengineering system. MedModel is a simulation tool that is used in health care
area. Proof Animation serves as a general-purpose animation package, although most simulation
animators are integrated into its software.
3.3 Simulation Applied to Sustainability
Given the increased focuses on sustainability, simulation modeling has been used in the
recent research to analyze systems of interest while taking into account of the environmental
impacts. From a systems perspective, Kurkovsky (2004) analyzes the indictors of sustainability,
three different regions, including Japan, Germany and USA. In addition to the three major
simulation models, Kurkovsky also proposes a problem-based simulation methodology for
regional sustainable development assessment.
Simulation techniques have been applied to particular systems for solving the
sustainability issues. Blanco et al. (2005) have applied simulation to forest management by
introducing a process-based simulation model to evaluate temporal changes in ecosystem
nutrient dynamics of managed and non-managed forest stands. Ruwanpura et al. (2003) propose
a simulation model to determine solid waste that is generated at a construction site. The paper
also provides a protocol of using the simulation results to help with the planning of construction
projects. Halima and Srinivasan (2008) develop a simulation-optimization framework to identify
and evaluate sustainable alternatives for batch processes. The simulation-optimization approach
contains a process simulation model and a multi-objective stochastic optimization method. The
waste generation due to specific system variables levels is simulated and integrated with the
optimization method. Yu et al. (2009) develop an agent based simulation model to help in
decision-making for Hawaii’s longline fishery activities. In addition, simulation models are used
in the context of logistics and transportation related to sustainability. Cortes et al. (2008) utilize
simulation to estimate energy consumption and emissions for transportation networks in urban
and rural areas over time horizons on the order of 10 years. Barth and Todd (1999) analyze the
shared vehicle systems and their resulting emissions using a simulation model. Likewise, Lee
(2000) constructs a dynamic network model to study the impact of traffic flow control on carbon
dioxide emissions of passenger cars. In each of these cases, specialized models are designed for a
specific purpose requiring significant time and effort. Simulation models are also used in
measurements for designing manufacturing systems. Energy efficiency and CO2 emissions are
the two main environmental impacts they consider in the paper. They integrate the evaluation of
these two measures into factory simulation software.
Wohlgemuth et al. (2006a) develop the software Milan which combines the
discrete-event simulation and material flow analysis together. They propose a component-based approach
for integrating the two methods and develop the plug-ins under Milan framework. Some of the
plug-ins are developed for simulation purposes including random variates generation, event list
management, etc., which are used for modeling the industrial process and material usage. The
results obtained from the simulation-based plug-ins are analyzed by the components that are built
for material flow analysis, which intends to evaluate the sustainability aspects of energy and
material flows in production processes (e.g. material consumption, emission generation). The
advantage of the approach is integrating modeling an industrial system and analyzing its
environmental impacts together in one single model. However, the work is mainly focusing on
the coding of the plug-ins for discrete event simulation and the administration of an existing
material flow analysis tool Umberto, while little attention is given to research and evaluate the
sustainable aspects and environmental impact measures for the systems under study.
Wohlgemuth et al. (2006b) apply the material-flow simulator Milan to evaluate the economic
and ecological aspects of inventory management strategies. The customized simulator
components permit reusability and flexibility for modeling complex inventory system
configuration. However, in the paper, the environmental indicators used to evaluate the
emissions impact (e.g. CO2 generation) are not directly set up to be the actual amount of
emissions generated. The paper chooses indirect indicators, such as the amount of deliveries and
The current literature in simulation-based sustainability tools development is limited.
There is a need to develop a flexible framework for efficiently modeling and analyzing systems
that require environmental performance evaluation, in addition to performance measures that are
4 RESEARCH SCOPE AND METHODOLOGY
When using simulation for modeling and analyzing system performance, traditional
performance measures, such as productivity and efficiency, are frequently used. Some of the
commonly used performance measures, such as processing time, time in system, and resource
utilization, are built-in for most of the simulation platforms. This research intends to supplement
the traditional performance measures with the environmental focused measures and make the
collection of the environmental measures as easily as other traditional performance measures. A
simulation-based sustainability toolkit will be developed for this purpose. In this section, we
introduce the scope of the research, as well as the general research strategy.
For the three aspects of sustainability, social, economic and environmental aspect, the
long term research plan is to design a sustainability toolkit (or a set of toolkits) that takes an
integrative systems approach to modeling problems from all three fields. This thesis paper
focuses primarily on the environmental aspect of sustainability. Compared to the other two
aspects of sustainability, the environmental aspect studies more immediate impacts of the
sustainability issues. For instance, the amount of air pollution emitted into the air is the first
direct outcome of an industrial process. The environmental aspects of systems have been studied
and literature exists for many applications for determining and measuring environmental
impacts. In the future, it is hoped that the sustainability toolkit can be extended to also aim in
decision making related to the social and economic aspects of sustainability, and include the
measurements for human health and economic impact.
In order to quantitatively measure the environmental impacts, studies have been carried
out to obtain the metrics of the environmental impacts. Some of the metrics to quantitatively
metrics and process oriented metrics. Of these, discrete-event simulation modeling is well suited
for studying the process oriented metrics within a dynamic system. Therefore, the process
oriented metrics for sustainability will be the focus of the development of the simulation toolkit.
In order to design and develop such a sustainability toolkit, a general research strategy is
developed. The following research steps explain the research strategy.
• Develop a sustainability toolkit development methodology: The methodology answers the
question: given a selected system/process, how to develop a sustainability toolkit for the
system/process of interest. Simulation state variables and simulation events are
indentified. Mathematical relationships are defined. The development methodology is
used throughout this research.
• Identify application areas of the sustainability toolkit: Since the scope of this research is
to apply process oriented sustainability metrics to develop simulation based sustainability
toolkit, the potential systems/processes are identified where the toolkit can be useful. This
research develops the toolkit based on the systems/processes selected.
• Implement the development of the sustainability toolkit: After applying the development
methodology to a selected system/process, the sustainability toolkit needs to be
implemented and constructed in a simulation software platform.
• Perform verification, validation and testing of the sustainability toolkit: After the toolkit
is implemented in a simulation platform, the verification, validation and testing of the
toolkit will be carried out in order to evaluate the capabilities and limitations of the
toolkit.
4.1 Sustainability Toolkit Development Methodology
To develop such a sustainability toolkit in general and provide the environmental
measures, a toolkit development methodology is designed. The methodology consists of the
following steps:
1. Define the system to be studied;
2. Define sustainability performance measures;
3. Define simulation state variable;
4. Determine simulation events;
5. Formulate mathematical, statistical, and logical relationships among the state variables;
and
6. Toolkit implementation.
In particular, the details of the toolkit development methodology include the following. In
step 1, in order to construct and use such a simulation-based toolkit, a system or process is first
selected to study. The system or process under study has environment-related issues that need to
be addressed and analyzed to help in decision-making.
The second step identifies the sustainability factors for the selected system. System
factors that cause the environmental impacts are identified. For instance, an ocean fishing system
may have the potential over-fishing as a sustainability factor with an environmental impact,
while a manufacturing system may have concerns about the energy consumption and waste and
emissions generation. Step 2 answers the ‘what’ and ‘why’, which are ‘what environmental
statistics are people interested in collecting and why are they important’. The following steps
Step 3 of the methodology involves determining simulation state variables to describe the
sustainability factors and environmental impact measures in the corresponding system. In
discrete-event simulation, system state variables are the indictors of system performances. For
instance, traditional system states variables may include work in process, flow time, and waiting
number in queue, etc. In terms of sustainability factors, system states variables, which represent
quantitatively for the environmental performance, differ from other traditional state variables and
are defined separately in this step.
Step 4 involves identifying the sustainability factors and environmental impact
performance measures for the selected system. Events in the system are the occurrences that
change the corresponding traditional or sustainable system state variables. Thus, the
methodology analyzes the system to indentify each event that initializes or updates the
environmental impacts. Since discrete-simulation is used, the changes to the state variables occur
upon the instantaneous occurrence of simulation events. For the sustainability measures such as
emissions which occur continuously over time, it is assumed, modeling in discrete-event
simulation, that emission quantity between the occurrences of events can be represented as a
function of time, a probability distribution or a stochastic process.
Once the system state variables and the events that cause the changes to the state
variables are identified, step 5 in the methodology is answering how the environmental impacts
are measured quantitatively. The relationship is formulated mathematically and logically. There
exist a number of published scientific studies which contains this information, including papers
and some open resources such as U.S. Environmental Protection Agency (EPA). This step also
includes translating the relationship, whether it is mathematical formulations or logical
In the last step, the system state variables, the simulation events, and the mathematical
and logical relationships are integrated into a sustainability toolkit which can be used directly for
evaluating the sustainability performance. The implementation of the toolkit is discussed in
section 4.3.
A general methodology for developing a sustainability toolkit is introduced in this section.
The methodology describes certain steps to take to construct the toolkit for a system of interest.
The methodology is used throughout this research to develop the sustainability toolkit.
4.2 Application Areas of the Sustainability Toolkit
Environmental sustainability issues appear in many areas. This research focuses on
common industrial systems or system components where there is a need to analyze the
environmental issues. In the selected systems, further study is performed in order to identify
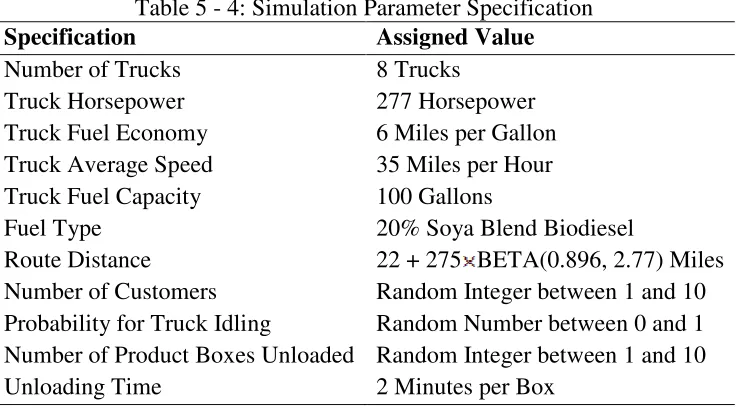
what are the environmental factors and how to represent them. Table 4-1 displays a list of
potential systems and system components, as well as the environmental impacts for each of the
systems. This research designs the sustainability toolkit to analyze environmental performance
measures for the systems in Table 4-1. Details of the toolkit representing each of the systems are
fully discussed in section 5.
Logistics and transportation systems are systems dealing with distribution. Given the
customers’ need, logistics and transportation systems are set up in order to try to meet a certain
customer service level in the most efficient way. Simulation has been used to model the
distribution models such as dock operations (Banks, 1998). Since logistics and transportation
systems contain transportation sources such as vehicles, trucks, ships and airplanes, the
associated environmental impacts are mainly arising in fuel consumption and air pollution
(GHG), is becoming a worldwide environmental issue. Based on the report from EPA,
transportation section is the fastest-growing section of GHGs in U.S., accounting for 47 percent
of the net increase in total U.S. emissions since 1990 (EPA, 2006). Other air pollutions may also
include carbon emissions (such as CO), nitrogen oxides emissions (such as NO2) and total
hydrocarbon (THC). As a result, evaluating the emissions generated in a logistics and
transportation system, especially from running the transportation vehicles, is useful to help in
decision-making such as determining the route assignments. A toolkit that deals with the
collection of the emissions specifically is preferred when constructing the simulation model.
Section 5.1 introduces the sustainability toolkit modules that are constructed for logistics and
transportation systems.
Table 4 - 1: Systems and System Components applied to the Sustainability Toolkit
Systems and System Components Environmental Issues and Impacts Transportation and Logistics System • Fuel Consumption
• Air Pollution Generation
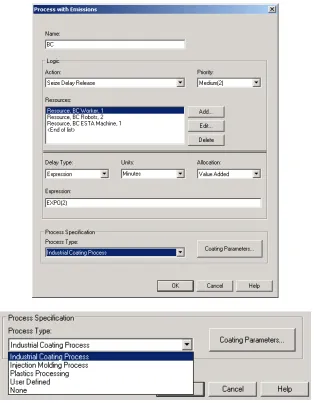
Industrial and Manufacturing Processes
→Industrial Coating Process • Paint and Solvent Consumption • Volatile Organic Compound (VOC)
Generation
→Injection Molding Process • Energy Consumption
• Emissions and Wastes Generation
→Plastics Processing • Energy Consumption
• Water Usage
• Emissions and Wastes Generation
Using simulation as a tool to evaluate industrial and manufacturing systems has a long
history and simulation is ranked number two for the most widely used techniques in industry
(Law, 2007). However, traditional system performance measures in manufacturing systems
include productivity, efficiency and cost but not much sustainability-related attention is given.
Systems are mainly studied in order to increase the throughput, decrease the lead time and
increase the utilizations of recourses (e.g. machines, workers). Traditional system performance
analysis using simulation includes throughput analysis, time-in-system analysis and bottleneck
analysis. Sustainability related issues, which mainly contain the raw material consumption,
energy consumption and waste and emission generation, are becoming a part for decision support
and thus require the sustainability toolkit to evaluate the environmental impacts within the
manufacturing system. For instance, semiconductor manufacturing is a very complex process
and involves in many environmental related issues such as the generation of air toxins or
hazardous air pollutants (HAPs), water usage, waste water generation, chemical material usage,
and chemical waste generation. Table 4-1 lists some industrial processes under study including
industrial coating process, injection molding process and plastics processing. The paint spray
process in a manufacturing system generates the indoor air pollution such as volatile organic
compounds (VOCs). VOCs are organic chemical compounds which have significant vapor
pressure (0.01 kPa or more). The emitted VOCs lead directly to damage the environment and
human health (Rentz et al., 2002). The injection molding process and plastics processing also
generate air pollutions such as CO2 and SO2, known to cause acid rain. Energy consumption is
another sustainable issue appearing in both systems. Section 5.2 introduces a toolkit module
The distribution warehouse plays a crucial role of developing efficient and low-cost
operations. Material handling equipment, such as automatic guided vehicle (AGV) and forklift,
is often used for transporting materials such as raw materials, work in process products and
finished products. Vehicles generate air emissions, and require battery charging while they are
working. Hence, the potential environmental impacts include evaluating the emissions generated
and the energy consumption for using batteries. In 2007, EPA estimates that forklift operations
generate 297,973 tons of nitrogen oxides (NOx), 64,892 tons of hydrocarbon (HC) and 1,357,677
tons of carbon monoxide (CO), which shows that forklift operations is a large contributor to the
air pollutions. Section 5.3 introduces a set of toolkit modules that can model and analyze
emissions generated from a warehouse material handling system.
In Table 4-1, sustainability toolkit and modules can be developed for each of the systems
separately. A system-independent toolkit generalization approach features a general
sustainability toolkit that can be utilized to various systems to collect environmental performance
measures. Commonly used logic and statistical flow among the system-dependent sustainability
toolkits will be identified and studied. Section 5.4 introduces a general toolkit which can be
applied to all kinds of systems to collect user-defined sustainability performance measures.
4.3 Development and Implementation of the Sustainability Toolkit
After the system is selected, toolkit development methodology is applied to the studied
system. The environmental performance measures and the state variables are defined, the
simulation events are identified and the mathematical relationships are established. The toolkit is
then implemented in simulation software platform. Various simulation packages have different
levels of flexibility. Appropriately chosen simulation software can reduce the simulation time,
In this research, ARENA simulation software by Rockwell Automation Technologies is
used for the implementation of developing the sustainability toolkit. The ARENA simulation
software has been selected because of the following characteristics:
• General-purpose simulation software: This research intends to evaluate and develop the
sustainability toolkit for various systems of interest including but not limited to the
systems listed in Table 4-1. Therefore, compared to application-oriented simulation,
general-purpose simulation software is chosen to implement the sustainability toolkit
development because it can be used to model various systems of interest. ARENA is one
of the widely used general-purpose simulation packages.
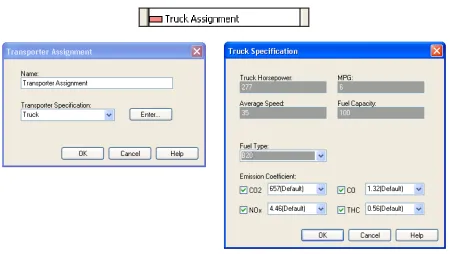
• Ability for the user to create user-specified template: ARENA has its own template
development tools built into the software itself, which allows the users to create their own
templates and modules. It provides the flexibility of designing a separate sustainability
template. The modules in the sustainability template, which perform the collections of
sustainability performance measures, can be used along with other default traditional
modules in a drag-and-drop manner to model a system.
4.4 Verification, Validation and Testing of the Sustainability Toolkit
In order to make the sustainability toolkit creditable and trustable to the user, the toolkit
needs to be verified, validated and tested for usage. The following steps are carried out first, and
then the verification, validation and testing of the toolkit are performed.
1) Set up System Configuration. In the selected system of study, define a system
configuration in order to be modeled. The system configuration should be set up and specified in
2) Construct Original Simulation Model. Construct a simulation model using the
system configuration specified. Use necessary information including the logical relationship, the
mathematical relationship and the statistical relationship to collect the desired environmental
performance measures.
3) Reconstruct Simulation Model using the Sustainability Toolkit. After the toolkit
is built using the development methodology, the system is remodeled using the toolkit. The
system configuration is kept the same as for the original simulation model.
4.4.1 Verification of the Toolkit
Verification of the sustainability toolkit contains two parts. One part is performing the
verification of the simulation model using the toolkit. It determines whether the conceptual
system model has been translated into a correctly working computer program. The other part of
the verification of the toolkit is determining whether the methodology of developing such a
toolkit has been successfully translated into a computer program.
The verification of the simulation models have several approaches which are to:
Debug the simulation models, one of which does not use the sustainability toolkit
and the one does use the toolkit;
Present a structured walk-through of the simulation programs;
Observe the animation of the simulation to determine whether it is reasonable; and
Check model results for reasonableness.
The verification of the sustainability toolkit itself cannot be separated from the
verification of the simulation model using the toolkit. However, the toolkit verification should
contain the following additional steps which are to:
Check the toolkit compatibility with the models using the toolkit; and
Examine the toolkit for returning the desired sustainability performance measures.
4.4.2 Validation of the Toolkit
In general, validation of a simulation model examines whether the model behaves close
enough to the real system. It is the process of determining whether a simulation model is an
accurate representation of the system under study (Law, 2007).
Since the simulation model is only an approximation of the system, the validity increases
as more details are provided by the system. This research focuses on the development of the
sustainability toolkit, the mathematical relationships used in developing the toolkit is obtained
from other research and study. Therefore, the validation of the toolkit is conducted against the
referenced scientific papers. The validation of the toolkit should include the following aspects:
Use the literature which contains as much information as possible of the
environmental impact measures and relationships;
Document the assumptions made when obtaining the relationship and building the
toolkit;
Review and evaluate the assumptions; and
Compare the results from the simulation model with the corresponding results
obtained from the chosen scientific studies, or historical data.
4.4.3 Testing of the Toolkit
Once the sustainability toolkit has been developed and implemented, the testing of the
toolkit needs to be performed in order to make sure that using the toolkit will not change the
performance measures as readily as traditional performance measures. The toolkit will not affect
the simulation modeling from the operational point of view.
Therefore, the testing of the toolkit mainly is to compare the results from running the
simulation model without the toolkit and the one using the toolkit. No statistical differences
should be found on the mean value of the obtained performance measures when running the two
5 DEVELOPMENT OF SYSTEM-BASED TOOLKIT MODULES
In this section, the development and the implementation of the sustainability toolkit is
applied to systems including logistics and transportation system, industrial processes system, and
warehouse material handling system. Section 5.1, 5.2 and 5.3 describe how the sustainability
toolkit is constructed for each of the three systems. Section 5.4 describes the design of a general
toolkit which is applicable to the systems under study. The main objectives of the toolkit are:
• Toolkit collects desired sustainability-related statistics. This is the main functionality that
the toolkit provides.
• Toolkit has a user-friendly interface where the user can input parameters easily. The
toolkit is displayed to the user through one or multiple interfaces. The interface is
constructed using elements such as text boxes, drop-down menus and commands which
are very user-friendly. The interface increases the easy for using the toolkit.
• Toolkit is integrated into platform simulation package and can be easily used in the
simulation package. The toolkit is implemented in the target simulation software and it is
used in the same manner along with other modules of the platform simulation package.
• Toolkit reports the collected sustainability-related statistics as readily as traditional
statistics. By default, the traditional performance measures such as productivity and
efficiency are reported automatically at the end of the simulation. The sustainability
toolkit developed is able to also report the collected sustainability-related statistics
automatically at the end of the simulation, along with other traditional statistics.
• The general toolkit modules can model various systems with user-defined sustainability
unique toolkit with the ability to analyze the environmental measures in all kinds of
systems.
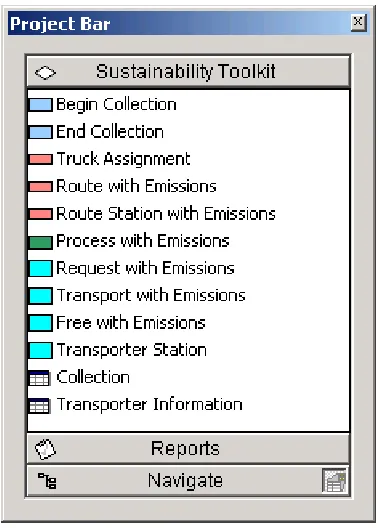
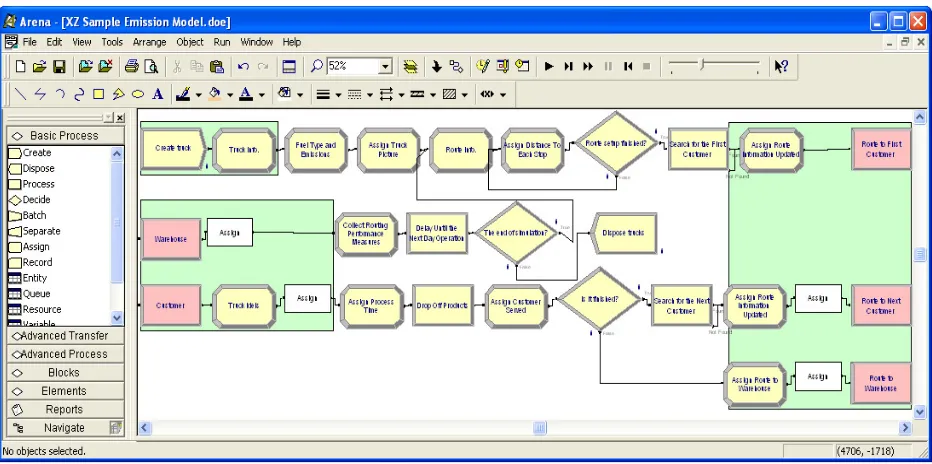
Figure 5-1 depicts the ARENA template that is created representing the sustainability
toolkit. The modules created in this template are applied to the listed systems and processes. The
modules are also used in conjunction with the other default templates and modules to conduct
[image:37.612.212.401.236.500.2]simulation modeling.
Figure 5 - 1: Overview of the Developed Sustainability Toolkit
5.1 Transportation and Logistics Modules
Transportation and logistics systems are selected to be modeled because of their frequent
application in simulation modeling. Transportation and logistics system often result in massive
air emissions and energy usage, which makes it a potential candidate for utilizing the
sustainability toolkit to aid in decision-making considering the environmental impacts within the
logistics systems is introduced. Since then, more flexible versions of the modules have been
developed. The details of the development are provided here for completeness.
To demonstrate the toolkit development methodology, the methodology is applied to
typical logistics and transportation systems. In particular, the environmental factors and
performance measures for the transportation system are identified, system state variables are
determined to represent the factors and the measurements, system events that change the system
state variables are specified and the mathematical relationship for the environmental factors and
the system state variables is established and updated at the occurrence of each event. An
implementation of the toolkit development for a particular transportation problem is then
conducted. To illustrate the application of the toolkit, a simulation model is constructed for the
following transportation system example.
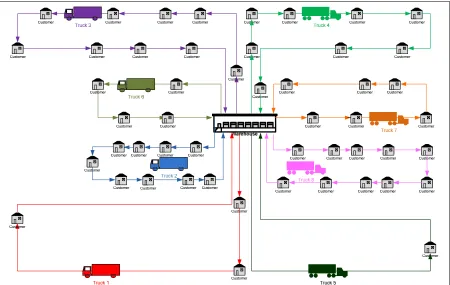
Example 5-1: Suppose a company has a centralized warehouse facility from which it
makes deliveries to customers on a daily basis. The company currently has delivery trucks that
consume diesel fuel. Each day routes are assigned to trucks. The route may consist of a variable
number of delivery stops at customers and variable route distances that can each be represented
by a probability distribution. The company is currently in a position where it needs replacing
part of its fleet of trucks. The company wants to determine the number and type of trucks to
purchase (e.g. capacity, type of fuel, and engine power) while taking into account the energy
consumption and emissions in addition to traditional system performance measures such as cost
Figure 5 - 2: Diagram of a Sample Instance of Truck Routings
This example depicts a system where simulation could be an appropriate tool to evaluate
various system configurations in order to make a good decision. The prototype toolkit developed
in this section allows the user to evaluate the system using traditional system performance
measures such as routing time, routing distance and customers served, as well as sustainability
performance measures.
The general simulation-based sustainability toolkit development methodology is applied
to the stated logistics and transportation system. Each of the steps in the methodology is
considered and analyzed for the logistics and transportation system. The following sections
describe the detailed development steps.
Select the system. Light trucks contain pick-ups, minivans, SUVs, and vans. Medium
and heavy trucks are commonly used trucks for logistics and transportation companies (Davis et
consume diesel fuel in United States. According to Davis’s report, in 2006 a total amount of
4,649 trillion Btu energy is consumed by medium and heavy trucks using diesel, which is more
than 75% of the overall energy consumed in both highway and nonhighway transportation
system. The burning of diesel fuel generates gaseous residues. As reported in U.S. Carbon
Dioxide Emissions (EIA, 2009), diesel fuel accounts for 23.2% of the transportation sector’s CO2
emissions in 2008, while transportation sector CO2 emissions have risen by 21.1% since 1990.
Identify the environmental performance measures. As the energy consumption and
emissions generation issues becoming increasingly important, the main sustainability aspects in
the logistics and transportation system include the fuel consumption, as well as the air pollution
emitted by operating the trucks. These two factors are both quantitative factors. Therefore, the
performance measure for the fuel consumption is measured by the usage of the fuel for each of
the delivery trucks. The air pollution emitted by operating a truck, depending on the different
types of emissions that the user is interested in analyzing (e.g. carbon monoxide, carbon
dioxide), is also collected by each of the trucks during one particular trip. The sustainability
concern of modeling the transportation problem is to evaluate the amount of fuel consumed and
the amount of emissions generated.
Define simulation state variables. Two assumptions of the transportation system are
made including the following:
1. Truck is travelling at the average speed; and
2. Emissions generated per unit of time are the same regardless of the truck status
(travelling or idling).
In order to represent the system performance measures including the traditional
variables are specified and defined separately. Table 5-1 lists the system’s parameters used in the
logistics and transportation system.
Traditional system performance measures usually include the system productivity and
efficiency. In a typical transportation problem, the delivery transporter (e.g. truck) moves to its
destination (e.g. customer), makes a stop, and moves to the next destination. The productivity
measures are then represented by the total number of stops (STruck) made by each truck in a route.
The efficiency measures are focused primarily on the transportation phase in the system. Since
truck represents the delivering equipment, the efficiency measures consist of the travel distance
and the travel time of the trucks. Accordingly, the state variable that represents travel distance is
the total route distance of each truck (DTruck) and the state variable that represents travel time is
the total route time of each truck (TTruck). Additionally, corresponding state variables are set up as
the total stops made in the system (TSSystem), total route distance in the system (TDSystem) and total
route time in the system (TTSystem).
The environmental impacts, including fuel consumption and emissions generation, are
specified as the sustainability performance measures. Thus, two sets of simulation state variables
need to be established. Fuel type (Z) is used by the delivering truck, the environmental impact of
fuel consumption is measured in the total amount of fuel used by each truck (FZ,Truck). If the user
is interested in knowing the emission type (Y) that has been generated by the delivering truck,
the environmental impact of emissions generation is measured in the total amount of emission
emitted by each truck (EY,Truck). Parallel to the traditional performance measures, system fuel
consumed of the chosen fuel type (TFZ,System) and system emission generated of a particular
emission type (TEY,System), are used as the system level measurements among all delivering
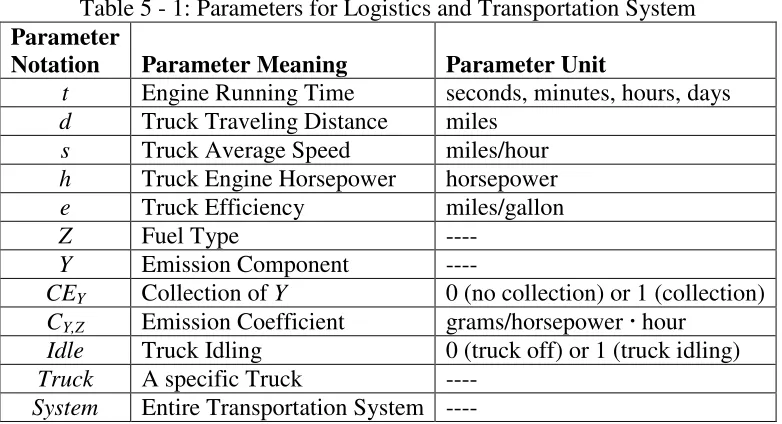
Table 5 - 1: Parameters for Logistics and Transportation System Parameter
Notation Parameter Meaning Parameter Unit
t Engine Running Time seconds, minutes, hours, days d Truck Traveling Distance miles
s Truck Average Speed miles/hour h Truck Engine Horsepower horsepower
e Truck Efficiency miles/gallon
Z Fuel Type ----
Y Emission Component ----
CEY Collection of Y 0 (no collection) or 1 (collection) CY,Z Emission Coefficient grams/horsepower ·hour
Idle Truck Idling 0 (truck off) or 1 (truck idling) Truck A specific Truck ----
[image:42.612.112.503.75.287.2]System Entire Transportation System ----
Table 5 - 2: State Variables for Logistics and Transportation System State Variable
Notation State Variable Definition
State Variable Unit
STruck Total Number of Stops made by Truck count DTruck Total Route Distance traveled by Truck miles
TTruck Total Route Time by Truck hours
TSSystem Total Number of Stops made by System count TDSystem Total Route Distance traveled by System miles
TTSystem Total Route Time by System hours
FZ,Truck Total Fuel Z Consumed by Truck gallons EY,Truck Total Emission Y Generated by Truck grams TFZ,System Total Fuel Z Consumed by System gallons TEY,System Total Emission Y Generated by System grams
Determine the simulation events. To model the system, the primary source of energy
consumption and emissions, in the stated logistics and transportation problem, are caused by the
trucks. The general performance measures such as routing information and stops made are
reflected by trucks as well. Thus, a truck represents an entity in the simulation model, which
flows though the system and controls the delivery process.
The simulation model consists of three types of events, the creation of the truck entity,
the arrival of a truck at a stop and the departure of a truck from a stop. The creation of trucks