Copyright
Biomedical Integrated Circuit Design
for
An Electro-Therapy Device
A Thesis Presented in Partial Fulfilment of The Requirements for The Degree of
Doctor of Philosophy
in
Electronics and Computer Engineering (Bioelectronics)
at
School of Engineering and Advanced Technology Massey University, Albany Campus, New Zealand
by
Ibtisam Abbas
Full name(Ibtisam A. Abbas Al-Darkazly)
ii
In the name of God
Most Gracious, Most Merciful
Dedication
To my parents, whose boundless love and belief in me, from the core of my being, empowered me to be the woman that I am.
To my lovely children and to my talented kids, Zain, Taim and Yoseph, whom are the light in my life.
iii
Abstract
A biomedical integrated circuit design (IC) is utilized for the development of a novel non-invasive electro-therapy device, for low frequency multi-channel biomedical stimulation to transform immune activity and induce anti-viral state. Biomedical integrated circuit design is an important branch of modern electronic engineering that uses the application of electronic engineering principles for biomedical disciplines, to develop bioelectronics devices that are implanted within the body and for non-invasive devices to improve patient’s lives. These devices use the application of an electric field to stimulate reactions to restore normal cell functions and activate the cells to treat a variety of disorders or disease conditions. Bioelectronics devices can be designed for use as alternative treatments to overcome the deficiencies of several conventional medical treatments. It could potentially assist as drug-free relief when therapeutic drugs become ineffective, costly, with serious side effects and cannot be replaced, loss of future treatment options, and hence, life threatening, as for drug resistant Human immunodeficiency virus (HIV-1) patients.
Since the underlying mechanisms of the biological system and disease state is
dominated by electrostatic interactions, specifically, the interaction between HIV-1 and the host cell that is predominantly by electrostatic interactions (protein charge-charge interaction) has an important role in its life cycle replication.At given pulses, the charge distribution and polarization of the electro-active protein molecules takes place, inducing conformation change which can enhance immune activity and inhibit the interaction of HIV-1 and host cells, disturbing its life cycle, leading to the mechanisms of the inactivation signal-induced virus death. These electrically induced protein transformations is used in this research as blood-cell treatment and as anti-HIV-1 electrotherapy.
Advances in bioelectronics technology, which involve new CMOS IC design,
iv
between the electronic signal and the biological cells, and how electronic devices and circuitry directly communicate with the electro-active body tissue and blood cells. This research project addresses the design and development of a novel energy-efficient miniature biomedical device using a new CMOS technology. It can generate, deliver and control an appropriate periodical low frequency electrical pulses, through the low-resistance skin surface to a patient’s blood. The notable feature of such a smart device is its cellular specificity: the parameters of the generated electrical pulse which are designed and selected in order to stimulate only one particular type of tissue (blood) leaving the others unaffected. The device comprises a mixed-signal low power dual-band waveform generator (WFG) chip along with a novel two dual-band tuning system. It was fabricated using Global Foundries (GF) 8RF-DM 130-nm CMOS process with a supply voltage of ±1V for the analog circuit and +1V for logic circuits. The WFG core (band I) can be tuned in the range 6.44 kHz - 1003 kHz through bias current adjustment, while a lower frequency (band II) in the range 0.1 Hz to 502 kHz can be provided digitally. Two WFG approaches, that comprise relaxation oscillators with different relaxation timing networks, have been developed for comparison.
Since the aim of this work is to transfer electrical signal in a specifically controlled fashion through the tissue, a novel low power active electrode-pair signal delivery system, compatible with human skin with high signal integrity, is developed. The circuit was fabricated in a 130-nm CMOS process using a low supply-voltage of +1.2V to deliver bi-phase square waveform signals from 16 selectable low-frequency channels. The individual active electrode can also be used to deliver mono-phase square/triangular waveform output signals. Accuracy, safety, low power, light-weight, miniature and low-cost characteristics are the main concerns. Being a miniature bioelectronics component with low power consumption, the proposed device is suitable both as a non-invasive and as an implantable biomedical device, in which WFG and electrodes circuitry can communicate with the electro-active biomolecule, strongly stimulating certain events in a complex biological system.
v
response to cellular signals. The frequency-dependent dielectric present in proteins involves the redistribution and alignment of the proteins charged molecule and its polar molecule in response to an applied external electrical field can also induce conformation change. Interference polarization within proteinscould interrupt theinteraction between both sides of predominantly host cell proteins and of the HIV-1 infective envelope and its protein particles. This could disturb the signalling proteins for cell activation, and, hence, the virus cannot conjugate with the target cells and control the host cell protein activity. Since the virus is unable to reproduce out of a host cell, hence the virus cannot mutate and develop resistance easily, and use alternative binding and entry mechanisms as in the pharmacological approaches. After carefully studying the interaction of the HIV-1 virus and the host cell, with respect to signal transfer, CD4 receptor, co-receptors CCR5 and nuclear transport factor nucleoporins FGNup153 proteins of the lymphatic system, which are essential targets for HIV-1 infection and its life cycle replication represent an attractive target to investigate in this research project. The activities of the underlying mechanism of the target cell are then examined utilizing immunofluorescence microscopy technique with specific fluorescent labelled antibodies, and accurate results are obtained with relatively low cost. The results demonstrated that the low frequency electrical pulse could inhibit virus attachment and fusion. It is also could provide a permeability barrier, that prevents the import and export of large macromolecule virus particles through the nuclear pore complex. These effects could induce an antiviral state for a period of time, and stope HIV-1 virus replication, with no potential risks and harm to the host cells, compared to the common drugs. This is promising for the conception of HIV-1 treatment in vivo. Although further investigations are required in order to fully use the application of electrical stimulation in vivo for treatment, the result is provides the necessary impetus for the applications of low frequency electrical stimulation on human immune response. This might offer important antiviral therapy against the most devastating pathogens in human history.
vi
Acknowledgments
The compilation of this research project would not have been possible without the support of others which is sincerely appreciated and thankfully acknowledged. Foremost, I would like to acknowledge and thank my supervisor Dr. Rezaul Hasan, for his valuable guidance, kindly encouragement and scholarly advice at various stages throughout my study. I would like to thank my supervisor Dr. Rezaul Hasan once again for facilitating the funding of this work through Massey University.
I would like to acknowledge the Massey University for financial support for the funding of this work. I also would like to acknowledge the Massey University Human Ethics Committee, Dr. Brian Finch, Human Ethics Chairs' Committee and Director, Mr. Jeremy Hubbard, Human Ethics Chairs' Committee: Southern A and to Ms. Patsy Broad, team leader. I would like to mention the facilities in the laboratory of Human Nutrition, School of Food and Nutrition (SoFN) laboratories, College of Health at Albany campus, Massey University for in-vitro biological tests as part of this work. I am grateful to Dr. Pamela Von Hurst co-director of vitamin D research center for her keen interest in supporting the researcher and her prompt kind encouragement regarding lab facilities and safety. I would further like to thank Dr. Cath Conlon for providing me with a place in the Human Nutrition lab. I thank Mr. James Connell compliance support officer and Mr. PC Tong and Mrs. Rachel Liu for the use of lab facilities and for the health and safety induction in lab building 27 and lab building 10. I also thank profusely Dr. Peter Flanagan, National Medical Director, New Zealand Blood Service for providing a Blood sample. I also would like to acknowledge chip fabrication support from MOSIS.
I would like to thank the staff at School of Engineering and Advanced Technology for their support during my study. I thank Mr. Joe Wang for electronic lab facilities and Mr. Roukin Dmitri for the use of Linux programme. I also would like to thank my friends and colleagues for all of the valuable words of encouragement. I would further like to thank my thesis proof reader, Mrs. Diana Hibbert.
Finally, I would like to thank my family. Their love, sacrifice, patience and
encouragement cannot be replaced by anything else in this world. I’m forever grateful to
vii
Table of Contents
Abstract………... iii
Acknowledgements………. vi
Table of Contents……… vii
List of Abbreviations……….. xii
List of Symbols……… xiv
List of Figures………. xv
List of Tables………... xxiii
Chapter 1. Introduction ……… 1
1.1 Biomedical Integrated Circuit Design ……… 1
1.2 Relevance……….. 6
1.2.1 Virus Replication………. 7
1.3 Develop Concept ……….. 10
1.4 Research Goals……….. 16
1.5 Scope of This Study……….. 16
1.6 Thesis Overview……… 20
Chapter 2. Overview of The System Model, Theory, Design and Approaches 23
2.1 Introduction………... 23
2.2 Waveform Generator Overview……… 24
2.3 Basic Theory of Oscillator……… 26
2.3.1 Oscillators Approaches……… 28
2.3.2 Relaxation Oscillator Architecture………. 30
2.4 Hysteresis Schmitt Trigger Concept………. 30
2.5 Principles of Operation of Typically WFG Circuit……….. 33
2.5.1 Theory of WFG Based on RC Network……….. 33
2.5.2 Theory of WFG Based on Integrator………... 35
2.6 Waveform Generator Approaches………. 36
2.6.1 Relaxation Timing Network Approaches……… 46
2.6.1.1 Passive RC Approaches……….. 46
viii
2.7 Tuning Circuit Approaches………... 53
2.8 Digital Model for Frequency Divider……… 55
2.8.1 Frequency Divider Theory……….. 56
2.8.2 Flip Flop Approaches……….. 57
2.8.3 Sources of Power Dissipation In A Digital Model………….. 64
2.9 Active Electrode……….... 67
2.10 Conclusion………. 70
Chapter 3. Design Criteria, Implementation and Fabrication of Waveform Generator Circuit for Extra Low-Frequency CMOS Micro- Power Applications …...... 72
3.1 Introduction………... 72
3.2 Trade-off of Low Power CMOS WFG Design Analysis……….. 73
3.3 Design Criteria of CMOS ELF WFG Circuit……… 79
3.4 Circuit Design and Topology of The ELF WFG………... 81
3.5 Circuit Operation of The ELF WFG………. 82
3.6 Simulation and Performance Analyses of The ELF WFG……... 88
3.6.1 Amplitude Control of The ELF WFG………. 91
3.6.2 Frequency Control of The ELF WFG………. 94
3.7 Layout and Fabrication of The ELF WFG……… 96
3.8 Experimental Results of The ELE WFG………... 102
3.9 Conclusion………. 104
Chapter 4. Design Criteria, Implementation and Fabrication of Dual-Band CMOS Waveform Generator With Ultra-Wide Low-Frequency Tuning Range……….. 106
4.1 Introduction………... 106
4.2 Design Criteria of CMOS Dual-Band WFGINT………. 108
4.3 Circuit Design and Topology of The WFGINT……….. 111
4.3.1 WFGINT Circuit Design………... 111
4.3.2 Hysteresis Schmitt Trigger Circuit of The WFGINT……….... 112
ix
4.3.4 WFGINT Circuit Operation………. 117
4.3.5 Components Sizing for Low Power & Low Frequency WFGINT Design………... 121
4.4 Frequency Tuning Technique……… 125
4.4.1 Analog Tuning Model………. 125
4.4.2 Digital Model Implementation……….... 126
4.4.2.1 Clock and Clock_Bar………. 126
4.4.2.2 The Frequency Division Circuit………. 126
4.4.2.3 Multiplexors And Path Selector……… 128
4.5 Simulation and Performance Analyses Of WFGINT……….. 132
4.5.1 Robustness of The WFGINT Circuit………. 135
4.5.1.1 Temperature Variation………... 135
4.5.1.2 Eye Diagram Analysis……… 135
4.6 Simulation Results of The Digital Model……….. 137
4.6.1 Clock And Clock_Bar………. 139
4.6.2 FD circuit………. 140
4.7 Layout and Fabrication of The WFGINT………... 146
4.8 Experimental Results of The WFGINT……….. 150
4.8.1 Amplitude Control of The WFGING……….... 154
4.8.2 Frequency Control of The WFGING………. 155
4.9 Optimization Flowchart of The WFGING………. 159
4.10 Comparison of The WFGINT With ELF WFG and With Other Published WFG……….. 161
4.11 Conclusion……… 163
Chapter 5. Design Criteria, Implementation and Fabrication of a Low- Power CMOS Active-Electrode-Pair For Low-Frequency Multi- Channel Biomedical Stimulation………... 165
5.1 Introduction……….. 165
5.2 Design Criteria for Active Electrode……… 169
x
5.3.1 Active Electrode Circuit Analysis………... 171
5.4 Simulation And Performance Analyses of The Active Electrode………... 174
5.5 Layout and Fabrication of The Active Electrode………. 178
5.5.1 Experiment Results of The Active Electrode……….. 180
5.6 Conclusion……… 185
Chapter 6. In Vitro Biological Experiment Design And Performance To Investigate The Effect of Low Frequencies Electrical Pulses on The Human Blood Cells……….. 186
6.1 Introduction……….. 186
6.2 Chemokine Receptor CCR5………. 189
6.2.1 CCR5 Protein Structure………... 190
6.3 The Nuclear pore complex (NPC)……… 193
6.4 Frequency–Dependent Polarization………. 202
6.5 In Vitro Biological Tests……….. 205
6.5.1 Materials and Procedure……….. 205
6.5.2 Electrical Simulation Procedure……….. 207
6.5.3 Immunofluorescence Microscopy Assay……… 208
6.5.3.1 Immunofluorescence Cell Staining Procedure………... 209
6.6 Electrical Stimulation Results……….. 214
6.6.1 Expression of CD4 and CCR5………. 214
6.6.2 CCR5 N-Terminal Conformation Epitopes………. 216
6.6.3 Distribution of FGNup153……….. 218
6.7 Discussions on Experimental Results………... 223
6.8 Conclusion……… 229
Chapter 7. Conclusion……… 231
7.1 Summary……….. 231
7.2 Contributions of This Doctoral Research………. 243
7.3 Recommendations for Future Research………... 246
xi
Appendix A. Supplementary Documents 282 Ethic Approval 283 List of Publications 284
xii
List of Abbreviations
AA Amino Acid
Ab Antibody
D Aspartic Acid
BJT Bipolar Technology
BSA Bovine Serum Albumin
CCII Current Conveyor
CFOA Current Feedback Operational Amplifier
Clk Clock
Clk_bar Clock_bar
CM Current-Mode
CSE Clocked Storage Element
D-FF D-Flip Flop
DRC Design Rule Checking
ELF Extra Low Frequency
FBS Fetal Bovine Serum
FD Frequency Divider
FF Flip Flop
FG Phenylalanine-Glycine
h Hour
HCl Hydrochloric acid
HIV-1 Human immunodeficiency virus
IC Integrated Circuit
Kap Karyopherin
LVS Layout Versus Schematic
mAbs Monoclonal Antibodies
min Minute
MLF Moderate Low Frequency
MUX Multiplexer
NES Nuclear Export Signal
NLS Nuclear Localization Signal
xiii
NPC Nuclear pore complex
Op-Amp Operational Amplifier
OTA Operational Trans-conductance Amplifiers
PFA Paraformaldehyde
PG Pass Gate
PIC Pre-Integration Complex
PS Path Selector
PVT Process And Temperature Variation
Q Glutamine
SC Stratum Corneum
SDL Schematic-Driven Layout
ST Schmitt Trigger
STG Stage
TG Transmission-Gate
TGFF Transmission-Gate Flip Flop
VTC Voltage Transfer Characteristic
WFG Waveform Generator
WFGINTG Waveform Generator Based on Integrator Timing Network
xiv
List of Symbols
A Area Meter Square C Capacitor Farad Cox Gate oxide capacitance Farad gm Trans-conductance Microampere/microvolt W Channel width of the MOSFET Micro-meter L Channel length of the MOSFET Micro-meter Output resistance of MOSFET Ohms Electron mobility Meter square/Volts seconds Bias Current of MOSFET Microamperes DC Drain current of MOSFET Microamperes VC Capacitor Voltage Output Volts VDD Positive Supply Voltage Volts VINT Integrator Voltage Output Volts Vo Output Voltage Volts VSS Negative Supply Voltage Volts Gate-source voltage of MOSFET Volts − Lower Threshold Voltage Volts
Schmitt Trigger Voltage Output Volts Threshold voltage Volts + Upper Threshold Voltage Volts Input Voltage Volts − Low Negative Saturation Level Volts + High Positive Saturation Level Volts R Resistor Ohms P Power Watts Frequency Hertz Time constant Seconds T Time Period Seconds
xv
List of Figures
Figure 1.1: Schematic diagram representing the development of a variety of implantable and non-invasive biomedical devices in the real world. These devices use the application of an electric field with an appropriate electrical signal and specific waveform and frequency to be applied internally or externally to a particular area of the body, to treat a variety of disorders or disease conditions, and to improve patients’ lives……… 5 Figure 1.2: The primary protein structure, (a) amino acid structure, and (b)
amino acids are connected together by a covalent linkage called a peptide bond to form polypeptide polymer chains and to build up
the primary structure of a protein……… 10 Figure 1.3: The development and design steps of electro-therapy concept and
device of this research project, (a) block diagram, and (b)
Schematic diagrams………
15 Figure 2.1: Block diagram of a simple positive feedback system………. 27 Figure 2.2: Schematic diagram of a simple oscillatory system………. 27 Figure 2.3: Schmitt Trigger, (a) basic Schmitt trigger circuit and (b) voltage
transfer characteristic of the Schmitt Trigger………. 31 Figure 2.4: Comparison between the output voltage transfer characteristic of
the comparator and the hysteresis Schmitt Trigger circuit, (a) comparator response to noisy signal, and (b) hysteresis Schmitt Trigger response to noisy signal………. 32 Figure 2.5: A basic block diagram of a typical WFG circuit, based on a RC
relaxation timing network………... 34 Figure 2.6: A basic block diagram of a typical WFG circuit based on a
hysteretic Schmitt Trigger and an integrator relaxation timing
network………... 35
Figure 2.7: Waveform generator architectures based on, (a) single differential N-MOSFET OTA, (b) two differential N-MOSFET
OTAs………... 41
xvi
comparator……….. 42
Figure 2.9: WFG architectures based on one OTA and a two-stage
comparator……….. 42
Figure 2.10: WFG architectures based on a dual output DO-OTA, using two single-ended commercial CA3080 OTA ICs………..
43 Figure 2.11: WFG architectures based on (a) three CMOS OTAs, (b) using
three commercial available LM13600 ICs……….. 44 Figure 2.12: Op-Amp-RC integrator (a) first order Op-Amp-RC Integrator,
(b) digitally controlled switched-capacitor matrices for tuning the
time constant of the Op-Amp-RC integrator circuit………... 49 Figure 2.13: Gm-C integrator (a) first order integrator, (b) a lossy integrator… 50 Figure 2.14: Resistive tuning techniques, voltage controls a bank of
MOSFETs………... 53
Figure 2.15: Schematic diagram of the frequency divider for “divide-by-2”
(/2) frequency division circuit with its waveform output………... 56 Figure 2.16: Schematic diagram of the logic gate (a) a simple PMOS and
NMOS pass transistor and (b) a CMOS transmission gate and its logic symbol………... 63 Figure 2.17: Schematic diagram of dynamic switching power dissipation in
CMOS inverter……… 64
Figure 2.18: Types of electrodes: (a) passive electrodes, and (b), active electrode, using commercial Op-Amps with Ag/AgCl transducer for biomedical applications………. 68 Figure 3.1: Trans-conductance amplifier (a) a single common source
MOSFET transistor operating in the saturation region as a current source, (b) the small-signal model……….. 74 Figure 3.2: CMOS Operational trans-conductance amplifier, (a) schematic
diagram (b) the small signal model of the differential amplifier with a current mirror load………... 77 Figure 3.3: Proposed, ELF WFG. Based on the periodical charging and
discharging operation of the capacitor C, ELF WFG circuit, provides a periodical square waveform output signal at Vo and an
xvii
Figure 3.4: Waveforms in the proposed ELF WFG……….. 83 Figure 3.5: Simulated transient output waveforms for ELF WFG for the first
design……….. 90
Figure 3.6: Amplitude (P–P) variation with the bias current IB3 and resistor R1, (a) amplitude (P–P) variation with IB3 for the two ELF WFG designs, (b) amplitude (P–P) variation with R1 for the first design and (c) amplitude (P–P) variation with R1 for the second
design……….. 93
Figure 3.7: Frequency tuning with bias current IB1 for the two ELF WFG
designs……….
94 Figure 3.8: Frequency tuning with resistor R2, (a) for the first ELF WFG
design, (b) for the second ELF WFG design……….. 95 Figure 3.9: The layout of on-chip identical units OPRPP and OPRRP
resistors, in series……… 97 Figure 3.10: Layout for MIM capacitor……….. 98 Figure 3.11: The layout for the two WFG circuit (design_1 and design_2).
The layout on top right corner and bottom right corner represent the complete layout for the two WFG circuit including the on-chip designed MIMCAP for MLF WFG with 40pF, and for ELE
WFG with 1nF for design _1 for area comparison……….
100 Figure 3.12: A close view of the complete layout (excluding the capacitor) for
the two ELF WFG circuit, for chip fabrication (a) for the first design, (b) for the second design. The top is the Schmitt Trigger circuit, while the rectangular box is the combination of different types of on-chip resistors……… 101 Figure 3.13: Package of the two ELF WFG circuit in PGA……….. 102 Figure 3.14 Chip photo-micrograph illustrates the location of the integrated
two ELE WFG circuit.……… 102 Figure 3.15: Chip outputs of the CMOS ELE WFG for the first design………. 103 Figure 4.1: Block diagram of the proposed mixed-signal CMOS waveform
generator. Oscillation frequency of WFG core circuit is fWFG
(band I) and the digitally channelized selectable output frequency
xviii
Figure 4.2: A schematic diagram of the core square/triangular WFGINT based
on gm-C integrator with clock and clock _bar generator………... 112 Figure 4.3: A single stage gm-C integrator based on CMOS OTA, (a) circuit
implementation, (b) integrator symbol and (c) building blocks
diagram………... 113
Figure 4.4: Schematic diagram of the WFGINT circuit operation, (a) transfer characteristic of the Schmitt trigger design, and (b) the square and triangular waveforms of the designed WFGINT circuit……… 117 Figure 4.5: The schematic diagram of the designed TGMS D-FF for a
divide-by/2 frequency division circuit……… 128 Figure 4.6: The implementation of the designed TGMS D-FF for a
divide-by/2 frequency division circuit………... 128 Figure 4.7: Multiplexers and path selector along with output driving circuit... 130 Figure 4.8: The complete architecture of the dual-band 16-channel
mixed-signal WFGING with ultra-wide low frequency tuning range…….. 131 Figure 4.9: Simulated transient square waveform output of the WFGINT 134 Figure 4.10: Spectrum analysis of the square waveform signal (fWFG = 17
kHz) in simulation profile………... 134 Figure 4.11: Simulated transient triangular waveform at the integrator output.. 135 Figure 4.12: WFGINT circuit analysis for the frequency stability with
temperature variations………. 137 Figure 4.13: Eye diagram simulation results for the designed WFGINT……….. 137 Figure 4.14: Simulated transient response of the clock and clock_bar
generator………. 139
Figure 4.15: The 16 channel output square waveforms digitally selectable
through MUX1, MUX2 and PS……….. 141
Figure 4.16: Power versus generalized width WN………... 143
Figure 4.17: Power dissipation versus supply voltage of the FD circuit………. 144 Figure 4.18: WFGING frequency versus supply voltage……….. 144 Figure 4.19: The simulated speed-power trade-off of the FD circuit………….. 145 Figure 4.20: The simulation result for power and frequency versus V_tune….. 145 Figure 4.21: The complete layout (including the capacitor) for the
xix
mixed-signal WFGINT circuit, (b) show close views of the WFGINT core circuit, (c) D-FF, (d) MUX1, and (e) PS
circuit………..
149 Figure 4.22: Package of the analog WFGINT and the digital model circuit in
PGA………. 150
Figure 4.23: Chip photo-micrograph illustrates the location of the integrated mixed-signal dual-band WFGINT circuit………...
150 Figure 4.24: Experimental measurement set up for the fabricated oscillator….. 151 Figure 4.25: Measured chip outputs, (a) square waveform of the core WFGINT,
(b) FFT spectrum analysis of the generated square waveform signal, (c) triangular waveform of the integrator, and (d) clock and clock_bar translation outputs………... 153 Figure 4.26: Amplitude (P–P) variation comparing measured results and
simulation, (a) with V_tune bias current IB3, and, (b) with R. 155 Figure 4.27: The measured profile values of the oscillation frequency vs.
V-tune of the WFGINT output signal, compared with the simulation profile values and the related results for 10 pF, 100 pF and 1000 pF load capacitor values respectively………. 157 Figure 4.28: Optimization flowchart of the designed CMOS dual-band
16-chanal mixed-signal waveform generator………... 160 Figure 5.1: Human skin layer……… 166 Figure 5.2: Current response of skin to the application of a square-wave
voltage pulse………... 167
Figure 5.3: Proposed adaptive biased CMOS active electrode circuit, (a) circuit implementation, with input stage bias current set dynamically by two mechanisms, first, by the simple current mirror and secondly, by applying adaptive biasing, and (b) equivalent circuit representing the voltage follower active
electrode circuit……….. 170 Figure 5.4: Simulated transient response of individual active electrode buffer
to an input square-wave pulse of a 100ms duration and +1V amplitude (the VOPS output of the PS in chapter 4) for RL= 50kΩ. 175
xx
employing two identical active electrodes……….. 177 Figure 5.6: Simulated transient response of the dual active electrode circuit
driving a 50kΩ floating load in a differential fashion displaying a
transmitted bi-phase square waveform with, (a) approximately ± 1V differential output voltage, and (b) ± 40μA differential output
current………. 178
Figure 5.7: The two identical active electrode circuits (a) layout, (b) package of the microchip and (c) Chip photo-micrograph of the fabricated
die……… 180
Figure 5.8: Experimental set-up for the active electrode chip output
waveform measurements.………... 181
Figure 5.9: Oscilloscope trace of the differential output waveform signal of
the dual identical active electrode circuits……….. 181 Figure 5.10: A proposed proto-type electro-bio-stimulation system using the
fabricated active electrode-pair complete with (a) mixed-signal CMOS waveform generator, WFGING (IC1 in chapter 4), (b) the active electrode-pair (IC2), and, (c) solar panel charged regulated power-supply. The complete encapsulated bio-medical device with electrode contacts is shown in (d)………... 184 Figure 6.1: Protein structure of co-receptor CCR5 and its sequence. The
image outlines the residues of N-terminus, and C-terminus, residues of the 7-TM region and of the extracellular (EL) and intracellular loop (IL) regions respectively………. 190 Figure 6.2: Nuclear pore complex structure……….. 195 Figure 6.3: A heterogeneous tripartite structure of FGNup153, comprises
three different domains, N-terminal domain, zinc finger domain,
and C-terminal domain………... 197
Figure 6.4: Nuclear pore complex model for protein import and export of large macromolecular proteins that are recognized by nuclear transport receptors (NTRs) and passage them through the central
channel……… 201
Figure 6.5: The electrical test glass chamber with stainless steel wire
electrodes………
xxi
Figure 6.6: Experimental set up for electrical stimulation test. Healthy human buffy coat samples were exposed for 2h to low frequency bipolar square waveform pulses of 5Hz, 10Hz and1000kHz with 1Vpp in a 30ml capacity glass chamber, 3cm in diameter, with stainless steel wire electrodes………. 207 Figure 6.7: Purifying and coating coverslips with HCl and poly-lysine
respectively, to assure cells adhesion……….. 208 Figure 6.8: Cells adhesion on coverslips. Buffy coat samples spread and
plated on coated coverslips that are mounted on Parafilm to prevent the coverslips from moving, and then incubated in oven
for 30 min at 37 °C……….. 209 Figure 6.9: The steps of experimental procedure for immunofluorescence
cells staining……… 212
Figure 6.10: Experimental setup for acquiring images. (a) A Carl Zeiss Axio Star plus microscope with AxiosVison software, and (b) the tested and most successful sealed coverslips used in this
experiment………... 213
Figure 6.11: Cell surface expression of CD4 (green) and CCR5 (yellow) in human healthy buffy coat samples, for unstimulated (A) cells and for electrically stimulated cells (B) in response to low frequency electrical simulation conditions of 5Hz and 10Hz with 1V for 2h, analysed by immunofluorescence microscope. The intensity and distribution of the fluorescence on the cell membrane and cell surface represents the concentration of CD4 expression and CCR5 expression for unstimulated cells as shown in (b) and (f), and for electrically stimulated cells of 5Hz and 10Hz as shown in (c), (d), (g) and (h) respectively. (a) and (b) images display a wider view of the CD4 and CCR5 cell populations……… 215 Figure 6.12: Immunofluorescence assay for cellular distribution and binding
xxii
epitope in this region, in response to a low frequency electrical field. The images (a), (b) and (c) show a wider view of the cell population, the binding activity of unstimulated cells (A), CCR5 (yellow) in (d) with 3A9 (red) in (e) is shown in orange (merge) in (f), while (g) represents IgG as a control, (h) and (i) represents the CCR5 (yellow) in response to electrical stimulation (B) of
5Hz and 10Hz respectively………. 217 Figure 6.13: The immunofluorescence microscope images of the distribution
and pattern of the FGNup153. The images DAPI (blue) in (a) and (d) with Nup153 (red) in (b) and (e) is shown in purple (merge) in (c) and (f), displaying a wider view of the cell population for unstimulated cells (A) respectively. The co-localization of FGNup153 with mAb for (B) cells electrically stimulated with 5Hz and 10Hz incubated for 15min at -20°C in cold 100% methanol are displayed in (g), (h), (i) and (j), (k), and (l), respectively. For cells stimulated with 5Hz and 10Hz (green) that
were fixed in 4% PFA and permeabilized by incubating for 5 min at room temperature with 0.5% Triton X-100 the data is not
xxiii
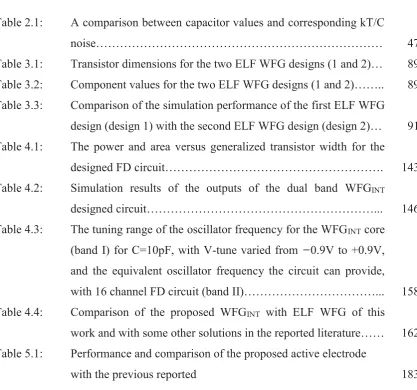
[image:24.595.119.537.104.494.2]Lists of Tables
Table 2.1: A comparison between capacitor values and corresponding kT/C
noise……… 47
Table 3.1: Transistor dimensions for the two ELF WFG designs (1 and 2)… 89 Table 3.2: Component values for the two ELF WFG designs (1 and 2)…….. 89 Table 3.3: Comparison of the simulation performance of the first ELF WFG
design (design 1) with the second ELF WFG design (design 2)… 91 Table 4.1: The power and area versus generalized transistor width for the
designed FD circuit………. 143 Table 4.2: Simulation results of the outputs of the dual band WFGINT
designed circuit………... 146
Table 4.3: The tuning range of the oscillator frequency for the WFGINT core (band I) for C=10pF, with V-tune varied from ̶ 0.9V to +0.9V, and the equivalent oscillator frequency the circuit can provide, with 16 channel FD circuit (band II)………... 158 Table 4.4: Comparison of the proposed WFGINT with ELF WFG of this
work and with some other solutions in the reported literature…… 162 Table 5.1: Performance and comparison of the proposed active electrode