This is a repository copy of
Evolution of size-dependent flowering in a variable
environment: partitioning the effects of fluctuating selection
.
White Rose Research Online URL for this paper:
http://eprints.whiterose.ac.uk/1395/
Article:
Rees, M., Childs, D.Z., Rose, K.E. et al. (1 more author) (2004) Evolution of
size-dependent flowering in a variable environment: partitioning the effects of fluctuating
selection. Proceedings of the Royal Society B: Biological Sciences, 271 (1538). pp.
471-475. ISSN 1471-2954
https://doi.org/10.1098/rspb.2003.2596
[email protected] https://eprints.whiterose.ac.uk/ Reuse
Unless indicated otherwise, fulltext items are protected by copyright with all rights reserved. The copyright exception in section 29 of the Copyright, Designs and Patents Act 1988 allows the making of a single copy solely for the purpose of non-commercial research or private study within the limits of fair dealing. The publisher or other rights-holder may allow further reproduction and re-use of this version - refer to the White Rose Research Online record for this item. Where records identify the publisher as the copyright holder, users can verify any specific terms of use on the publisher’s website.
Takedown
If you consider content in White Rose Research Online to be in breach of UK law, please notify us by
Published online14 January 2004
Evolution of size-dependent flowering in a variable
environment: partitioning the effects of fluctuating
selection
Mark Rees
1*, Dylan Z. Childs
1, Karen E. Rose
1and Peter J. Grubb
2 1Department of Biological Sciences and NERC Centre for Population Biology, Imperial College, Silwood Park,Ascot SL5 7PY, UK
2Department of Plant Sciences, University of Cambridge, Cambridge CB2 3EA, UK
In a stochastic environment, two distinct processes, namely nonlinear averaging and non-equilibrium dynamics, influence fitness. We develop methods for decomposing the effects of temporal variation in demography into contributions from nonlinear averaging and non-equilibrium dynamics. We illustrate the approach usingCarlina vulgaris, a monocarpic species in which recruitment, growth and survival all vary from year to year. InCarlinathe absolute effect of temporal variation on the evolutionarily stable flowering strategy is substantial (ca. 50% of the evolutionarily stable flowering size) but the net effect is much smaller (ca. 10%) because the effects of temporal variation do not influence the evolutionarily stable strategy in the same direction.
Keywords:nonlinear averaging; non-equilibrium dynamics; evolutionarily stable strategy
1. INTRODUCTION
Temporal variation in demographic rates is a ubiquitous property of natural systems (Reinartz 1984; Verkaar & Schenkeveld 1984; Klemow & Raynal 1985; de Jong & Klinkhamer 1986, 1988; Crawley & Gillman 1989; de Jong et al. 1989, 2000; Kelly 1989; Watkinson 1990; Louda & Potvin 1995; Klinkhameret al.1996; Campbell 1997; Wesselinghet al.1997; Reeset al.1999, 2002; Rose
et al.2002). Despite this, we know almost nothing about the role and importance of temporal variation in the evol-ution of plant life histories in natural systems. This is caused, in part, by a lack of suitable data, but also reflects the complex way that temporal fluctuations affect fitness. There are two distinct ways that temporal variation influ-ences fitness. First, average demographic rates vary owing to nonlinear averaging (NLA) (Ruel & Ayres 1999). For example, probabilities of survival and growth are nonlinear functions and so demographic rates in the average environment will differ systematically from average demo-graphic rates. Second, there are non-equilibrium fluctu-ations in fitness caused by variation in both demographic rates and the size and age structure of the population; this means that the fitness of a particular strategy varies, and bet-hedging may become an important component of fit-ness (Seger & Brockmann 1987). It is important to separ-ate the effects of NLA and non-equilibrium dynamics (NED) because there is no reason to assume that they act in the same direction, and so potentially large effects of temporal variation on fitness may be masked if they act equally but in opposite directions. How these different mechanisms influence life-history evolution in the field is an important, but still unanswered, question.
Despite the presence of a well-developed theoretical framework for estimating fitness in stochastic
environ-*Author for correspondence ([email protected]).
Proc. R. Soc. Lond.B (2004)271, 471–475 471 2004 The Royal Society
DOI 10.1098/rspb.2003.2596
ments (Tuljapurkar 1990), there are few examples of stud-ies that have applied the techniques to empirical datasets. Rees et al. (1999) and Rose et al. (2002) attempted to separate the effects of stochastic recruitment, growth and mortality on the evolutionarily stable flowering size, by fit-ting statistical models with and without year effects and comparing their predictions. The problem with this approach is that the constant- and stochastic-environment models have different fitted functions. For example, in
Carlinathe probability of survival is independent of size if one ignores year effects and size dependent when year effects are included (Roseet al. 2002). This means that the influence of stochastic variation is confounded by changes in the fitted functions, making it difficult to assess the impact of temporal variation on life-history evolution. In addition, these studies did not attempt to separate the effects of NLA and NED.
We investigate the selection pressures acting on the flowering strategy of Carlina, extending the analysis of Rose et al. (2002) and Childs et al. (2003, 2004) by developing a method for systematically decomposing the effects of stochastic variation on the evolutionarily stable strategy (ESS). The methods are derived for theCarlina
system but are applicable to any system where variation in demographic rates has been quantified. We derive appropriately averaged versions of the statistical models for recruitment, growth and survival, which allow the effects of different sources of stochasticity on the evol-utionarily stable flowering size to be quantified. Methods for constructing size- and age-dependent stochastic mod-els and calculating evolutionarily stable flowering stra-tegies are described in Childset al. (2003, 2004).
2. METHODS
(a) General approach and rationale
472 M. Rees and others Fluctuating selection and size-dependent flowering
sources of temporal variation; (ii) NLA; and (iii) NED. To par-tition these effects, we use statistical models including year effects to derive appropriately averaged functions for the differ-ent demographic transitions. Comparison of the ESS predictions of the different models then allows the impact of stochastic effects to be estimated. We assume that a model,f(t), which contains parameters, denoted collectively byt that vary from year to year, describes some demographic rate. This function could depend on plant size or age, and may also contain para-meters that do not vary from year to year. The average demo-graphic rate is given by averaging f(t) with respect to the distribution of yearly parameters,t, that is E[f(t)]. If f(t) is nonlinear then this expectation will depend on the variance of
t. By contrast, iff(t) is linear thenE[f(t)]=f(E[t]), so the difference betweenE[f(t)] andf(E[t]) measures the impact of NLA on demographic rates. If we define f¯=E[f(t)] and
f¯=f(E[t]) then the difference between the ESS predictions of models that use these functions will provide an estimate of the effect of NLA. We will refer tof¯andf¯as the
average-environ-ment (AE) model and NLA model, respectively.
The second way that temporal variation could influence the ESS is through NED. To separate the effects of NLA and NED we need to define a model where demographic rates vary from year to year, but the effect of NLA is removed. To do this we define the function
f¯=f⫺(f¯⫺ f¯), (2.1)
where f is the demographic rate in year type ; the term in
brackets is the effect of NLA. The average off¯with respect to tisf¯, becauseE[f]=E[f(t)]=f¯. In this way, the difference
between the ESS predictions of models that usef¯andf¯provides
an estimate of the effect of NED. We will refer tof¯as the
non-equilibrium dynamics (NED) model. Therefore, by carefully averaging the functions that define a model we can estimate the effects of NLA and NED on model predictions.
(b) Alternative models for demography inCarlina InCarlina, the number of recruits and the intercepts of the size-dependent growth and survival functions vary from year to year (Rose et al. 2002). None of the estimated parameters is correlated within years (Spearman’s rank correlation,p⬎0.2 in all cases), and so any differences in the predictions obtained with different models may be attributed to specific stochastic effects. A single alternative model for recruitment was derived by replacing the number of recruits in a particular year,R, with
the mean number of recruits,R¯. We refer to this as the average-recruitment model. Survival is described by a logistic regression, and so the NLA survival function, conditional on plant size,x, is given by
s¯(x)=
1
N
冘
N
=1
exp(m0⫹␥⫹msx)
1⫹exp(m0⫹␥⫹msx)
, (2.2)
whereNis the number of year types,m0is the average intercept,
␥is the deviation from m0in year type , and ms is the
size-dependent slope. The average-environment survival function is
s¯(x)= exp(m0⫹msx)
1⫹exp(m0⫹msx)
. (2.3)
The functionss¯(x) ands¯(x) are the NLA and AE survival
func-tions, respectively. The NED survival function,s¯(x), was
gener-ated using
s¯(x)=s(x)⫺(s¯(x)⫺s¯(x)), (2.4)
Proc. R. Soc. Lond.B (2004)
the expectation of which, with respect to the distribution of yearly intercepts, iss¯(x). To ensure thats¯(x)苸[0, 1], the
func-tion was truncated to lie inside the unit interval. The expectafunc-tion of the truncated functions was compared againsts¯(x) and found to give the same ESS predictions.
The NLA growth function is derived in an analogous manner. Growth inCarlinais well described by a simple linear model,
y=ag⫹␣⫹bgx⫹ , (2.5)
whereyandxare size (on a log scale) next year and this year, respectively,ag⫹␣is the intercept in year type,bgis the
size-dependent slope andis a normally distributed random variable with variance,2, that describes the scatter about the fitted line.
The probability that an individual grows from sizexto sizeyis therefore normally distributed, and so the NLA growth function is given by
g¯(x,y)=
1
N
冘
N
=1
1
冑
2exp冉
⫺(y⫺(ag⫹␣⫹bgx))2
22
冊
. (2.6)The average-environment growth function is
g¯(x,y)= 1
冑
2exp冉
⫺(y⫺(ag⫹bgx))2
22
冊
. (2.7)The functions g¯(x,y) and g¯(x,y) are referred to as the NLA
and AE growth functions, respectively. These are used to gener-ate the NED growth function, g¯(x,y):
g¯(x,y)=g(x,y)⫺(g¯(x,y)⫺g¯(x,y)), (2.8)
the expectation of which, with respect to the distribution of yearly intercepts, isg¯(x,y). To ensure thatg¯(x,y)苸[0, 1], the
function was truncated to lie inside the unit interval and then renormalized so that the conditional growth function is a true probability density function. The expectation of the truncated functions was compared against g¯(x,y) and found to give the same ESS predictions. The model using the average recruitment and the average-environment growth and survival functions is referred to as the constant-environment model.
(c) Partitioning the effects of temporal variation
To partition the effects of temporal variation in the vital rates on the evolutionarily stable flowering strategy, we use an ANOVA decomposition of the different stochastic effects. The evolutionarily stable flowering strategies were calculated using the techniques described in Childset al. (2004). By comparing the predictions of models using the AE and NLA survival and/or growth functions we can estimate the effect of NLA. Comparing the predictions of models incorporating the AE survival and/or growth functions with those of the NED models allows the effect of NED to be estimated. Interactions between the effects of NLA and NED can then be estimated by applying the NLA and NED models in a factorial manner. We write the evolutionarily stable mean flowering size in a fully stochastic, variable environ-ment,V, as a linear function of the corresponding mean size
in the average (constant) environment,C, a stochastic
recruit-ment effect,⌬RV, stochastic survival effects,⌬SNLAand⌬SNED,
stochastic growth effects,⌬GNLA and⌬GNED, and interaction
terms, such that
V=C⫹ ⌬RV⫹ ⌬SNLA⫹ ⌬SNED⫹ ⌬GNLA⫹ ⌬GNED
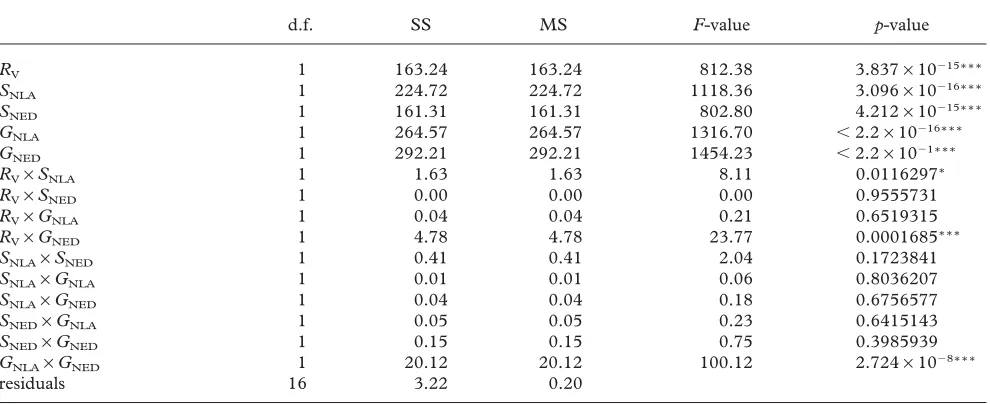
Table 1. ANOVA table summarizing the effects of different sources of stochastic variation on the evolutionarily stable flowering size, partitioned into the effects of NLA and NED.
(Only main effects and first-order interactions were fitted to the fully factorial design.)
d.f. SS MS F-value p-value
RV 1 163.24 163.24 812.38 3.837×10⫺15∗∗∗
SNLA 1 224.72 224.72 1118.36 3.096×10⫺16∗∗∗
SNED 1 161.31 161.31 802.80 4.212×10⫺15∗∗∗
GNLA 1 264.57 264.57 1316.70 ⬍2.2×10⫺16∗∗∗
GNED 1 292.21 292.21 1454.23 ⬍2.2×10⫺1∗∗∗
RV×SNLA 1 1.63 1.63 8.11 0.0116297∗
RV×SNED 1 0.00 0.00 0.00 0.9555731
RV×GNLA 1 0.04 0.04 0.21 0.6519315
RV×GNED 1 4.78 4.78 23.77 0.0001685∗∗∗
SNLA×SNED 1 0.41 0.41 2.04 0.1723841
SNLA×GNLA 1 0.01 0.01 0.06 0.8036207
SNLA×GNED 1 0.04 0.04 0.18 0.6756577
SNED×GNLA 1 0.05 0.05 0.23 0.6415143
SNED×GNED 1 0.15 0.15 0.75 0.3985939
GNLA×GNED 1 20.12 20.12 100.12 2.724×10⫺8∗∗∗
residuals 16 3.22 0.20
∗p⬍0.05; ∗∗∗p⬍0.001.
Table 2. Estimated change in the evolutionarily stable flowering size resulting from different sources of stochastic variation, from the main-effects-only model, partitioned into the effects of NLA and those of NED.
(The baseline evolutionarily stable flowering size in a constant environment is also given.)
estimate (mm) net change (mm) absolute change (mm)
mean flowering size constant
environment C 56.8
recruitment ⌬RV ⫹4.5∗∗∗ ⫹4.5 4.5
survival ⌬SNLA ⫺5.3∗∗∗ ⫺9.8 9.8
⌬SNED ⫺4.5∗∗∗
growth ⌬GNLA ⫹5.8∗∗∗ ⫺0.2 11.8
⌬GNED ⫺6.0∗∗∗
∗∗∗p⬍0.001.
where the NLA and NED subscripts refer to the effects of NLA and NED, respectively. To estimate these effects, the evol-utionarily stable flowering size was calculated using every combi-nation of AE, NLA, NED and stochastic models for survival, growth and recruitment. The resultant design of the simulation experiment is a five-way fully factorial ANOVA without repli-cation (i.e. R¯ versus R, s¯(x) versus s¯(x), s¯(x) versus s¯(x), g¯(x,y) versusg¯(x,y) andg¯(x,y) versusg¯(x,y)). The size slope
of the flowering function,s, was constrained during the
simul-ation experiment to fix the variance in the threshold-size distri-bution (see Childs et al. (2004) for a justification of this approach).
3. RESULTS
(a) Partitioning the effects of temporal variation
The ANOVA model (equation (2.9)) with main effects and two-way interactions accounted for 99.6% of the vari-ation in the evolutionarily stable mean flowering size. All the main effects and two of the interactions (RV×GNED
and GNLA×GNED) were highly significant (p⬍0.001).
Only one other interaction (RV×SNLA) was significant
(p⬍0.05) (table 1). The ANOVA model with only the
B (2004)
main effects accounts for 97.2% of the variance, suggest-ing that the effects of variable recruitment, survival and growth on the evolutionarily stable flowering size are approximately additive. Consequently, to simplify model interpretation, the main-effects model was used to derive estimates of the stochastic effects (table 2). The net effect of stochastic survival was greatest (⌬SNLA⫹ ⌬SNED =⫺9.8), followed by that of recruitment (⌬RV=4.5) and
then that of growth (⌬GNLA⫹ ⌬GNED=⫺0.2). Variable
recruitment selects for larger sizes at flowering, which sug-gests the operation of a bet-hedging strategy: large sizes at flowering, coupled with variable growth, distribute reproduction over several years, thereby mitigating the effects of low-recruitment years. By contrast, the non-equilibrium effects of variable survival and growth select for smaller flowering sizes (i.e. ⌬SNED=⫺4.5,
⌬GNED=⫺6.0): individuals flower earlier to reduce the
risk of suffering occasional high-mortality or low-growth years. When we consider the absolute values of the different terms, variable growth had the largest impact (|⌬GNLA|
⫹|⌬GNED|=11.8), followed by survival (|⌬SNLA|
⫹|⌬SNED|=9.8) and recruitment (|⌬RV|=4.5). The
[image:4.598.49.545.374.481.2]474 M. Rees and others Fluctuating selection and size-dependent flowering
term (RV×GNED and RV×SNLA, not presented) both
increased the evolutionarily stable flowering size, while the interaction involving the growth terms (GNLA×GNED, not
presented) reduced the evolutionarily stable size.
4. DISCUSSION
By calculating the evolutionarily stable flowering size with a set of carefully chosen analogues of the stochastic model, we have partitioned out the effects of different sources of stochasticity. The absolute change in the evol-utionarily stable flowering size caused by these effects is
ca. 50% of the evolutionarily stable size in the constant environment, though the net effect is much smaller (ca. 10%) because the processes do not influence the ESS in the same direction. Without quantifying the total effect of stochasticity in this way, it would be easy to underestimate the influence of temporal variation. For example, reducing temporal variation in survival could increase flowering sizes by as much as 19% of the current observed mean. NED induced by variable survival and growth select for smaller flowering sizes. Presumably, this reflects the cost associated with occasional low-survival or low-growth years: individuals that wait too long before flowering increase the risk of suffering such an event. By contrast, variable recruitment selects for larger flowering sizes, which indicates that a bet-hedging mechanism is operating. To spread the risk of suffering a poor year for recruitment, a particular flowering strategy needs to dis-tribute reproduction over several years. When individuals are subject to variable growth (within or between years) increasing the size at flowering achieves this by increasing the variance in the age at flowering. We suggest that, in a system with density-dependent recruitment, these mech-anisms are generic, and the direction of change in the ESS resulting from NED should be consistent across systems. The effect of NLA depends on the shape of the survival and growth functions. For survival, the standard small-variance approximation of equation (2.2) shows that, pro-vided s¯(x)⬎1/2, temporal variability reduces the prob-ability of survival and so selects for smaller sizes at flowering. For all plants with a longest leaf length of greater than 10 mm, we find thats¯(x)⬎1/2 and therefore selection favours flowering at smaller sizes, as found in the simulation experiment. The biological reason for this is that the probability of survival is bounded at one, and plants that make the decision to flower are large and have high chances of survival. This means that in good years the probability of survival hardly changes, whereas in bad years the probability of survival is substantially reduced. Clearly, the effect of bad years will outweigh that of the good years and as a result the probability of survival decreases when the environment fluctuates. In long-lived monocarpic species, where the probability of survival is high for large plants, we suspect that⌬SNLAwill be
nega-tive, as in Carlina. However, in short-lived species the opposite may be true, because in bad years the probability of survival is bounded at zero.
A similar approach can be used to understand the effect of variance in the growth intercept. The number of microsites captured by a plant depends on its seed pro-duction, which is a function of plant size on an arithmetic scale (i.e. not log transformed), and arithmetic plant size
Proc. R. Soc. Lond.B (2004)
is given by exp(y)=exp(ag⫹␣⫹bgx⫹ ) (equation
(2.5)). This function is concave up (has a positive second derivative), which means that large values of and ␣
result in dramatic increases in plant size, whereas small values are bounded by zero. The net effect is an increase in arithmetic size when and ␣ fluctuate, which selects
for larger sizes at flowering (Rees et al.2000; Rose et al.
2002; Childs et al. 2003), as found in the simulation experiment. For a wide range of species growth is well described by the simple linear model (equation (2.5); Metcalf et al. 2003) and so we expect that ⌬GNLA will
generally be positive.
Our method for partitioning out the effects of stochas-ticity is only one of several approaches that could be used. For example, one could argue that the geometric (rather than arithmetic) mean of the fitted survival functions is most appropriate, because the probability of surviving to a given age is the product of several size-dependent mor-tality terms. The advantage of our adopted method is that the effects of NLA and NED are easy to interpret in terms of simple underlying models (Reeset al.2000; Roseet al.
2002; Childset al.2003).
The techniques developed in this article should be broadly applicable to any system where temporal variation in demographic rates has been quantified and an appropri-ate model that allows the prediction of the evolutionarily stable or optimal strategy has been defined. A wide range of life-history problems can be addressed within this framework. For example, species with multiple repro-ductive delays arising from seed dormancy and delayed reproduction or complex reproductive strategies, combin-ing clonal growth and seed production, can easily be ana-lysed.
REFERENCES
Campbell, D. R. 1997 Genetic and environmental variation in life-history traits of a monocarpic perennial: a decade-long field experiment.Evolution51, 373–382.
Childs, D. Z., Rees, M., Rose, K. E., Grubb, P. J. & Ellner, S. P. 2003 Evolution of complex flowering strategies: an age-and size-structured integral projection model approach.
Proc. R. Soc. Lond.B270, 1829–1838. (DOI 10.1098/rspb. 2003.2399.)
Childs, D. Z., Rees, M., Rose, K. E., Grubb, P. J. & Ellner, S. P. 2004 Evolution of size-dependent flowering in a vari-able environment: construction and analysis of a stochastic integral projection model.Proc. R. Soc. Lond. B271. (In the press.) (DOI 10.1098/rspb.2003.2597.)
Crawley, M. J. & Gillman, M. P. 1989 Population dynamics of cinnabar moth and ragwort in grassland. J. Anim. Ecol. 58, 1035–1050.
de Jong, T. J. & Klinkhamer, P. G. L. 1986Population ecology of the biennialsCirsium vulgareandCynoglossum officinale:
an experimental and theoretical approach.Leiden, The Nether-lands: University of Leiden.
de Jong, T. J. & Klinkhamer, P. G. L. 1988 Population ecology of the biennialsCirsium vulgareandCynoglossum officinalein a coastal sand-dune area.J. Ecol.76, 366–382.
de Jong, T. J., Klinkhamer, P. G. L., Geritz, S. A. H. & van der Meijden, E. 1989 Why biennials delay flowering—an optimization model and field data on Cirsium vulgare and
Cynoglossum officinale.Acta Bot. Neerland.38, 41–55. de Jong, T. J., Klinkhamer, P. G. L. & de Heiden, J. L. H.
2000 The evolution of generation time in metapopulations of monocarpic perennial plants: some theoretical consider-ations and the example of the rare thistle Carlina vulgaris.
Evol. Ecol.14, 213–231.
Kelly, D. 1989 Demography of short-lived plants in chalk grassland. I. Life-cycle variation in annuals and strict bien-nials.J. Ecol.77, 747–769.
Klemow, K. M. & Raynal, D. J. 1985 Demography of two fac-ultative biennial plant species in an unproductive habitat.J. Ecol.73, 147–167.
Klinkhamer, P. G. L., de Jong, T. J. & de Heiden, J. L. H. 1996 An eight-year study of population dynamics and
life-B (2004)
history variation of the ‘biennial’Carlina vulgaris.Oikos75, 259–268.
Louda, S. M. & Potvin, M. A. 1995 Effect of inflorescence-feeding insects on the demography and lifetime fitness of a native plant.Ecology76, 229–245.
Metcalf, J. C., Rose, K. E. & Rees, M. 2003 Evolutionary demography of monocarpic perennials.Trends Ecol. Evol.18, 471–480.
Rees, M., Sheppard, A., Briese, D. & Mangel, M. 1999 Evol-ution of size-dependent flowering inOnopordum illyricum: a quantitative assessment of the role of stochastic selection pressures. Am. Nat.154, 628–651.
Rees, M., Mangel, M., Turnbull, L. A., Sheppard, A. & Briese, D. 2000 The effects of heterogeneity on dispersal and colon-isation in plants. In Ecological consequences of environmental heterogeneity (ed. M. J. Hutchings, E. A. John & A. J. A. Stewart), pp. 237–265. Oxford: Blackwell Scientific. Rees, M., Bjørnstad, O. N. & Kelly, D. 2002 Snow grass, chaos
and the evolution of mast seeding.Am. Nat.160, 44–59. Reinartz, J. A. 1984 Life-history variation of common mullein
(Verbascum thapsus). 3. Differences among sequential cohorts.J. Ecol.72, 927–936.
Rose, K. E., Rees, M. & Grubb, P. J. 2002 Evolution in the real world: stochastic variation and the determinants of fit-ness inCarlina vulgaris.Evolution56, 1416–1430.
Ruel, J. J. & Ayres, M. P. 1999 Jensen’s inequality predicts effects of environmental variation. Trends Ecol. Evol. 14, 361–366.
Seger, J. & Brockmann, J. H. 1987 What is bet-hedging? In Oxford surveys in evolutionary biology, vol. 4 (ed. P. H. Harvey & L. Partridge), pp. 182–211. Oxford University Press. Tuljapurkar, S. 1990 Population dynamics in variable environ-ments. Lecture Notes in Biomathematics. London: Springer. Verkaar, H. J. & Schenkeveld, A. J. 1984 On the ecology of short-lived forbs in chalk grasslands—life-history character-istics.New Phytol.98, 659–672.
Watkinson, A. R. 1990 The population-dynamics ofVulpia fas-ciculate—a 9-year study.J. Ecol.78, 196–209.
Wesselingh, R. A., Klinkhamer, P. G. L., de Jong, T. J. & Boorman, L. A. 1997 Threshold size for flowering in differ-ent habitats: effects of size-dependdiffer-ent growth and survival.