Structure Methods on Modern
Computer Architectures
Joseph Antony
A thesis submitted for the degree of
Doctor of Philosophy at
The Australian National University
I am indebted to my supervisor Alistair Rendell for his encouragement and support all through-out my candidature. My thanks also goes to Peter Strazdins and Andrey Bliznyuk, my co-supervisors. A warm thanks goes out to Ben Evans and the NCI National Facility team both as a PhD candidate and as a staff member. I’d like to take this opportunity to thank Mike Frisch and team Gaussian in Wallingford CT for not only sponsoring the ARC linkage grant that led to this thesis, but for all their help, advise and encouragement over the years.
I’ve been enriched by my interactions with past and present students, staff at ANU Computer Science; I’d like to especially thank:
Rui Yang, Pete Perrapong Janes, Jin Wong, Warren Armstrong, Jie Cai, V. Ganesh, Josh Milthorpe, Yang Xi, Arrin Daley. A special mention and thanks goes to Andrew Over and Bill Clarke. Bill had informed me about the state-of-the-art in full machine simulation, C++ run-time intricacies and Roman-era archaeological digs in Syria. Discussions with Andrew often revolved around SG1 and the UltraSPARC IIICu while Armin van Buuren was in ‘A State of Trance’. Joint work with Pete Janes enabled the development of the LPM model in Chapter 3, often sketched out on Saturdays after Pete’s fishing trips from Lake Burley Griffin. Rui Yang deserves an special mention for all his help throughout my thesis years, both as a joint collaborator (Chapter 5) and for his feedback and input often over coffee in his office.
A big vote of thanks goes to:
SGI (Todd Churchwood, Anthony David, Roberto Gomperts); IBM (Hugh Blemmings, James Kelly);
IBM academic program (for access to compilers and BLAS libraries); Apple ADC (Tess Collins);
ANU DCS (Pascal Vuylsteker, Steve Blackburne, Eric McCreath, Bob Edwards, James Fel-lows, Steve Hanley, Hugh Fisher, Robin Garner, Chris Johnson, Henry Gardner);
ANUSF (Jason Ozolins, Rika Kobayashi, Robert Davy, Jonathan McCabe, David Singleton, Judy Jenkinson, Margaret Kahn, Robin Humble, Bob Gingold);
ANU DoI (Allan Williams, Markus Buuchorn, Andrew Wellington, Doug Moncur); Cray Australia (Lindsay Hood);
Stuart Watson and Richard Walker.
Electronic structure codes are computationally intensive scientific applications used to probe and elucidate chemical processes at an atomic level. Maximizing the performance of these applications on any given hardware platform is vital in order to facilitate larger and more ac-curate computations. An important part of this endeavor is the development of protocols for measuring performance, and models to describe that performance as a function of system ar-chitecture. This thesis makes contributions in both areas, with a focus on shared memory parallel computer architectures and the Gaussian electronic structure code.
Shared memory parallel computer systems are increasingly important as hardware man-ufacturers are unable to extract performance improvements by increasing clock frequencies. Instead the emphasis is on using multi-core processors to provide higher performance. These processor chips generally have complex cache hierarchies, and may be coupled together in multi-socket systems which exhibit highly non-uniform memory access (NUMA) characteris-tics. This work seeks to understand how cache characteristics and memory/thread placement affects the performance of electronic structure codes, and to develop performance models that can be used to describe and predict code performance by accounting for these effects.
A protocol for performing memory and thread placement experiments on NUMA systems is presented and its implementation under both the Solaris and Linux operating systems is discussed. A placement distribution model is proposed and subsequently used to guide both memory/thread placement experiments and as an aid in the analysis of results obtained from experiments.
In order to describe single threaded performance as a function of cache blocking a sim-ple linear performance model is investigated for use when computing the electron repulsion integrals that lie at the heart of virtually all electronic structure methods. A parametric cache variation study is performed. This is achieved by combining parameters obtained for the linear performance model on existing hardware, with instruction and cache miss counts obtained by simulation, and predictions are made of performance as a function of cache architecture.
Extension of the linear performance model to describe multi-threaded performance on
complex NUMA architectures is discussed and investigated experimentally. Use of dynamic page migration to improve locality is also considered.
Acknowledgements v
Abstract vii
List of Papers xv
List of Presentations xvii
1 Introduction 1
1.1 Original Contributions . . . 1
1.2 Organization of Thesis . . . 2
2 Background 5 2.1 Microprocessors, Caches, Interconnects . . . 5
2.1.1 On-Chip Parallelism . . . 6
2.1.1.1 Data Level Parallelism . . . 6
2.1.1.2 Instruction Level Parallelism . . . 7
2.1.1.3 Thread Level Parallelism . . . 8
2.1.2 Cache Memory Structure . . . 8
2.1.2.1 Capturing Locality . . . 9
2.1.3 Primary Cache Characteristics . . . 10
2.1.3.1 Cache Associativity . . . 10
2.1.3.2 Types of Caches . . . 11
2.1.3.3 Cache Replacement Policies . . . 11
2.1.3.4 Cache misses and Cacheline eviction . . . 12
2.1.4 Cache Coherency and Memory Consistency in Multiprocessor Systems 13 2.1.4.1 Cache Coherency Protocols . . . 13
2.1.5 Memory Structures . . . 15
2.1.6 Hardware Performance Counters . . . 16
2.1.7 Microprocessors Used in This Thesis . . . 17
2.2 Performance Evaluation . . . 19
2.2.1 Performance Measurement using Software Assisted Profiling . . . 19
2.2.2 Performance Measurement using On-Chip Counters . . . 20
2.2.3 Performance Modelling using Analytic Techniques . . . 20
2.2.4 Performance modelling using Simulation . . . 21
2.2.5 Dynamic Binary Translation and the Callgrind/Valgrind tool . . . 22
2.3 Electronic Structure Methods . . . 23
2.3.1 Hartree-Fock approximation . . . 25
2.3.2 Atomic Basis Functions . . . 27
2.3.3 Two-Electron Integral Evaluation . . . 30
2.3.3.1 The McMurchie-Davidson scheme for ERIs . . . 31
2.3.3.2 The PRISM algorithm . . . 32
2.3.4 Density Functional Theory . . . 34
2.3.4.1 Kohn-Sham Equations . . . 36
2.3.4.2 Comparison of DFT and HF . . . 37
3 Thread and Memory Placement on Non-Uniform Memory Access Systems 41 3.1 Introduction . . . 41
3.2 Thread and Memory Placement . . . 42
3.2.1 Solaris NUMA Support . . . 43
3.2.2 Linux NUMA Support . . . 44
3.2.3 Placement verification in Solaris and Linux . . . 45
3.3 Experimental platforms . . . 46
3.3.1 Software Environment . . . 46
3.4 Basic Latency and Memory Bandwidth Characterization . . . 47
3.4.1 Latency Characterisation . . . 47
3.4.2 Bandwidth Characterisation . . . 47
3.5 A Placement Distribution Model . . . 49
3.5.1 Stream Experiments . . . 52
3.5.2 BLAS experiments . . . 54
3.6 Related Work . . . 55
3.7 Conclusions . . . 55
4 Use of the LPM for ERI Evaluation 57 4.1 Introduction . . . 57
4.2 ERI Evaluation: the PRISM algorithm . . . 59
4.2.1 Two-Electron Repulsion Integrals . . . 59
4.2.2 PRISM and Cache Blocking . . . 62
4.2.3 Shell-Quartets for the Water molecule . . . 64
4.3.1 Microprocessors and Compilers . . . 66
4.3.2 Hardware Performance Counters . . . 67
4.3.3 Functional Cache Simulation . . . 67
4.3.4 Data Collection and Analysis . . . 68
4.3.5 Molecular Systems and Benchmarks . . . 68
4.4 PRISM and Cache Blocking . . . 69
4.4.1 SCF Execution Time as a Function of System Size and Basis Set for an SCF Cycle . . . 70
4.4.2 Effect of Cache Blocking on Cycle, Instruction Counts and Cache Misses 71 4.4.3 Effect of Cache Blocking on ERI Batching . . . 72
4.4.4 Cache Blocking as a Function of Quartet Type . . . 74
4.4.5 Cache Blocking as a Function of Benchmark Systems and Architecture 79 4.4.6 Summary: PRISM and Cache Blocking . . . 84
4.5 A Linear Performance Model . . . 84
4.5.1 Stability of PPCoeffs on the Opteron . . . 85
4.5.2 Accuracy of the LPM for the AMD848 Opteron . . . 86
4.5.3 Stability of PPCoeffs Across Different Hardware Architectures . . . 87
4.5.4 LPM Summary . . . 91
4.6 LPM and Functional Simulation . . . 93
4.6.1 Callgrind Validation . . . 94
4.6.2 A Parametric Cache Variation Study of PRISM’s performance . . . 97
4.6.2.1 Effect of Variation of Opteron Cache Associativity . . . 98
4.6.2.2 Effect of Variation of Opteron Cache Linesize . . . 98
4.6.2.3 Effect of Variation of the Total Data Cache Size for the Opteron 99 4.6.2.4 Breakdown of Cache Misses for the Variation of Linesize and Total Size . . . 100
4.6.2.5 Break-down Summary . . . 102
4.6.3 Variation of L1, L2 Linesize and Total Size for Three Hardware Archi-tectures . . . 102
4.6.4 Summary: Functional Cache Simulation and the LPM . . . 107
4.7 Related Work . . . 108
4.8 Summary, Conclusions and Future Work . . . 110
4.8.1 Future Work . . . 111
5 Study of Thread and Memory Placement Effects in Gaussian 113 5.1 Introduction . . . 113
5.2.1 Hardware Platform . . . 114
5.2.1.1 Coherent HyperTransport . . . 115
5.2.1.2 Topology . . . 116
5.2.2 Latency and Bandwidth Characteristics of the X4600 M2 . . . 116
5.3 Software environment, Benchmark systems, Gaussian modifications . . . 118
5.3.1 Software Environment . . . 118
5.3.2 Page Placement and Migration . . . 119
5.3.3 Test Molecular Systems . . . 119
5.3.4 Memory Allocation in Gaussian . . . 120
5.3.5 Modifications to Gaussian . . . 121
5.4 Effects of Thread and Memory Placement in Gaussian . . . 121
5.4.1 Thread, Memory and Cache Effects for Serial Gaussian . . . 122
5.4.2 Contention Classes for the X4600 . . . 123
5.4.3 Parallel HF Performance in Gaussian . . . 125
5.4.4 Summary . . . 129
5.5 Extending the LPM to Account for NUMA Effects . . . 129
5.5.1 Extending the LPM to incorporate NUMA effects . . . 129
5.5.1.1 Obtaining Cache misses by NUMA Domain . . . 130
5.5.1.2 The NUMA Extended LPM . . . 131
5.5.2 Single Threaded Placement Experiments . . . 133
5.5.3 Multi-Threaded, Single-Core Placement Experiments . . . 135
5.5.3.1 Two Threads, Single Core Thread Assignment . . . 136
5.5.3.2 Four and Eight Threads, Single Core Thread Assignment . . 137
5.5.4 Multi-Threaded, Dual-Core Placement Experiments . . . 139
5.5.4.1 Four and Eight Threads, Dual Core Assignment . . . 140
5.5.5 Accounting for Dual-Core contention . . . 140
5.5.6 Summary: NUMA and Multi-threaded Extended LPM . . . 142
5.6 Use of Page Migration to Affect Data Locality . . . 142
5.6.1 Data Placement Strategies . . . 143
5.6.2 Speedup Plots for Valinomycin and C60 . . . 145
5.7 Related and Previous Work . . . 147
5.8 Conclusions and Future Work . . . 151
6 Comparative Study of DFT Charges 153 6.1 Introduction . . . 153
6.2 Background . . . 155
6.2.2 Natural Population Analysis . . . 156
6.2.2.1 First-order reduced density matrix . . . 157
6.2.2.2 Natural Atomic Orbitals and NPA . . . 157
6.2.3 The Radial Distribution Function . . . 158
6.3 Experimental Details . . . 160
6.3.1 Test Molecular Systems . . . 160
6.3.2 Software and Methodology . . . 160
6.4 MPA and NPA Charges on K+ . . . 161
6.5 Relative Charge on Potassium . . . 162
6.6 Charges Binned with Respect to the RDF . . . 163
6.6.1 Breakdown of RDF Charges By Solvation Shell . . . 167
6.7 Density Plots for Charges . . . 169
6.8 Charge on K+ as a Function of Different Basis Sets . . . 170
6.9 Previous Work . . . 173
6.10 Conclusions . . . 174
7 Conclusions and Future Work 177 7.1 Summary of Contributions . . . 177
7.2 Discussion . . . 178
7.3 Future Work . . . 179
A Appendix 181 A.1 PAPI native hardware performance counter events . . . 181
A.2 lmbenchPlots . . . 183
A.2.1 AMD Opteron 848 . . . 183
A.2.2 AMD Athlon64 . . . 185
A.2.3 Intel NetBurst P4 . . . 186
A.2.4 Intel NetBurst EM64T . . . 187
A.2.5 Intel Pentium M . . . 188
A.2.6 IBM G5/PPC970Fx . . . 189
A.2.7 Sun UltraSPARC IIICu . . . 190
A.3 Water Clusters Used in this Thesis . . . 192
A.4 Python code used for generating the pair-wise RDF . . . 196
Bibliography 199
1. J. ANTONY, M. J. FRISCH,ANDA. P. RENDELL
Modelling the Performance of Gaussian Chemistry Code on x86 Architectures Proceedings of HPSC, 6 – 10 March 2006, Hanoi, Vietnam
http://www.springer.com/math/cse/book/978-3-540-79408-0
2. J. ANTONY, P. P. JANES, ANDA. P. RENDELL
Exploring Thread and Memory Placement on NUMA Architectures: Solaris and Linux, UltraSPARC/FirePlane and Opteron/HyperTransport Proceedings of IEEE HiPC 2006, 18 – 21 December 2006, Bangalore, India
http://dx.doi.org/10.1007/11945918_35
3. R. YANG, J. ANTONY, P. P. JANES,ANDA. P. RENDELL
Memory and Thread Placement Effects as a Function of Cache Usage: A Study of the Gaussian Chemistry Code on the SunFire X4600 M2 Proceedings of IEEE I-SPAN 2008, 7 – 9 May 2008, Sydney, Australia
http://doi.ieeecomputersociety.org/10.1109/I-SPAN.2008.13
4. A. P. RENDELL, J. ANTONY, W. ARMSTRONG, P. P. JANES, ANDR. YANG
Building Fast, Reliable, and Adaptive Software for Computational science Proceedings of SciDAC 2008, 13 – 17 July 2008, Seattle, Washington, USA
http://stacks.iop.org/1742-6596/125/012015
5. R. YANG, J. ANTONY,ANDA. P. RENDELL
A Simple Performance Model for Multithreaded Applications Executing on Non-Uniform Memory Access Computers
Proceedings of IEEE HPCC 2009, 25 – 27 June 2009, Seoul, Korea
http://dx.doi.org/10.1109/HPCC.2009.39
6. R. YANG, J. ANTONY,ANDA. P. RENDELL
Effective Use of Dynamic Page Migration on NUMA Platforms
Proceedings of IEEE I-SPAN 2009, 14 – 16 December 2009, Kaohsiung, Taiwan
http://doi.ieeecomputersociety.org/10.1109/I-SPAN.2009.127
1. Linear Scaling Algorithms and OpenMP
October 2003, Student Forum, APAC Conference, Gold Coast, Australia
2. Development of Efficient Multi-Threaded Applications for Modern Shared Memory
Ar-chitectures
February 2005, Seminar, Department of Computer Science, ANU, Canberra, Australia
3. Performance modelling of cache blocking on integral evaluation in Gaussian
August 2005, Seminar, Gaussian Inc., Wallingford, CT, U.S.A
4. Some aspects of Gaussian’s performance on the Intel Itanium Platform
August 2005, Seminar, Intel Compiler Group, Santa Clara, CA, U.S.A
5. Performance Modelling of Scientific Applications on HPC Platforms
October 2005, Student Forum, APAC Conference, Gold Coast, Australia
6. Gaussian Performance Modelling and NUMA Thread & Memory Placement
4 March 2006, Seminar, Sun Asia Pacific Science and Technology Center, Singapore
7. Modelling the Performance of the Gaussian Computational Chemistry Code on the x86
Architecture
6 – 10 March 2006, International Conference on High Performance Scientific Comput-ing, Hanoi, Vietnam
8. An update on: Gaussian Performance Modelling
7 June 2006, Seminar, Department of Computer Science, ANU, Canberra, Australia
9. Exploring Thread and Memory Placement on NUMA Architectures
18 – 21 December 2006, IEEE International Conference on High Performance Comput-ing, Bangalore, India
10. NUMALink, HyperTransport and Gaussian
8 April 2008, Seminar, ANU Supercomputer Facility, ANU, Canberra, Australia
11. Effective Use Of Dynamic Page Migration on NUMA Platforms
14 – 16 December 2009, IEEE I-SPAN Conference, Kaohsiung, Taiwan, R.O.C.
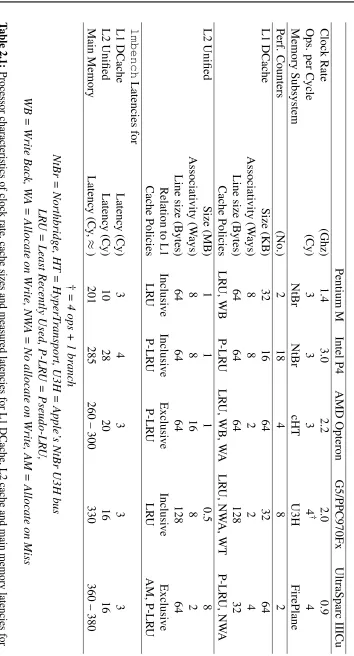
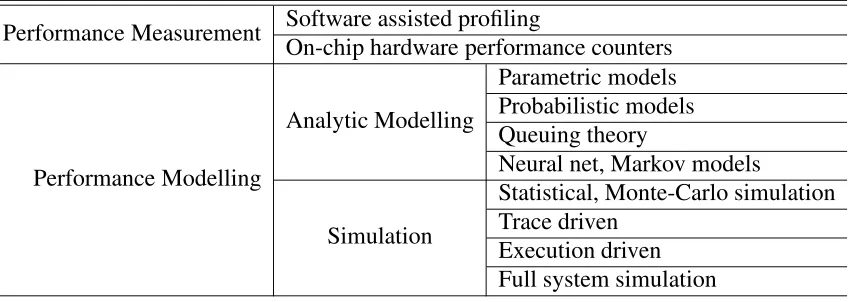
2.1 Processor characteristics of clock rate, cache sizes and measured latencies for L1 DCache, L2 cache and main memory latencies for the microprocessors used in this thesis. . . 18 2.2 Classification of performance evaluation techniques . . . 19
3.1 Main Memory latencies (Cycles) fromlmbench. The pointer chasing bench-mark from lmbench is used to determine memory latencies. Results were obtained for the Opteron and V1280 platforms by pinning a thread on a given node and placing memory on different nodes. . . 48 3.2 Stream benchmarks . . . 48 3.3 Serial Stream bandwidths (GB/s) for the Opteron and V1280 systems. A
single thread was pinned to a given node and had its memory placed on differ-ent nodes. Best and Worst refer to thread and memory placemdiffer-ents which are expected to give the best and worst possible performance (See text for details). 48 3.4 ParallelStreambandwidths (GB/s). Threads were pinned to various nodes
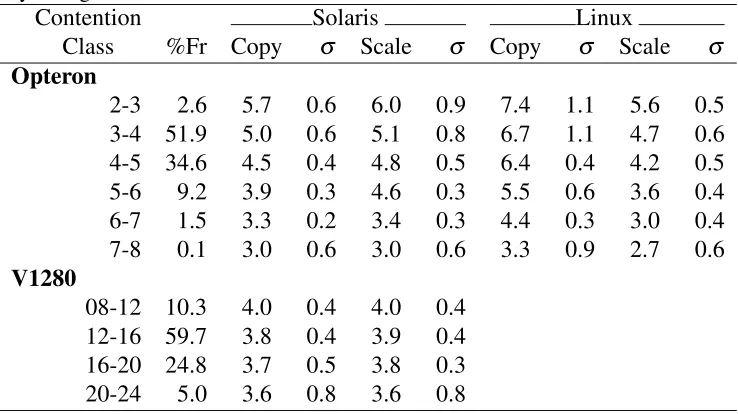
and had its memory placed locally (“Best”) or remotely (“worst”). Four threads were run concurrently for the Opteron while twelve threads were run concur-rently for the V1280 system. . . 49 3.5 Copy and Scale (GB/s)Streambenchmark results for the placement
distribu-tion model. Contendistribu-tion classes denote the ranges of link contendistribu-tion for all the nodes in the system. %Fr gives the frequency of occurrence of a given class in percent. The standard deviation (σ) for Copy, Scale are for twenty random samples from each contention class. Each thread and memory configuration was run ten times. . . 52
3.6 BLASStreamTriad, Level 2 BLAS, Level 3 BLAS (GigaFlops) results for
the placement distribution model. Results are averages for twenty random gen-erated configurations per contention class. Each configuration was run twenty times. Tr = Triad; B2 = BLAS Level 2; B3 = BLAS Level 3. . . 54
4.1 Decomposition of 6-31G* basis functions on a Water molecule . . . 61
are available at the Fock matrix formation stage. . . 65 4.3 Characteristics of microprocessors used in this study . . . 66 4.4 Test molecular systems . . . 68 4.5 Execution times of two test systems for one SCF cycle on the AMD848
Op-teron, using the HF method . . . 69 4.6 Execution characteristics for PRISM with the k300a-04 water-cluster system
using HF/6-31G* on a 2.2Ghz AMD848 Opteron. . . 71 4.7 Variation in the number of batches with varying blocking factors for the
k300a-04 system using a 6-31G* basis set with the HF method. Data obtained from one SCF cycle. . . 72 4.8 Cycle count per LTot for k300a-04 using HF/6-31G* on a 2.2Ghz AMD848
Opteron . . . 73 4.9 Optimal cache blocking factor observed for the five test systems, across six
processor platforms . . . 81 4.10 Timing differences for a 32Kw blocking factor versus a 64Kw blocking factor,
expressed as a percentage. . . 82 4.11 Measured PPCoeffs for the AMD848 Opteron using the LPM using the HF
method . . . 85 4.12 Cycle count fitting errors for the LPM on the Opteron, whenβ is ignored, for
the HF method . . . 86 4.13 Measured LPM PPCoeffs, CPI and L2 latency characteristics across processors
and test systems for the HF method . . . 88 4.14 Measured LPM PPCoeffs, CPI and L2 Latency characteristics across
proces-sors and test systems for the B3LYP method. . . 90 4.15 Self-fitting errors for the HF and B3LYP methods using the LPM . . . 91 4.16 Percentage average error (%AE) for Transferability and for using Averaged
PPCoeffs . . . 92 4.17 Valgrind/Callgrind hardware cache configuration . . . 97 4.18 Effect of variation in cache associativity of the L1ICache, L1DCache and
eters are held constant as given in Table 4.17. Cycle counts are x1010. . . 99 4.20 Variation of L1, L2 cache size for the Opteron using k300a-04/6-31G* . . . 99 4.21 Variation of L1 and L2 Linesizes and L2 Total size for the AMD Opteron,
using k300a-04/6-31G* . . . 101 5.1 Latency and Bandwidths for specific memory and thread placement on the
SunFire X4600 M2, usinglmbenchand the Stream Triad benchmark. Pro-gressively darker shades of grey are used to indicate accesses that are in the same NUMA level. . . 117 5.2 Summary of Table 5.1 categorized by NUMA level. Units for ‘Average
La-tency’ is in Cycles; ‘Average Bandwidth’ is GB/sec. Standard deviations (σ) for both are also given. . . 117 5.3 Highest and lowestStreambandwidths (GB/s) for a single thread on the
Sun-Fire X4600 M2 . . . 118 5.4 Elapsed time (sec.) for a sequential Gaussian SCF process on a
18-Crown-6 Ether molecule using HF/18-Crown-6-31G*. Timings for the 18-Crown-64Kw and 128Kw (in brackets) cache blocking factors are presented as a function of memory and thread placement on the SunFire X4600 M2. Progressively darker shades of grey are used to indicate similar NUMA levels. . . 122 5.5 Summary of Table 5.4 categorized by NUMA level. Units for ‘Average
La-tency’ is in Seconds. Standard deviations (σ) is also given. . . 124 5.6 Analysis of thread and memory placement distributions by contention class,
using the PDM for the SunFire X4600 M2 . . . 124 5.7 Elapsed time for the first three SCF iterations, as a function of memory and
thread placement for a parallel Gaussian calculation on the Valinomycin molecule using HF/3-21G. . . 126 5.8 Measured and modelled results in seconds for single-thread calculations for
Exp 1 – 4 obtained for first SCF cycle, on the SunFire X4600 M2 system. . . . 134 5.9 The average Speedup Sn and its standard deviation (σ) for n-thread
calcula-tions with ideal local access to both Density and Fock matrices/blocks. . . 136 5.10 Modelling error in percent for 2-thread calculations performed at each NUMA
level using fn, for single core thread assignment . . . 137
5.11 Modelling error in percent for 2 thread calculations using fn and dual-core
6.1 Mulliken Charges (au) obtained using HF and the B3LYP DFT functional on a K+ ion positioned at two locations (Point B, Point C). The 6-31G* basis set was used for both methods. Reproduced from Table 5 in [28]. . . 154 6.2 Charge on K+ for the k300c-08 system using eight basis sets for the HF, BLYP
2.1 The von Neumann Architecture . . . 6 2.2 The Memory Hierarchy Architecture. Adapted from [32]. . . 9 2.3 The MOESI Protocol states and transition conditions. If, for a given cacheline,
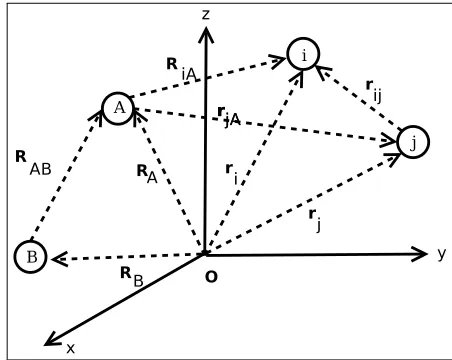
a processor experiences a cache-miss a probe message is sent to other caches to obtain the required cacheline. From [5]. . . 14 2.4 UMA and NUMA organization of shared memory systems [131] . . . 16 2.5 A molecular coordinate system where i, j denote electrons and A, B denote
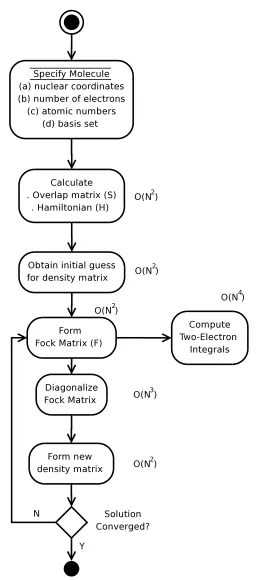
atoms. From [271]. . . 24 2.6 Activity diagram for the SCF procedure and computational complexity for key
steps. . . 28 2.7 The McMurchie-Davidson ERI scheme. From [229]. . . 31 2.8 The MD-PRISM ERI scheme. From [229], [92] . . . 33 3.1 (a) Schematic diagram of the V1280 UltraSPARC platform and (b) Celestica
Opteron platform . . . 46 4.1 Per LTot breakdown of cycle counts and total cache misses (L1 and L2) for the
k300a-04 water cluster system using a 6-31G* basis set and the HF method on an AMD848 Opteron system. . . 76 4.2 Per LTot breakdown of cycle counts and total cache misses (L1 and L2) for the
k300a-08 water cluster system using a 6-31G* basis set and the HF method on an AMD848 Opteron system. . . 78 4.3 FLOP count per LTot for the k300a-04 and k300a-04 water cluster systems
using the HF method on a 2.2Ghz AMD848 Opteron processor . . . 80 4.4 Plots for instruction counts obtained from simulation and hardware
perfor-mance counters for k300a-04/6-31G*. Simulation results were obtained using Valgrind/Callgrind. . . 93 4.5 Plots for total L1 Misses obtained from simulation and hardware performance
counters for k300a-04/6-31G*. Simulation results were obtained using Val-grind/Callgrind. . . 95
4.6 Plots for total L2 Misses obtained from simulation and hardware performance counters for k300a-04/6-31G*. Simulation results were obtained using Val-grind/Callgrind. . . 95 4.7 Plots for Cycle counts obtained from simulation and hardware performance
counters for k300a-04/6-31G*. Simulation results were obtained using Val-grind/Callgrind. . . 96 4.8 Valgrind/Callgrind cycle count results for varying L1 linesize (Bytes) for
k300a-04/6-31G*. . . 104 4.9 Valgrind/Callgrind cycle count results for varying L2 linesize (Bytes) for
k300a-04/6-31G*. The magnitude of contour line values is x1010 . . . 105 4.10 Valgrind/Callgrind cycle count results for varying L2 size (MB) for
k300a-04/6-31G*. . . 106 5.1 Architecture of the Opteron 800 series processor [56] . . . 115 5.2 Architecture of the SunFire X4600 M2 . . . 116 5.3 Memory allocation in Gaussian and subsequent use of the Density and Fock
matrices . . . 120 5.4 Speedup results for unmodified Gaussian 03 code compared to sets 1 – 4 for
two cache blocking factors (64Kw, 128Kw). Times obtained are for the first three SCF cycles for using Valinomycin, the HF method and a 3-21G basis set. Note speedups for both cases are relative to different timings, with 64Kw being faster than 128Kw. . . 128 5.5 Modelling error for 4, 8 thread calculations at each NUMA level
correspond-ing to: (a) PRISM from Exp 1; (b) PRISMC from Exp 2; (c) CALDFT from Exp 2; (d) PRISM from Exp 3; (e) PRISMC from Exp 4 and (f) CALDFT from Exp 4 . . . 138 5.6 Modelling Error for 4, 8 thread calculations using fnat each NUMA level: (a)
PRISM from Exp 1; (b) PRISMC from Exp 2; (c) CALDFT from Exp 2; (d) PRISM from Exp 3; (e) PRISMC from Exp 4 and (f) CALDFT from Exp 4 . . 141 5.7 Node Mappings used for the Density and Fock matrices . . . 144 5.8 Speedup plot for Valinomycin using a 6-311G* basis set and HF, BLYP, B3LYP
methods. . . 146 5.9 Speedup plot for C60 using a cc-PVTZ basis set for the HF, BLYP, B3LYP
methods. . . 148 6.1 Schematic illustration of the KcsA potassium ion channel showing the location
6.2 Radial distribution function determined from a 100 ps molecular dynamics simulation of liquid argon at a temperature of 100 Kelvin and a density of 1.396 g/cm3. Taken from [156]. . . 159 6.3 Charge on K+ for the k300c system . . . 161 6.4 Variation of relative charge as a function of distance from K+ for the k300c-12
system. . . 164 6.5 RDF and MPA, NPA Charges for k300c-12 obtained for the HF, BLYP and
B3LYP methods. Binning width is 0.5 ˚A . . . 166 6.6 MPA and NPA charges per RDF shell for all 12 ˚A systems, using a 6-31G*
basis set. . . 168 6.7 Spherical integration of k300c-12 electron density obtained using a 6-31G*
CGTO . . . Contracted GTO DCache . . . Data Cache
DFT . . . Density Functional Theory DLP . . . Data Level Parallelism ERI . . . Electron Repulsion Integrals FIFO . . . First-In First-Out
FMM . . . Fast Multipole Method GTO . . . Gaussian Type Orbital HF . . . Hartree-Fock
HWPC . . . Hardware Performance Counters ICache . . . Instruction Cache
ILP . . . Instruction Level Parallelism ISA . . . Instruction Set Architecture K.E. . . Kinetic Energy
LRU . . . Least Recently Used MD . . . McMurchie-Davidson MO . . . Molecular Orbital
MPA . . . Mulliken Population Analysis NPA . . . Natural Population Analysis NUMA . . . Non-Uniform Memory Access PDM . . . Placement Distribution Model PGTO . . . Primitive GTO
RDF . . . Radial Distribution Function SCF . . . Self-Consistent Field
TLB . . . Translation-Lookaside Buffer TLP . . . Thread Level Parallelism UMA . . . Uniforma Memory Access
Introduction
Obtaining good performance from scientific applications which execute on parallel, shared memory, multi-core systems is a non-trivial exercise in multivariate optimization arising from the complexities of on-chip memory hierarchies, influence of architectural techniques designed to boost on-chip performance and inherent latencies imposed by underlying hardware intercon-nect. Further, the commoditization of NUMA architectures coupled with multi-core proces-sors have now enabled end-users access to systems with high core counts and large shared memory systems, previously accessible only at dedicated supercomputing facilities. The confluence of multi-core chip architectures and NUMA interconnect technologies exacerbate the already complex task of single threaded performance tuning. Thus, the development of NUMA performance analysis methodologies and allied performance models which can predict application performance as a function of system architecture is timely.
Electronic structure codes are computationally intensive scientific applications routinely used by chemists, biologists, physicists and others for the ab-initio (i.e. first-principles) study of matter at the atomic level. In this work we use the Gaussian electronic structure code [89], which is currently one of the most widely used shared-memory parallel electronic structure codes. We focus on its implementation on current commodity, multi-core, NUMA hardware platforms. Often the execution times, for these codes, may take in the order of weeks on a single processor system. Moreover, grand challenge problems in the computational chem-istry area requires the development of linear scaling algorithms that map efficiently onto the underlying parallel hardware. In both cases it is important that the underlying code performs efficiently on the processor architecture being used.
1.1
Original Contributions
This thesis makes the following original contributions –
• Performance characterization of commodity NUMA hardware platforms using latency (lmbench), bandwidth (Stream) and BLAS kernels (Level 1, 2, 3) as a function of thread
and memory placement.
• Performance characterisation of the PRISM Electron Repulsion Integral (ERI) evalua-tion algorithm used in the Gaussian electronic structure code in terms of platform inde-pendent and deinde-pendent components.
• Use of a linear performance model for ERI evaluation. Validation of this model across four microprocessor architectures and seven individual microprocessors.
• Use of the linear performance model with functional cache simulation to predict the performance of the PRISM ERI algorithm as a function of cache configuration.
• Identification of key cache parameters which influences the performance of ERI evalua-tion on cache based architectures. Characterisaevalua-tion of the cache miss components which limit PRISM’s performance and proposals to improve performance.
• The extension of the single-threaded LPM to account for NUMA and thread, memory placement. The extension is validated and used to assess the performance of parallel Gaussian.
• An assessment of the use of dynamic page migration and node interleaving to improve data locality and reduce contention in the Gaussian code.
• Characterisation and analysis of the atomic charges obtained from density functional methods for a solvated potassium ion in a large water complex.
• Demonstration of the basis set sensitivity if atomic charges are computed using density functional wavefunctions.
1.2
Organization of Thesis
Background
Modern microprocessors are complex marvels of silicon engineering. In 2009 the most com-plex processor contains two billion transistors [257], operates at 4Ghz [60, 155] and incorpo-rates large on-chip caches [233]. These microprocessors can execute on the order of several billion instructions in one second [163], they employ multiple levels of cache memory and a host of micro-architectural techniques to ensure the processor does not stall. In turn this complexity makes the analysis and modelling of application performance very difficult.
This thesis aims to construct performance models for electronic structure codes. In this Chapter a review of microprocessors technologies, and performance evaluation techniques are given. The chapter then introduces the electronic structure methods used in this thesis namely the Hartree-Fock method and Density Functional theory methods.
2.1
Microprocessors, Caches, Interconnects
This section reviews microprocessor concepts – the CPU, cache memory, multiprocessor sys-tems and hardware performance counters. For in-depth discussions of computer organization and architecture, Hennessy and Patterson’s texts [113, 209] are recommended.
A microprocessor is the physical embodiment of a Turing machine [283] which has the features of a Central Processing Unit (CPU) on an integrated circuit. The CPU operates on instructions defined by an Instruction Set Architecture (ISA). It works in a loop where in-structions and data undergo the following four steps: fetch, decode, execute, retire/write-back. Instructions are fetched from main memory then decoded, leading to data operands of the instruction being fetched. Once the required data operands are on-chip, the instruction is ex-ecuted by the CPU and the instruction is retired i.e. the resulting data from the execution is stored back into main-memory. If data and instructions are both stored in main memory, the system is referred to as being a von Neumann architecture [42]. Whereas if data and instruc-tions are stored separately from each other, it is referred to as a Harvard architecture [219].
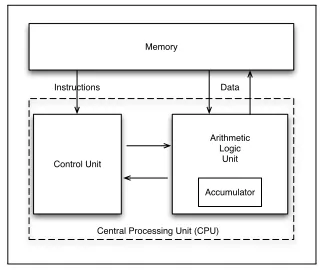
The von Neumann architecture (Figure 2.1) imposes a separation between the CPU and
Control Unit
Arithmetic Logic
Unit
Accumulator
Central Processing Unit (CPU) Memory
[image:34.595.196.357.111.246.2]Instructions Data
Figure 2.1: The von Neumann Architecture
memory i.e. data needs to be explicitly moved from main memory into the on-chip registers for use. This leads to the von Neumann bottleneck where the limiting factor becomes how fast data can be moved to and from memory. This limitation led to the use of interposing cache memory [107] between main memory and the CPU. In effect, caches help circumvent the von Neumann bottleneck as the vast majority of memory and instructions have locality [66] both in space and time. This locality means a given working set could reside in fast cache memory and thus mitigating the time taken to fetch data from main memory. The use of cache is also one of the means of shielding the CPU from what is termed the “memory wall” [181], where the rate of increase in microprocessor speed/innovation outstrips improvements made in Dynamic Random Access Memory (DRAM) technology. This leads to DRAM speeds impacting CPU performance as the faster CPU (operating on the order of Ghz) is stalled waiting for memory requests to be satisfied from the slower DRAM (operating in the order of hundreds of MHz). In addition to employing caches, processors also use a host of other micro-architectural features to extract instruction and data parallelism as well as exploiting thread-level parallelism. All these concepts, which are critical to the efficient operation of a modern microprocessor are briefly outlined in the following sections.
2.1.1
On-Chip Parallelism
In order to increase performance modern microprocessors extract parallelism from the instruc-tion stream using a range of techniques which can be classified as, Data Level Parallelism (DLP) , Instruction Level Parallelism (ILP) and Thread Level Parallelism (TLP).
2.1.1.1 Data Level Parallelism
on data items in parallel using extensions to their ISA and two examples are Intel’s SSE [259] for the x86 ISA and IBM’s AltiVec [193] for the PowerPC ISA.
2.1.1.2 Instruction Level Parallelism
Instruction Level Parallelism (ILP) are a host of techniques which attempt to increase the number of instructions that can be in flight at any given time so as to increase the utilization of on-chip hardware resources. Instructions can either be retired ‘in-order’ or ‘out-of-order’ and most processors use the former. These techniques include:
Super scalar execution Multiple execution units execute instructions in parallel, subject to data dependencies [313]. Multiple instructions are decoded and sent to a dispatcher, which queues instructions and releases groups of instructions for execution once it has determined there are no data dependencies in the instructions being dispatched to on-chip execution units. This in effect allows a microprocessor to execute more than one instruction per cycle.
Instruction Pipelining Instruction pipelining divides the processing of an instruction into multiple independent stages [222]. Once a task completes its initial step, it gets fed into the next stage of the pipeline. This process allows multiple instructions to be over-lapped.
Out-of-order Execution Out-of-order execution [251] is a technique which allows a pro-cessor to continue executing instructions without data dependencies, out-of-order from their original program order. This in turn allows the processor to: (a) permit better use of multiple functional units i.e. increasing throughput; and (b) avoiding expensive stalls. The processor fetches instructions, dispatches these to an instruction queue. Instruc-tions are ready for issue once their inputs are ready. At this point, instrucInstruc-tions which do not have dependencies can be issued out-of-order with respect to the instruction stream. Once instructions have been issued, their results are retired.
sched-uling by the dispatcher increase and allows for useful work to be carried out prior to the branch being resolved.
2.1.1.3 Thread Level Parallelism
Thread Level Parallelism (TLP) techniques refer to the use of multiple threads of execution to better facilitate on-chip resource utilization. One TLP approach is to have a microprocessor execute a set of multiple threads and when any one thread experiences a long latency event like a stall when data is retrieved from main memory, the microprocessor performs a context switch to another thread which is ready to execute [149, 202].
HyperThreading [150, 173] is a special case of TLP implemented per core in a micropro-cessor. A processor’s on-chip hardware resources which stores architectural state (i.e. the current program counter and set of registers) is divided amongst two or more threads of exe-cution. Execution resources (e.g. Floating Point Units) are not divided amongst the threads. When an executing thread experiences a stall, the processor core switches to executing the other thread.
The UltraSPARC T1 Niagara [149] chip uses a different strategy to exploit TLP. The T1 has eight cores each of which can support eight threads of execution, allowing for a total of 64 threads per CPU. Each core acts as a barrel processor which selects instructions to execute amongst the eight threads it has assigned to it. If a thread experiences a stall event it is made unavailable for execution which the stall is resolved, execution continues using instructions from other threads.
2.1.2
Cache Memory Structure
Cache memory [107, 250] is fast, intermediate memory interposed between the microproces-sor and main memory. Caches are designed to be faster than the backing storage it fronts which leads to a higher cost per bit. There is no functional difference between a CPU directly accessing memory and going via a cache. This requires the cache to implement some form of consistency model to ensure that the results obtained are identical without the presence of cache memory. Cache consistency is discussed in detail in Section 2.1.4.
The working set is defined as the subset of pages from main memory that is mapped into cache for use by the application executing on the microprocessor. A given cache needs to be large enough to encompass the working set of both instructions and data being used by an application, whereby there is an increased likelihood of both the CPU’s reads and writes being satisfied from cache.
Virtual Memory swap file (on disk)
Main Memory
Memory Page L2 Cache . . . .
L1 Cache
. . . .
Fast Data Path
. . . .
Registers
CPU
TLB Phys Virt
System Bus
CPU Die
L2 Cache Line
L1 Cache Line
On-Chip
Bus
Branch Prediction
Super Scalar Issue Out of Order
[image:37.595.114.528.87.422.2]Execution Cache Coherency
Figure 2.2: The Memory Hierarchy Architecture. Adapted from [32].
which take on the order of 300 CPU cycles to read. All loads and stores issued by the CPU transit via the cache. Caches are part of a storage hierarchy for CPUs, as seen in Figure 2.2. Here, it can be seen that caches are organized in tiers i.e. L2 (Level 2) cache and L1 (Level 1) cache. Pages in main memory (pages are typically 4K or 8K in size and main memory is in the order of Gigabytes of DRAM) are mapped onto locations within the highest level of cache (in this case L2), which can range from 1MB to 30MB [183, 257]. Data from L2 then gets mapped into L1 (typically on the order of 32Kb to 64Kb), which then get forwarded into registers on the CPU for execution. This spread of cache structures is done to speed-up access to data, exploit locality and importantly to optimize most of the on-chip memory as caches occupy up to half of the surface area in a CPU die.
2.1.2.1 Capturing Locality
Caches are beneficial if access to program data exhibits ”locality” [66]. Three different types of locality are often defined [131],
each iteration of a loop.
Spatial Locality Spatial locality refers to detecting and responding to streams of data and/or instructions which are spatially close in memory to each other, e.g. linear data stored in an array being operated on within a loop nest.
Algorithmic Locality Algorithmic locality [131] is more subtle. It occurs when an algo-rithm repeatedly executes specific code or repeatedly accesses specific data blocks and these blocks are distributed widely throughout main memory. While the overall result is program behavior which is predictable, its repeatability cannot be detected by on-chip locality detection mechanisms1. It is often difficult to detect using current cache controlling hardware which usually relies on detecting regular strided access patterns. Also, increasing the size of on-chip caches by a factor of two or more does not lend to capturing algorithmic locality, as the code and data blocks involved often exceeds the capacity of the on-chip cache. Some examples of applications which perform repeated operations on large datasets are computer graphics applications, computer simulators and quantum chemistry applications. In order to exploit this type of locality compiler and user-level intervention is needed, usually by carefully placed pre-fetch instructions. Pre-fetch instructions are those which request the memory subsystem to initiate a fetch of cachelines prior to their use. If timed correctly, it can result in algorithms that can tolerate long latencies.
2.1.3
Primary Cache Characteristics
As mentioned caches store copies of data from a higher level of the memory hierarchy. This data is arranged in cachelines or blocks representing consecutive main memory addresses. The defining features of any cache organization are [32, 107],
Cache size Cache capacity is the maximum usable capacity of the cache.
Line size Line size is the smallest unit of data transferred either between caches or into a cache.
Associativity As cache memories are two orders of magnitude smaller than main memory, mapping schemes are used to map main memory locations into cache. Cache associa-tivity refers to the various options a replacement scheme has for locating a cacheline in the cache. This is further detailed below.
1On-chip logic detects strides in data or instruction streams and initiates prefetching as per the nature
2.1.3.1 Cache Associativity
As mentioned above cache associativity refers to the various options a replacement scheme has in replacing cachelines in cache with lines from main memory. These can be broadly categorized under the following three headings, Direct mapped: A Direct mapped cache is one where a main memory address maps to only one cacheline within the cache. This implies multiple locations in main memory can map onto the same cacheline.
Fully associative: A Fully associative cache is one where a main memory address can map onto any cacheline within the cache. When an address is requested from the cache, there is a directory look-up operation to find the required line. Thus a fully associative cache behaves as a hardware database [131] i.e. a cacheline can be placed at any cacheline storage location. Searching the cache for a given cacheline requires checking each cacheline being stored in cache. As in the case of the direct mapped caches, cache lines from memory can get mapped onto the same location, but conflicts are much less likely.
Set associative: Set associate caches behave as fully associative caches with the modi-fication that a cacheline can reside in one of a fixed set of cacheline locations. A set of bits from a cacheline’s address are used to index a cache directory, and for each address there are N sub-caches into which the cacheline could potentially reside. Thus a 4-way set associative cache can place a cacheline in one of 4 different locations in cache.
2.1.3.2 Types of Caches
On modern microprocessors there three independent caches – Instruction cache (ICache), the Data cache (DCache) and the Translation-Lookaside Buffer (TLB) cache. Separate L1 ICache and L1 DCaches is reminiscent of the Harvard architecture, where instructions to be fed to the CPU core are store in the L1 ICache and data in the L1 DCache. The L1 ICache is read-only, whereas the L1 DCache is read-write. The L2 cache is a unified cache which stores both data and instructions. Its function is similar to memory in the von Neumann architecture. The TLB cache is used in caching translations between real and virtual addresses; this is used to speed up translations of mappings between memory locations referenced in a program versus its actual physical location.
2.1.3.3 Cache Replacement Policies
Random replacement as the cache’s associativity increases. FIFO caches are often used in embedded and resource constrained microprocessors [249].
2.1.3.4 Cache misses and Cacheline eviction
If a cacheline is required but is not present in the cache, a cache miss is said to occur. Two types of cache misses are usually identified and occur when cachelines need to be read or written to i.e read misses and write misses respectively. On a read miss, the L1 and L2 caches are searched for the cacheline. A cache hit results if it is found, else the cache miss is then forwarded to the memory sub-system to fetch the required cacheline. On a write-miss the cache has two options depending on its implementation, either it allocates a cacheline (write allocate) or it by-passes the cache and goes to main-memory (no write allocate). Usually write back caches implement a write allocate for write-misses and write through caches will be no write allocate. Cache misses can be classified [72, 133] as
Cold misses Cold misses or compulsory misses occur the first time data is referenced by the CPU and needs to be fetched from main memory.
Capacity misses Capacity misses occur due to the limited size of the cache i.e. data being referenced by the CPU exceeds the capacity of the cache resulting in lines being evicted from cache.
Conflict misses Conflict misses occur when references are made to cachelines which map onto the same set (i.e. in set-associative caches) and causes cachelines already resident in the cache to be evicted. If the evicted line is re-referenced within some short period of time, it constitutes a conflict miss.
2.1.4
Cache Coherency and Memory Consistency in
Multiproces-sor Systems
Shared-memory processing environments are created by using groups of microprocessors which are able to access global shared memory via some interconnect. A key driving factor in the evolution of shared-memory multiprocessors was the observation that multiple levels of cache reduced the memory bandwidth requirements of each processor [99], allowing for multiple processors to use the same memory bus [113]. Introduction of caches into multiprocessor systems introduces two problems namely, (a) how does a processor know when a cacheline of interest to that processor is being used by another processor and (b) what a processor can infer about operations of a remote processor by observing the ordering of data reads and writes of the remote processor to main memory.
Problem (a) is addressed by a cache coherency scheme and problem (b) relates to the particular memory consistency model which has been implemented.
Cache coherency is defined by Jacob [131] “In the presence of a cache, reads and writes behave (to a first order) no differently that if the cache were not present”. As a cache is interposed between a CPU and memory it needs to ensure the processors’ view of memory is consistent with respect to data being cached i.e. data written to in a cache is guaranteed to be committed to memory and thus visible to all other processors. To enforce cache consistency, a cache coherency policy is defined which ensures that there is one globally unique, well-defined value associated with any given memory location.
A memory consistency model for a shared-memory multiprocessing system, ”is a formal specification of how the memory system will appear to the programmer” [6]. The mem-ory consistency model determines how a store operation in one thread of execution is made visible to the load operation of another thread, as well as implications about other load and store operations in both threads. All modern microprocessors implement some variation of a relaxed consistency model which allows for reads and writes to complete out-of-order, but also provides synchronization primitives to enforce ordering between multiple threads of ex-ecution [113]. This involves the use of hardware memory control and atomicity preserving operations such as: fenceon the x86 ISA,syncon the POWER ISA, andmembaron the SPARC ISA.
2.1.4.1 Cache Coherency Protocols
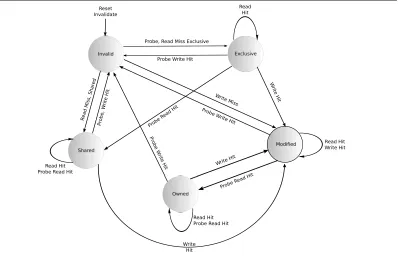
Figure 2.3: The MOESI Protocol states and transition conditions. If, for a given cacheline, a processor experiences a cache-miss a probe message is sent to other caches to obtain the required cacheline. From [5].
hardware coherence mechanism must be used. The MESI [124] and MOESI protocols are two examples of widely used coherency mechanisms. The MOESI protocol [270] is of interest in this thesis as it is implemented by two of the platforms used in this thesis, for which more details are presented in Section 2.1.7. Every cacheline is tagged using state bits to represent its most current state as part of the coherency protocol, in effect the coherency protocol is a per cacheline state-machine allowing the processor to implement cache consistency.
The MOESI protocol, shown in Figure 2.3, has the following states: Modified, Owned, Exclusive,Shared andInvalid –
Invalid Cachelines marked as invalid do not hold valid copies of data. All cacheline entries in the cache start off in the invalid state. Cachelines can also enter an invalid state once invalidated i.e. it transitions from one of the other states. Valid data for a cacheline resides either in main memory or in another processor’s cache.
Exclusive A cacheline in the exclusive state is exclusive to that particular cache i.e. it is the most current copy of the cacheline and is not in any other cache. Read misses, if serviced from memory cause cache lines to be marked as Exclusive as these cachelines are newly fetched directly from memory.
made modifications to that line i.e. if the cache gets a write hit. Future write hits will set the cache line in the Modified state. If the cacheline needs to be evicted, it is transitioned from the Modified state into Invalid.
Shared A Shared cacheline is one which has not been modified and is in cache, but could exist in another processor’s cache. A read-miss on a Modified cacheline will lead to a transition into the Shared state. A read-miss response from another cache will also cause the cacheline state to transition to Shared.
Owned A Modified cacheline can transition to the Owned state when the cache forwards the cacheline to another requesting cache, thus by-passing the backing store. The Owned state allows for a cacheline to be replicated to other caches (which hold it in the Shared state). The cache that owns the cacheline is permitted to modify Owned lines only.
2.1.5
Memory Structures
There are two broad classifications for cache coherent multiprocessor systems – UMA and NUMA. Uniform memory access (UMA) and Non-Uniform Memory Access (NUMA) are two techniques used to create shared memory systems. In this thesis both types of shared memory systems are used.
UMA refers to a shared memory system where each processor can access main mem-ory with the same fixed latency. UMA machines are also referred to as Symmetric Multi-Processors (SMP). UMA systems (Figure 2.4 (a)) either use a bus based [217] or cross-bar [13] to connect the processors. In bus based systems cache coherency is implemented by having individual processors monitor or snoop the bus [102]. This allows processors to make state transitions for its cachelines in accordance with the hardware coherency protocol as shown in Figure 2.3. Bus based approaches [159] are inherently unscalable as coherency traffic limits the number of shared processors that can effectively use the shared bus.
In NUMA systems the time taken to access main memory is non-uniform i.e. cache misses for data that is not local to a processor have higher latencies than those which are in remote memory (Figure 2.4 (b)). While coherency traffic in a NUMA system can also be implemented by using a broadcast across a shared bus, it can be also be implemented using a more scalable directory based approach [58]. In directory based approaches there is an in-memory directory (implemented as a bitmap) representing cachelines and at which processor these are being cached in. Although this can be implemented as one central directory, it can quickly become a bottleneck and thus most modern directory based cc-NUMA2(e.g. the SGI Altix [166, 234])
use a distributed directory approach. Here each processor is responsible for maintaining the
CPU 0 CPU 1
. . .
CPU nMain Memory
CPU 0 CPU 1
. . .
CPU nMemory Memory Memory
(a) UMA (b) NUMA
Figure 2.4: UMA and NUMA organization of shared memory systems [131]
coherency state of its local memory. If a processor requires a cacheline and it is not to be found in its local caches or memory, the processor (or its proxy3) directly contacts the foreign processor which manages the memory in which the required cacheline resides. Writes to the cacheline by a remote processor are forwarded to the owning processor, which in turn sends invalidation messages to other processors that might be having copies of the cacheline. This decentralization of the cache directory results in less overhead compared to a centralized directory.
2.1.6
Hardware Performance Counters
As evident from preceding sections modern microprocessors are extremely complex systems. To aid both end-users and engineers in understanding the performance of applications execut-ing on these systems all modern microprocessors have a set of dedicated on-chip and off-chip registers for performance monitoring [3,125,126,128,187,267]. These registers, which are re-ferred to as hardware performance counters (HWPC), are initialized to record a pre-defined set of hardware performance events [79, 255]. Performance events, like Cycle counts and total L1 data cache misses, are sometimes counter specific and often some events cannot be measured in conjunction with others [199]. This arises from decisions made at the design stage of the microprocessor in order to (a) reduce the overhead of implementing the performance counter infrastructure in silicon and (b) conserving the on-chip transistor budget for other features.
On configuring the on-chip counters the microprocessor increments the HWPC(s) for the specific set of event(s) of interest. All microprocessors support delivery of signals either to an operating system handler or user space handler in the event any register overflows. Hardware counters can measure performance events for code which is either in user-space, in the kernel or both. Performance counters can be used to either obtain absolute event counts [79] or sample for events based on overflow of the underlying counter or to generate an interrupt if there has been a fixed number of events that have occurred [39].
Often hardware performance counters are exposed via libraries to shield end users from the complexity of managing the processes by which HWPCs need to be initialized and accessed. This process is often different between processors from the same vendor. PAPI [37] is cross platform performance counter library which exposes a uniform API and runs across multiple microprocessor types (Intel, AMD and PowerPC). PAPI also supports hardware performance counter event multiplexing [7,69]. This uses an event sampling approach to enable more events to be counted than there are available hardware registers. Events counted using multiplexing will therefore have some statistical uncertainty associated with them. Within discrete periods of time a set of events are monitored, recorded, the counters are reset for the next set of events and the process continues. Care must be taken as this process can introduce errors if the short code segments are being measured or a large number of events are sought [19, 176].
2.1.7
Microprocessors Used in This Thesis
Table 2.1, lists processor and cache characteristics for the microprocessors used in this the-sis. The memory latencies given in the table were measured quantities, using thelmbench
pointer chasing benchmark [184]. Five different processors were chosen the Intel Pentium M, P4; AMD Opteron; IBM G5/PPC970Fx; and the Sun UltraSPARC IIICu (USIIICu). All processors use out-of-order execution except the USIIICu, which is an in-order processor. The processors have a range of clock frequencies ranging from 900Mhz to 3Ghz. All processors are superscalar: the x86 processors can issue 3 instructions per clock cycle, whereas the G5 and USIIICu can issue 4 instructions per cycle.
The Intel x86 processors and the G5 system have a UMA architecture and use a north-bridge [217] chipset to link memory and processors. The AMD Opteron system has a NUMA architecture that also uses coherent HyperTransport [56, 218, 282]. The USIIICu is used in the Sun V1280 [266], a twelve processor system and it uses the FirePlane protocol [50] to create a shared memory system. The V1280 exhibits slight NUMA characteristics.
The microprocessors had a varying number of on-chip performance counters (2 to 18). The sizes and organization of their cache hierarchies were also different. Measuredlmbench
2.2
Performance Evaluation
John [199] classifies performance evaluation into two major categories; performance measure-ment and performance modelling. Performance measuremeasure-ment is the use of hardware or soft-ware techniques which allow for measurement of either time taken to completion for a given task or event counts of interest within some period of time. Performance modelling refers to the creation and validation of a model which accounts for observations made from performance measurement of a given system. A modified version of a table presented in [199] detailing various performance evaluation options is given in Table 2.2. The various sub-sections of this table are expanded below. Following this is a brief introduction to dynamic binary translation (DBT) is presented prior to an introduction to the Valgrind DBT tool.
Performance Measurement Software assisted profiling
On-chip hardware performance counters
Performance Modelling
Analytic Modelling
Parametric models Probabilistic models Queuing theory
Neural net, Markov models
Simulation
Statistical, Monte-Carlo simulation Trace driven
[image:47.595.118.543.304.455.2]Execution driven Full system simulation
Table 2.2: Classification of performance evaluation techniques
2.2.1
Performance Measurement using Software Assisted
Profil-ing
The gprof[101] profiling tool is an example of a software assisted profiling tool. One of
for Solaris and systemtap for Linux [214] are two OS instrumentation tools which allow for the creation of arbitrary user programs which can be used to instrument running production systems. Both consume OS specific probes which are exposed via kernel and application inter-faces, to instrument a running OS i.e it is possible to trace an application running in user-space and its subsequent interactions all the way down to the kernel. JIFL [201], is a just-in-time fine-grained dynamic instrumentation framework for the Intel x86 architecture. Unlike DTrace and systemtap, which inserts trap instructions, JIFL is able to patch in jump instructions into a running OS’ code image thus allowing for finer instrumentation. By using an API, it is pos-sible to profile system execution time in both user and kernel space with minimal overhead. PinOS [40], extends the Pin [165] instrumentation framework to allow whole-system instru-mentation. This is achieved by using vitalization provided by the Xen [21] hypervisor. The application and OS of interest is run within a Xen DomU4. PinOS can then either attach to the running instance of the OS and effectively instruments the DomU using Pin’s instrumen-tation API. Also, these tools have been used in identifying and modelling cache performance problems [170, 171].
2.2.2
Performance Measurement using On-Chip Counters
As discussed in Section 2.1.6 HWPCs can be used to measure performance events of interest. Access to hardware performance counters can either be via compiler instrumentation, use of tools described above or it can be inserted directly into areas of user code of interest, either by using APIs from tools like Dyninst [118] and Pin [165] or manually patching in calls via libraries like PAPI [37]. The advantage of using tools like Dyninst and Pin is that source code for the original binary is not required as these tools can operate on binaries. Platform specific definitions for performance counters used in this thesis are given in Appendix A, Table A.1.
2.2.3
Performance Modelling using Analytic Techniques
Analytic modelling is usually employed for large computer systems i.e. aggregate models of the microprocessor, memory and interconnect. It attempts to build a system specific mathemat-ical model and is high level, often using characteristics of input event distributions. Computer systems are aggregations of hardware and software resources and a set of tasks or jobs com-pete for these resources [199]. Analytic models attempt to weight various system parameters and present empirical equations of system performance. This results in formulations which are based on probabilistic models [53, 122, 195, 241, 253], statistical models [145], non-linear
4Xen acts as a hypervisor effectively virtualizing underlying hardware. The DomU (guest/user
regression models [141], stochastic models [120], queuing theory [67], Markov models [254] and neural-net models [129]. Explicit parametrisation of scientific codes based on inputs are also another type of analytical model [175]. Analytic models have quick turn around times and can model very large systems [241]. Yet the models are dependent of underlying simpli-fications of the real system and depend on input parameters which characterize the processor, interconnect and workloads being studied. An example of analytic modelling is a performance model for a Particle Transport Code (PTC) given in Mattis and Kerbyson [175]. The PTC’s in-put is parametrized along with platform specific parameters like communication latencies and cache specific parameters. The model is validated and allows for quick performance estimates on future computing platforms.
2.2.4
Performance modelling using Simulation
Simulation techniques use either a software model, which abstracts underlying hardware or employs statistical techniques to simulate components or subsystems of interest. The hardware platform being studied is abstracted and modelled in software. It have now become the de-facto means of performance evaluation in computer architecture studies [248]. Simulators are constructed to be functional or timing accurate simulators. A functional simulator can simulate the functionality of target hardware i.e. runtime register values of a simulated application can be retrieved from simulated registers. To create a timing accurate simulation, the simulation needs to model both functionality and per cycle latencies of processor events.
Statistical, Monte-Carlo Simulation
Statistical simulation [24, 75] and Monte-Carlo [256] simulation, collect a series of microar-chitecture specific and microarmicroar-chitecture-independent characteristics. This collected profile is then used as input for simulating a trace-driven statistical simulator.
Trace Driven and Execution Driven Simulation
where the input binary is read-in and used to progress the simulation.
Over [204] classifies simulation tools by their level of detail – component-level, user-level and full machine simulation. Each of these levels of detail are implemented using techniques give under the Simulation heading of Table 2.2.
Component-level simulation is used when a particular sub-system of interest needs to be modelled i.e. branch predication, out-of-order retirement. This is done when the be-havior of the component in isolated is required, rather than its incorporation in a larger framework i.e. branch prediction within a microprocessor.
User-level simulation aims to model the microarchitecture of a target processor and its exe-cution pipelines. Typically these simulators are unable to simulate the effect of OS and I/O interactions as BIOS and other hardware sub-systems required for system boot have not been modelled. RSIM [121, 208], SimpleScalar [18, 41] are examples of this type of simulation. These execute user-level workloads and assume I/O subsystems do not impact overall performance of the simulation.
Full-machine simulation , on the other hand, models hardware in sufficient detail to permit simulations of entire operating systems, I/O subsystems and network interface cards. SimICS [168], SimOS [230, 231] and M5 [27] are examples of such simulators.
2.2.5
Dynamic Binary Translation and the Callgrind/Valgrind tool
Dynamic binary translation is a technique used for performance modelling simulation. Dy-namic binary translation (DBT) uses basic blocks5 from an input binary, which is annotated and re-compiled to the target hosts’ instruction set. Typically a cache simulation model is fed these basic blocks in order to obtain cache specific information e.g. the total number of L1, L2 cache misses. In this thesis, the Valgrind [190,192] dynamic binary translation [44] framework is used in conjunction with the Callgrind [140, 191, 274, 296, 297] functional cache simulation tool. The Valgrind dynamic binary instrumentation framework provides basic blocks to the Callgrind tool which in turn performs dynamic, execution driven cache simulation Valgrind, is a program supervision framework which permits the writing of tools or plug-ins which super-vise the execution of an underlying executable. In this work version 3.2.1 of Valgrind and the Callgrind tool. Cache parameters for the L1 Instruction, L1 Data and L2 Unified cache sizes are specified prior to running an executable via Valgrind entirely in user-space. An executable and its command-line options are passed onto Valgrind which in turn sets up an environment for callgrind to perform the cache simulation.
5A basis block is a distinct section of object code which has one entry point, one exit point and does
Valgrind decodes a native executable and converts the native ISA’s op-codes into a plat-form independent representation called VEX. This representation or instruction stream is then fed into the Callgrind tool which in turn performs its cache simulation using these VEX basic blocks. On completing its cache simulation, Callgrind hands the basic block back to Val-grind. At this point Valgrind becomes a just-in-time compiler and outputs native machine code from the basic block. It is this very process which allows Valgrind/Callgrind to supervise the program’s execution and monitor all of the user-space instruction stream of an executable.
The cache simulation allows for the recording of more events than is possible using on-chip performance counters. Hardware designers are firstly, limited by the amount of on-chip silicon that can be devoted to performance monitoring constructs and need to ensure its operation does not in any way impede the execution speed of the processor. Simulation takes longer to run (Valgrind simulations can experience a 10x slowdown), but is able to record and annotate events which cannot be obtained using on-chip performance counters alone.
2.3
Electronic Structure Methods
This section gives an overview of electronic structure methods used in this thesis. It includes background material relating to Schr¨odinger’s wave equation, the Hartree-Fock method, chem-ical basis sets, two-electron integral evaluation and Density Functional Theory.
Computational quantum chemistry encompasses a body of theory called electronic struc-ture theory which has been developing over the course of the last century [77, 210]. Central to it is the Schr¨odinger wave-equation,
b
Hψ=Eψ (2.1)
Quantum mechanics postulates that for any system there exists a wavefunction ψ that fully describes the system under consideration. In Equation 2.1 Hb is the operator applied to ψ
yielding the scalar E, multiplied by ψ [55]. In this case the operator Hb is the Hamiltonian
operator andE is the system’s energy. In the context of quantum chemistry the Hamiltonian operatorHbincludes terms for the kinetic energies of the electrons and nuclei and the coulombic
interactions between them.
A two atom system is illustrated in Figure 2.5. In this Figure a right handed coordinate system with the origin at O has atom Aand B at a distance RA and RB from the origin, and
two electronsi, jat a distanceri andrj from the origin. The distance between the two nuclei
isRABwhereas the distance between the electrons isri j. In this system there are interactions
![Figure 2.2: The Memory Hierarchy Architecture. Adapted from [32].](https://thumb-us.123doks.com/thumbv2/123dok_us/8115468.238038/37.595.114.528.87.422/figure-memory-hierarchy-architecture-adapted.webp)
![Figure 2.7: The McMurchie-Davidson ERI scheme. From [229].](https://thumb-us.123doks.com/thumbv2/123dok_us/8115468.238038/59.595.262.375.111.411/figure-the-mcmurchie-davidson-eri-scheme-from.webp)
![Figure 2.8( j ): The MD-PRISM ERI scheme. From [229], [92]](https://thumb-us.123doks.com/thumbv2/123dok_us/8115468.238038/61.595.170.476.104.400/figure-the-md-prism-eri-scheme-from.webp)