procedures
.
White Rose Research Online URL for this paper:
http://eprints.whiterose.ac.uk/747/
Article:
Strozzi, T., Luckman, A., Murray, T. et al. (2 more authors) (2002) Glacier motion
estimation using SAR offset-tracking procedures. IEEE Transactions on Geoscience and
Remote Sensing, 40 (11). pp. 2384-2391. ISSN 0196-2892
https://doi.org/10.1109/TGRS.2002.805079
[email protected] https://eprints.whiterose.ac.uk/ Reuse
See Attached
Takedown
If you consider content in White Rose Research Online to be in breach of UK law, please notify us by
Glacier Motion Estimation Using SAR
Offset-Tracking Procedures
Tazio Strozzi, Member, IEEE, Adrian Luckman, Tavi Murray, Urs Wegmüller, Member, IEEE, and
Charles L. Werner, Member, IEEE
Abstract—Two image-to-image patch offset techniques for
estimating feature motion between satellite synthetic aperture radar (SAR) images are discussed. Intensity tracking, based on patch intensity cross-correlation optimization, and coherence tracking, based on patch coherence optimization, are used to estimate the movement of glacier surfaces between two SAR images in both slant-range and azimuth direction. The accuracy and application range of the two methods are examined in the case of the surge of Monacobreen in Northern Svalbard between 1992 and 1996. Offset-tracking procedures of SAR images are an alternative to differential SAR interferometry for the estimation of glacier motion when differential SAR interferometry is limited by loss of coherence, i.e., in the case of rapid and incoherent flow and of large acquisition time intervals between the two SAR images. In addition, an offset-tracking procedure in the azimuth direction may be combined with differential SAR interferometry in the slant-range direction in order to retrieve a two-dimensional displacement map when SAR data of only one orbit configuration are available.
Index Terms—Glacier-motion estimation, offset tracking, SAR,
SAR interferometry, surge-type glacier.
I. INTRODUCTION
S
ATELLITE synthetic aperture radar (SAR) data have pro-vided invaluable tools for the study of ice and glaciers. In particular, the potential of differential SAR interferometry to map displacements at centimeter resolution resulted in spectac-ular new results in glaciology [1]–[4]. In the interferometric ap-proach, two complex SAR images acquired from slightly dif-ferent orbit configurations and at difdif-ferent times are combined to exploit the phase difference of the signals [5]–[7]. The in-terferometric phase is sensitive to both surface topography and coherent displacement along the look vector occurring between the acquisitions of the interferometric image pair. The differen-tial use of two interferograms with similar displacement allows the removal of the topographic-related phase from the interfer-ogram to derive a displacement map [8]–[10].Manuscript received March 14, 2001; revised August 7, 2001. This work was supported by the U.K. Natural Environment Research Council (NERC) Project GST/02/2192.
T. Strozzi was with the Department of Geography, University of Wales, Swansea SA2 8PP, U.K. He is now with GAMMA Remote Sensing, 3074 Muri BE, Switzerland (e-mail: [email protected]).
A. Luckman is with the Department of Geography, University of Wales, Swansea SA2 8PP, U.K.
T. Murray is with the School of Geography, University of Leeds, Leeds LS2 9JT, U.K.
U. Wegmüller and C. L. Werner are with GAMMA Remote Sensing, 3074 Muri BE, Switzerland.
[image:2.612.326.532.176.448.2]Digital Object Identifier 10.1109/TGRS.2002.805079
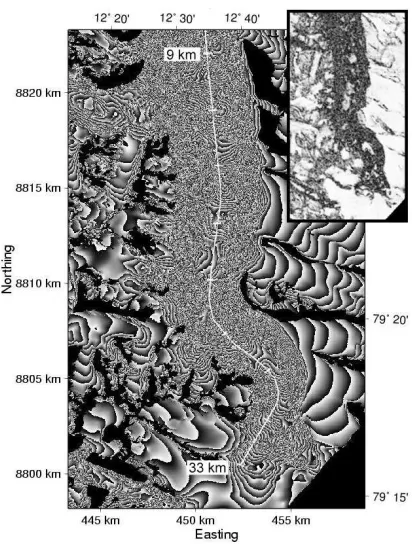
Fig. 1. Flattened, filtered, 12 5 multilooking interferogram of Monacobreen for January 15 and 18, 1994. The interferogram was geocoded to UTM coordinates, and the look direction is approximately from the southeast. Rocky areas are masked out. The perpendicular component of the baseline is 84 m. The longitudinal profile is drawn along the flow direction. A coherence map is shown in the inset.
The successful use of differential SAR interferometry is lim-ited by the phase noise, usually characterized by the coher-ence. Over glacier surfaces the coherence is affected by meteo-rological and flow conditions and generally diminishes with in-creasing time interval between the acquisitions of the two SAR images used in the interferogram. Meteorological sources of decorrelation include ice and snow surface melt [11] and pos-sibly snowfall and wind through the redistribution of snow and ice. Decorrelation causes related to the motion of the glacier are incoherent displacements of adjacent scatterers and rapid flow if local deviations from the overall image registration function are not taken into account.
A typical interferogram for a fast-moving glacier is shown in Fig. 1. Monacobreen is a tidewater glacier in Northern Sval-bard flowing north from the Isachsenfonna icecap into Liefde-fjorden [12]. Monacobreen is known to exhibit surge-type be-havior, which is characterized by long periods (20–200 years)
of slow flow punctuated by short periods (one to ten years) of fast flow during which substantial volumes of ice are transferred to lower altitudes causing a temporary increase in the overall melt rate [13]. The inaccessibility of most surge-type glaciers has made understanding the causes, mechanisms, and precise occurrence of surging difficult, and there is a need to acquire more information about this type of glacier. At the maximum of the surge phase in January 1994, large areas of Monacobreen were characterized by low coherence, and only the upper part, where the glacier started to flow from the ice cap, and discon-nected areas in its central part were coherent. At the beginning and at the end of the surge, on the other hand, the complete upper and central parts of Monacobreen were coherent, but the front of the glacier has always been incoherent independently of the one- or three-day acquisition time-interval of the European Re-mote Sensing (ERS) SAR data.
In the case of decorrelation due to rapid and incoherent flow, offset-tracking procedures of SAR images are a welcome al-ternative to SAR interferometry for the estimation of glacier motion [14]–[19]. In this paper, two offset-tracking procedures based on satellite radar data—namely, intensity and coherence tracking—are discussed. With both techniques, the registration offsets of two SAR images in both slant-range (i.e., in the line of sight of the satellite) and azimuth (i.e., along the orbit of the satellite) directions are generated and used to estimate the dis-placement of glaciers. The estimated offsets are unambiguous values, which means that there is no need for phase unwrap-ping, one of the most critical steps in SAR interferometry. The accuracy and application range of the two methods are exam-ined with respect to the surge of Monacobreen using SAR data of the ERS-1 and ERS-2 satellites.
II. ESTIMATION OF GLACIER MOTIONUSING
OFFSET-TRACKINGPROCEDURES
A. Introduction
In this section, the methodology to estimate glacier motion using SAR offset-tracking procedures is discussed, and the application range of these procedures is evaluated. First, two different techniques to compute the SAR image offsets, i.e., in-tensity and coherence tracking, are introduced. Then, the con-version of the offsets to motion values is presented. Accuracy, advantages, and disadvantages of the two different techniques are assessed and compared to those of differential SAR inter-ferometry. Based on this discussion, conclusions concerning the methodology to apply on a specific case are drawn. The discussion also includes some specific implementations of our approach, which we consider of large interest because it is part of a commercial software package [20] and thus available to a wide user community.
B. Intensity Tracking
A first method to estimate the slant-range and azimuth regis-tration offset fields of two SAR images is the intensity tracking, also known as cross-correlation optimization procedure [14]–[18]. The offset fields are generated with a normalized cross correlation of image patches of detected real-valued SAR intensity images. The successful estimation of the local image
offsets depends on the presence of nearly identical features in the two SAR images at the scale of the employed patches. When coherence is retained, the speckle pattern of the two images is correlated, and intensity tracking with small image patches can be performed to remarkable accuracy. Incoherent intensity tracking is also feasible but requires large image patches. In order to increase the estimation accuracy, oversampling rates are applied to the image patches, and a two-dimensional (2-D) regression fit to model the correlation function around the peak is determined with a four-point interpolation. The location of the peak of the 2-D cross-correlation function yields the image offset. Confidence in the offset estimate is measured by comparing the height of the correlation peak relative to the average level of the correlation function to supply a correlation signal-to-noise ratio (SNR). Coarse information on the slant-range and azimuth offsets is used to guide the search of the cross-correlation maximum. The image-patch size may be adapted to a specific case. For the present study with ERS SAR data, we systematically used patch sizes of 64 64 single-look pixels, which corresponds to around 1300 m in the ground-range direction and 250 m in the azimuth direction.
C. Coherence Tracking
A method of measuring the offsets between SAR images complementary to the intensity tracking is the coherence tracking, also known as the fringe visibility algorithm or coher-ence optimization procedure [19]. Throughout the single-look complex SAR images, small data patches are selected; a series of small interferograms with changing offset is constructed; and the coherence is estimated. The location of the coherence maximum is determined at subpixel accuracy by oversampling the single-look complex SAR image patches with zero-padding and by using a 2-D regression function to model the coherence peak with a four-point interpolator. The magnitude of the coher-ence maximum relative to the average level is used as a quality factor to help reject unsuitable patches. Coarse information on the slant-range and azimuth offsets is used to guide the search for the coherence maximum. Again, the image-patch size may be adapted to a specific case. For this study, with ERS SAR data patch sizes of 8 8 single-look pixels, corresponding to around 160 m in the ground-range direction and 30 m in the azimuth direction, were employed. Reliable offset estimates depend on a sufficiently high coherence level. For areas of insufficient coherence, such as observed for wet snow, no reliable offsets can be determined with this technique.
D. Estimation of the Glacier Motion
orbit parameters supplied by the space agencies is normally not precise enough either for the determination of the orbital off-sets or in general for SAR image coregistration. It is, therefore, preferable to determine the orbital offsets from stable reference points. This is achieved, for instance, by fitting a bilinear poly-nomial function to offset fields determined globally from the SAR images if the assumption of no displacement for most parts of the image is satisfied. After subtraction of the orbital offsets, pixel shifts in slant-range and azimuth directions are related to glacier motion only and are transformed to displacements in me-ters with knowledge of the SAR image pixel spacing.
Slant-range and azimuth displacements provide only two components of the 3-D displacement vector. In order to obtain a 3-D displacement map, the slant-range and azimuth displace-ments can be combined with a digital elevation model (DEM) by assuming flow parallel to the surface of the glacier [4], [21]. If a DEM is not available, but it can reasonably be assumed that the surface is horizontal, then slant-range and azimuth displacements may provide a 2-D ground displacement field without using multiple image pairs from dual-azimuth angles (e.g., ascending and descending passes).
E. Error Analysis
Error analysis is essential to demonstrate the applicability of offset-tracking procedures to surface movement and to support the selection of the methodology for a specific case. The theo-retical part of the error analysis discusses the transformation of pixel registration accuracy for the ERS SAR configuration into displacement accuracy. This gives an indication of the relevance of the offset-tracking procedures in the estimation of glacier mo-tions. In Section III, these indicative values are compared to the results obtained for Monacobreen using offset-tracking proce-dures and SAR interferometry as a reference.
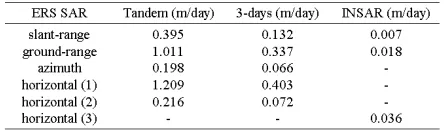
[image:4.612.317.539.199.264.2]The ERS SAR data used in this study were processed to a slant-range pixel spacing of 7.904 m and to an azimuth pixel spacing of 3.965 m. The expected accuracy of offset-tracking procedures can be estimated in stable zones using the standard deviation between the values of individual estimates and those resulting from a regression function fitted globally to the SAR scene. Typical slant-range and azimuth offset estimation errors are of the order of 1/20th of a pixel for the image-patch sizes and oversampling factors considered in this study. The resulting accuracies in slant-range and azimuth direction are summarized in Table I. The relative errors are computed by dividing the ab-solute error by the observation period. Consequently, the slant-range and azimuth velocity errors are indirectly proportional to the observation period. The accuracy increases if only estimates with large SNR values are considered, but, if so, the number of estimates diminishes. The accuracy of the horizontal displace-ment vector (and similarly of the 3-D displacedisplace-ment vector if a DEM is used) is roughly estimated as the sum of the accura-cies in ground-range and azimuth directions. However, the hor-izontal errors are strongly dependent on the glacier orientation relative to the SAR imaging geometry, because of the differ-ence of the SAR imaging and glacier-centric coordinate sys-tems. In addition to the statistical errors in the shift estimation of single-image patches, a systematic error may be introduced in the determination of the zero-velocity reference field.
TABLE I
EXPECTEDACCURACY OFERS SAR OFFSET-TRACKINGPROCEDURES(IN
METERS PERDAY) ASSUMING ANACCURACY OF THESHIFTESTIMATION OF
1/20TH OF APIXEL INSLANT-RANGE ANDAZIMUTHDIRECTIONS. THEERS SAR DATA OFTHISSTUDY AREPROCESSED TO ASLANT-RANGEPIXEL
SPACING OF7.904 mAND TO ANAZIMUTHPIXELSPACING OF3.965 m. THE
EXPECTEDACCURACY FORDIFFERENTIALSAR INTERFEROMETRY(INSAR) ISCOMPUTEDASSUMING ANATMOSPHERICDISTORTION OF/2; NO
OTHERERRORS ARECONSIDERED. ACCURACY OFDISPLACEMENTRATES
ASSUMINGFLOWING ON AHORIZONTALPLAINARECOMPUTED1)FOR
OFFSET-TRACKINGPROCEDURES INSLANT-RANGE ANDAZIMUTHDIRECTION, 2)FORINSAR DATA INSLANT-RANGE ANDOFFSETTRACKING INAZIMUTH
DIRECTIONS,AND3)FORDUAL-TRACKINSAR DATA OFASCENDING ANDDESCENDINGORBITS(TANDEMPHASE)
The accuracy of differential SAR interferometry is two or-ders of magnitude better than that expected from offset-tracking procedures. SAR interferometry is mainly limited by phase dis-tortions caused by spatially heterogeneous atmospheric (in par-ticular water vapor) and ionospheric conditions. For an evalua-tion of the error caused by atmospheric distorevalua-tions, we consider a relative high phase error of , which corresponds for the ERS SAR configurations to an error of approximately 0.7 cm in the estimation of the displacement in the slant-range direction. When Tandem data of ascending and descending orbits are com-bined to retrieve the magnitude of the displacement vector, we expect a total error on the order of the sum of the errors in the two ground-range directions, i.e., about 3.6 cm/day. Additional errors in SAR interferometry may arise in resolving the ambi-guity in the phase signal through phase unwrapping.
A displacement vector can also be retrieved by combining dif-ferential SAR interferometry in the slant-range direction, offset tracking in the azimuth direction, and a DEM. This approach is less accurate than that based on differential SAR interferometry alone using dual-azimuth data, but can be applied using only one image pair. The accuracy of this approach is more than five times better than using offset tracking alone, because of the high ground-range resolution of the ERS SAR data.
Further limitations of offset-tracking procedures are similar to those encountered in SAR interferometry: tidal motion of floating ice, limitation of the assumption of flow parallel to the ice surface, DEM errors, and errors arising from propagation effects in the ionosphere [17]. Most of these errors, as well as those introduced by the estimation of the shifts of single-image patches and by the determination of the zero-velocity reference field, tend to be random. Therefore, spatial averaging may re-duce their contribution. In our examples, though, spatial filtering was not applied.
F. Application Strategy
the glacier, the required spatial resolution and accuracy, the coherence, the computation time, and the availability of SAR data in the archive. Often, a combined approach is the most efficient way to determine the motion of a glacier.
SAR interferometry is by far the most accurate technique to measure the displacement component in the slant-range direc-tion. Therefore, this method is used when applicable. The spa-tial resolution is also very high, typically 20 m 20 m on the ground. The most important limiting factors of SAR interfer-ometry are the coherence and the feasibility of phase unwrap-ping. Phase unwrapping is reliable only for areas of high coher-ence and low fringe rates. In some cases, disconnected areas of high coherence separated by areas of low coherence cannot be properly analyzed because information on a reference point is missing. Unlike offset-tracking procedures, SAR interferometry does not measure the displacement in the azimuth direction.
Coherence tracking is suitable for areas of high coherence, essentially where SAR interferometry is applied. In comparison to SAR interferometry, though, absolute estimates are obtained making it is also suitable for disconnected areas of high coher-ence and for very large displacements. In addition, cohercoher-ence tracking provides information on the motion in two directions. However, the accuracy and resolution of coherence tracking are poorer than those of differential SAR interferometry. Finally, the computational efficiency is a limiting factor, and long pro-cessing times are required to track the motion of large areas at high spatial resolution.
The big advantage of intensity tracking is that it can be em-ployed also where there is no coherence. In most areas, the suc-cessful analysis of SAR image pairs with large acquisition time intervals is restricted to intensity tracking because over glacier coherence is not retained for more than a few days. This is par-ticularly important, since all the current and near-future planned SAR missions (ERS-2, RADARSAT, ENVISAT, and ALOS) have a revisiting time of 24 days or more. As coherence tracking, intensity tracking provides estimates of both slant-range and az-imuth components of the displacement. Disadvantages are the very large image-patch sizes, reducing the spatial resolution, and the low accuracy, compared to the one of SAR interferom-etry. The computational efficiency is high and therefore hardly a limiting factor.
III. APPLICATION TOMONACOBREEN, SVALBARD
A. ERS SAR Data and Interferometric Analysis
A time series of ERS-1/2 SAR data from September 1991 to September 1998 was used to monitor the complete surge cycle of Monacobreen [22]. Sixteen scenes from March 1992 to Feb-ruary 1996 were chosen to investigate the use of offset-tracking procedures in glacier motion estimation. Table II shows dates and baselines for the image pairs selected.
For the differential SAR interferometric analysis, we ap-plied the usual procedure [8]–[10]. The component of the interferometric phase related to the topography was removed by subtraction of two interferograms from which similar displacement could be assumed (i.e., a triplet of SAR scenes acquired with three days time interval or two Tandem pairs acquired a month apart). Where full differential data were not
TABLE II
IMAGEPAIRPARAMETERS FORSAR ACQUISITIONS(NORMALTEXT: DESCENDINGMODE; ITALIC: ASCENDINGMODE). TOPOGRAPHYBASELINEIS
THEEQUIVALENTPERPENDICULARBASELINE FOR THETOPOGRAPHY
COMPONENT OF THEDIFFERENTIALCOMBINATION OFINTERFEROGRAMS. ARROWSINDICATE FOR APARTICULARINTERFEROGRAMWHICHOTHERPAIR
WASUSED TOREMOVE THETOPOGRAPHICSIGNAL
available at a particular date, a DEM from the most recent pair was used to correct for topographic effects on phase. After subtraction of the topography-related phase, maps of the displacement in the line-of-sight direction were computed. The SAR data of December 1995 to February 1996 of ascending and descending orbits were combined with a DEM to obtain a 3-D displacement map by assuming flow parallel to the surface of the glacier [4], [21]. Unfortunately, data of ascending orbits are available only for the winter 1995/1996. In order to compute the 3-D displacement maps for the other dates, we assumed that the flow direction did not change. This hypothesis was confirmed by a careful analysis of the displacement direction over Monacobreen, which did not show any particular anomaly. However, areas with look and flow directions approaching perpendicular directions were masked out, because of the significantly increased uncertainty in displacement estimate.
B. Slant-Range Displacement Component From Coherence Tracking
As shown in Fig. 1, very low coherence was observed over large areas of Monacobreen in the January 1994 interferograms because of very rapid and incoherent flow at the maximum of the surge. However, the central part of the glacier showed suffi-ciently high coherence for phase interpretation. This area can be analyzed with SAR interferometry, but since the coherent part of Monacobreen is completely disconnected from static zones out-side of the glacier, information on a reference point is missing, and SAR interferometry alone cannot be used to retrieve the ab-solute displacement. Coherence tracking was used to supply the missing information.
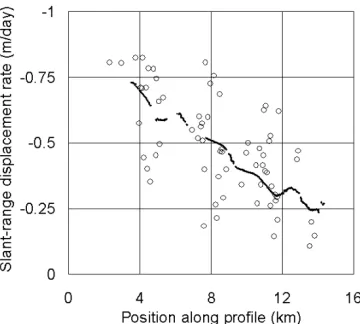
Fig. 2. Displacement rate in the slant-range direction from coherence tracking (circles) and SAR interferometry after correction for the reference velocity (line) along a longitudinal profile in the central part of Monacobreen in January 1994.
SAR interferometry is 0.155 m/day divided by the square root of 1053, i.e., 0.005 m/day. Fig. 2 complements the analysis by showing the displacement rates in slant-range direction from coherence tracking and SAR interferometry after correction for the reference velocity along a longitudinal profile of Monacobreen.
The combined use of coherence tracking and differential SAR interferometry allowed the complete and extensive measure-ment of surface flow over Monacobreen at the height of the surge and thus a better characterization of the spatial and tem-poral evolution of the entire surge phase of this glacier.
C. Combining Coherence Tracking in Azimuth Direction With SAR Interferometry
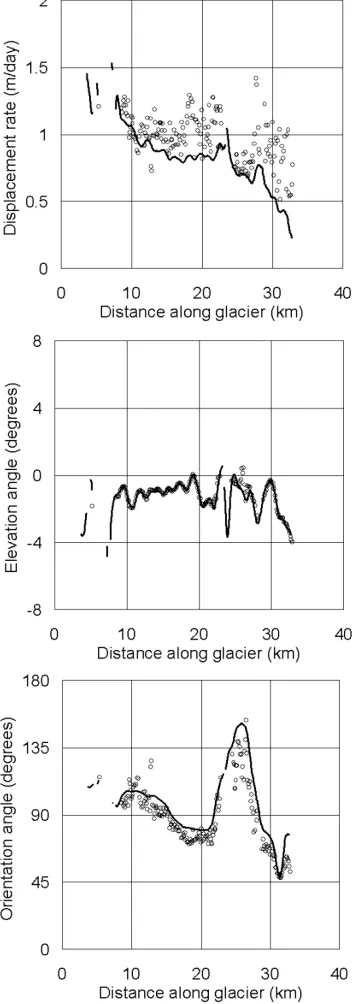
The data of December 1995 to February 1996 of ascending and descending orbits were used to investigate the accuracy of the novel approach based on the combination of offset tracking in the azimuth direction and differential SAR interferometry in the slant-range direction. Three sets of displacement maps were generated: the first one using full interferometric data of ascending and descending orbits (dual-track SAR interferom-etry), the second one by combining SAR interferometry in the slant-range direction with coherence tracking in the azimuth di-rection for data of the ascending orbit, and the third one by combining SAR interferometry in the slant-range direction with coherence tracking in the azimuth direction for data of the scending orbit. In all three cases, the same DEM of the de-scending mode was used because of its high accuracy resulting from a large baseline. Profiles of daily displacement were mea-sured down the center line of the glacier and are shown in Figs. 3 and 4. The 3-D displacement vectors are characterized by their magnitude, elevation, and orientation angles.
[image:6.612.337.515.72.569.2]The results of Figs. 3 and 4 confirm the feasibility and po-tential of the approach based on SAR interferometry and co-herence tracking for the retrieval of a 3-D displacement map. The standard deviation between the displacement rates deter-mined with dual-track SAR interferometry and the combined interferometry and tracking approach is 0.233 m/day for the 383 patches of the two profiles with information available from both surveying procedures. The maximum difference is 0.757 m/day.
Fig. 3. Magnitude, elevation, and orientation angles of 3-D displacement vectors along a profile down the center line of Monacobreen derived with dual-track differential interferometry (line) and SAR interferometry combined with coherence tracking in azimuth direction for the data in ascending mode (circles). The orientation angle is 0 if flow is toward the east, 90 if it is toward the north, and 180 if it is toward the west. The position of the front of Monacobreen is 0 km.
The coherence-tracking accuracy in azimuth direction is, there-fore, again on the order of 1/20th of a pixel (see Table I). For the orientation angle, the standard deviation between the two pro-cedures is 10.3 with a maximum difference of 44.2 .
D. Results From Intensity Tracking
Fig. 4. Same as Fig. 3, but the circles are for SAR data in descending mode.
be successfully interpreted. Profiles down the center line of the displacement rate are presented in Fig. 5 for the ERS SAR data of March 1992, January 1994, June 1995, and December 1995. The profiles derived from differential SAR interferometry are also shown for comparison. The results of the data for the three-day repeat orbits (March 1992 and January 1994) are more accurate than those of the Tandem phase (June 1995 and December 1995), because of the larger acquisition time intervals and thus the larger displacement. For the 413 patches of the profiles of Fig. 5(a) and (b) from SAR data of the three-days repeat orbits with values from both differential SAR interferometry and intensity tracking, the standard deviation between the two surveying techniques is 0.250 m/day. The
maximum difference is 1.025 m/day. The standard deviation of 0.250 m/day corresponds to a shift accuracy of less than 1/20th of a pixel in slant-range and azimuth directions (see Table I). For the 304 patches of the two profiles of Fig. 5(c) and (d) from SAR data of the Tandem phase with values from both differential SAR interferometry and intensity tracking, the standard deviation between the two surveying techniques is 0.455 m/day. The maximum difference is 2.694 m/day. In both Fig. 5(c) and (d), a bias of the intensity-tracking values appears for low displacement rates, limiting the use of the procedure to large displacements. The bias is a result of the large statistical errors of single estimates and of the systematic error introduced by the determination of the zero-velocity reference.
Intensity tracking is essential for the study of the surge of Monacobreen. Only this technique provides information down to the front of the glacier where it indicates a continuous increase of the displacement rate and a very large scatter of the values. In particular, in 1992, the phase noise in the front of Monacobreen is not related to large displacement rates, but rather to large inhomogeneity of the displacement of adjacent scatters. This was confirmed by the application of coherence tracking to the same datasets, which failed over the front of Monacobreen.
Intensity tracking was also tested with ERS SAR data ac-quired with a time interval of 35 days. The interferogram formed with the ERS-1 SAR scenes of December 28, 1995 and the Feb-ruary 1, 1996 (perpendicular baseline 482 m) showed com-plete decorrelation over Monacobreen. With intensity tracking, displacement values could be retrieved over most parts of the glacier, even if the number of reliable estimates was very low. For the whole glacier, the algorithm was applied to more than 6000 image patches, but only 307 gave confident results. For comparison, in the case of the Tandem data of December 1995, almost all image patches gave good results. On the other hand, the accuracy of the displacement rates estimated with 35 days acquisition time interval is high: for the 188 patches of Monaco-breen with displacement values from both intensity tracking and differential SAR interferometry, the standard deviation between the two surveying techniques is 0.151 m/day with a maximum difference of 0.727 m/day.
IV. CONCLUSION
Two SAR-based offset-tracking procedures—intensity tracking and coherence tracking—were presented and used to estimate the motion of Monacobreen in Northern Svalbard where the application of SAR interferometry was limited by phase noise. The accuracy of the offset-tracking procedures was estimated by transformation of pixel shift accuracies for the ERS SAR configuration and by comparison with differential SAR interferometry over the coherent areas of the glacier. Table I summarizes the relevance of the offset-tracking pro-cedures for surface motion mapping. The complementarity of intensity tracking, coherence tracking, and SAR interferometry, in particular with respect to error budgets and applicability, often makes a combined approach the most efficient way to determine the motion of a glacier.
(a) (b)
[image:8.612.107.488.63.410.2](c) (d)
Fig. 5. Displacement rates from differential SAR interferometry (line) and intensity tracking (circles) along a profile down the center line of Monacobreen. The position of the front of Monacobreen at the end of December 1995 is 0 km. (a) March 1992; (b) January 1994; (c) June 1995; and (d) December 1995 in ascending mode.
of high coherence, i.e., as unambiguous reference information where phase unwrapping has failed to provide the link to a known reference. The combination of coherence tracking in az-imuth direction and differential SAR interferometry in slant-range direction was found very useful for the estimation of dis-placement vectors with SAR data of a single orbit. This novel approach is applicable for areas where data of both ascending and descending modes are not available.
Intensity tracking is very useful to complement the other methods in areas concerned with very large and incoherent displacements as the result of fast flowing or of large acqui-sition time intervals between the two SAR images. Intensity tracking is an invaluable source of information for the study of fast-flowing glaciers and may be used in the analysis of large surging glaciers. In some cases, intensity tracking is the only technique that can be applied for SAR data acquired with more than a 24-day time interval, which is the case for all the current and in near-future planned SAR missions (RADARSAT, ERS-2, ENVISAT, ALOS).
ACKNOWLEDGMENT
The authors are indebted to the European Space Agency for the provision of data through the third announcement of oppor-tunity (Project AO3-283).
REFERENCES
[1] R. Goldstein, R. Engelhard, B. Kamb, and R. Frolich, “Satellite radar interferometry for monitoring ice sheet motion: Application to an Antarctic ice stream,” Science, vol. 262, pp. 1525–1530, Dec. 1993. [2] I. Joughin, S. Tulaczyk, M. Fahnestock, and R. Kwok, “A mini-surge
on the Ryder Glacier, Greenland, observed by satellite radar interferom-etry,” Science, vol. 274, pp. 228–230, Oct. 1996.
[3] E. Rignot, S. Gogineni, W. Krabill, and S. Ekholm, “North and Northeast Greenland ice discharge from satellite radar interferometry,” Science, vol. 276, pp. 934–937, May 1997.
[4] J. J. Mohr, N. Reeh, and S. Madsen, “Three-dimensional glacial flow and surface elevation measured with radar interferometry,” Nature, vol. 391, pp. 273–276, Jan. 1998.
[5] D. Massonet and J. Rabaute, “Radar interferometry: Limits and poten-tial,” IEEE Trans. Geosci. Remote Sensing, vol. 31, pp. 455–464, Mar. 1993.
[6] R. Bamler and P. Hartl, “Synthetic aperture radar interferometry,” Inv.
Prob., vol. 14, pp. R1–R54, 1998.
[7] J. J. Mohr and S. Madsen, “Error analysis for interferometric SAR mea-surements of ice sheet flow,” in Proc. IGARSS, Hamburg, Germany, 1999.
[8] I. Joughin, D. Winebrenner, M. Fahnestock, R. Kwok, and W. Krabill, “Measurement of ice-sheet topography using satellite-radar interferom-etry,” J. Glaciol., vol. 42, no. 140, pp. 10–22, 1996.
[9] I. Joughin, R. Kwok, and M. Fahnestock, “Estimation of ice-sheet mo-tion using satellite radar interferometry: Method and error analysis with application to Humboldt Glacier, Greenland,” J. Glaciol., vol. 42, no. 142, pp. 564–575, 1996.
[11] T. Strozzi, U. Wegmüller, and C. Mätzler, “Mapping wet snowcovers with SAR interferometry,” Int. J. Remote Sens., vol. 20, no. 12, pp. 2395–2403, 1999.
[12] J. Hagen, O. Liestøl, E. Roland, and T. Jørgensen, “Glacier atlas of Sval-bard and Jan Mayen,” Norsk Polarinstitutt Meddelelser, vol. 129, pp. 1–141, 1993.
[13] W. Paterson, The Physics of Glaciers, 3rd ed. Oxford, U.K.: Butter-worth-Heinemann, 1994.
[14] H. Rott, M. Stuefer, A. Siegel, P. Skvarca, and A. Eckstaller, “Mass fluxes and dynamics of Moreno Glacier, Southern Patagonia Icefield,”
Geophys. Res. Lett., vol. 25, no. 9, pp. 1407–1410, 1998.
[15] L. Gray, K. Mattar, and P. Vachon, “InSAR results from the RADARSAT Antarctic mapping mission: Estimation of glacier motion using a simple registration procedure,” in Proc. IGARSS’98, Seattle, WA, 1998. [16] R. Michel and E. Rignot, “Flow of Glaciar Moreno, Argentina, from
re-peat-pass Shuttle Imaging Radar images: Comparison of the phase cor-relation method with radar interferometry,” J. Glaciol., vol. 45, no. 149, pp. 93–100, 1999.
[17] L. Gray, K. Mattar, and G. Sofko, “Influence of ionospheric electron density fluctuations on satellite radar interferometry,” Geophys. Res.
Lett., vol. 27, no. 10, pp. 1451–1454, 2000.
[18] L. Gray, N. Short, K. Mattar, and K. Jezek, “Velocities and flux of the Filchner Ice Shelf and its tributaries determined from speckle tracking interferometry,” Can. J. Remote Sens., vol. 27, no. 3, pp. 193–206, 2001. [19] D. Derauw, “DInSAR and coherence tracking applied to glaciology: The example of Shirase Glacier,” in Proc. FRINGE’99, Liège, Belgium, 1999.
[20] C. Werner, U. Wegmüller, T. Strozzi, and A. Wiesmann, “Gamma SAR and interferometric processing software,” in Proc. ERS-ENVISAT
Symp., Gothenburg, Sweden, 2000.
[21] I. Joughin, R. Kwok, and M. Fahnestock, “Interferometric estimation of three-dimensional ice-flow using ascending and descending passes,”
IEEE Trans. Geosci. Remote Sensing, vol. 36, pp. 25–37, Jan. 1998.
[22] T. Strozzi, A. Luckman, and T. Murray, “The evolution of a glacier surge observed with the ERS satellites,” in Proc. ERS-ENVISAT Symp., Gothenburg, Sweden, 2000.
Tazio Strozzi (M’98) received the M.S. and Ph.D.
degrees in physics from the University of Berne, Bern, Switzerland, in 1993 and 1996, respectively, for his experimental and theoretical studies on the backscattering characteristics of snow and vegetation.
He has been with GAMMA Remote Sensing AG, Muri, Switzerland, since 1996, where he is responsible for the development of radar remote sensing applications and is manager of a number of research and commercial projects. From 1996 to 1998, he was part-time physics teacher at the Highschool of Bellinzona, Switzerland. From 1999 to 2001, he worked as a part-time Visiting Scientist at the University of Wales, Swansea, U.K. His current research activities include SAR and SAR interferometry for land-use applications (including forest, urban areas, and hazard mapping) and differential SAR interferometry for subsidence monitoring, glacier motion estimation, and landslide surveying. He is a Principal Investigator for ERS, ENVISAT and JERS projects on forest mapping and subsidence monitoring.
Adrian Luckman received the B.S. and D.Phil.
de-grees in electronic engineering from York University, York, U.K., in 1987 and 1991, respectively.
He worked briefly at the University of Nairobi, Nairobi, Kenya, as a Visiting Lecturer in neural networks and image processing. He then joined the British National Space Centre, Monks Wood, U.K. in 1992 as Higher Scientific Officer to investigate microwave remote sensing of tropical forests. In 1998, he became a Lecturer in remote sensing in the Department of Geography, University of Wales, Swansea, U.K. His current research interests include SAR interferometry and feature-tracking approaches to studying surface flow variability in glaciers in Svalbard and Greenland, and SAR interferometry for urban and forestry studies. He is a Principal Investigator for European Space Agency ERS and ASAR opportunities and a Partner to EU projects studying carbon budgets in Siberia (SIBERIA-II) and soil erosion in Asia (HIMALAYAN DEGRADATION).
Tavi Murray received the B.S. degree in physics and
computer science and the Ph.D. degree in glaciology from the University of Wales, Swansea, U.K., in 1987 and 1990, respectively.
She is currently Reader in Glaciology at the Uni-versity of Leeds, Leeds, U.K. Her research is focused on fast glacier flow, glacier surging and instability, and the physical processes that operate at the base of glaciers and ice sheets.
Dr. Murray is a member of the International Glaciological Society, American and Canadian Geophysical Unions, Quaternary Research Association, and an associate member of the Institute of Physics (U.K.).
Urs Wegmüller (M’94) received the M.S. and Ph.D.
degrees in physics from the University of Berne, Bern, Switzerland, in 1986 and 1990, respectively, for his experimental and theoretical studies on active and passive microwave remote sensing signatures.
Between 1991 and 1992, he worked as a Visiting Scientist at the Jet Propulsion Laboratory, California University of Technology, Pasadena, on the retrieval of canopy parameters from microwave remote sensing data. Between 1993 and 1995, at the Uni-versity of Zürich, Zürich, Switzerland, his research included interferometric data processing, theoretical modeling of scattering in forest canopies, and retrieval algorithm development for geo- and biophysical parameters using SAR interferometry. In 1995, he was a founding member of GAMMA Remote Sensing AG, Muri, Switzerland, which is active in the development of signal processing techniques and remote sensing applications. As CEO of GAMMA, he has overall responsibility for GAMMA’s activities. In addition, he is directly responsible for a number of research and commercial projects of GAMMA. At present, his main involvement is in the development of applications and the definition and implementation of related services in land surface deformation mapping, hazard mapping, landuse mapping, and topographic mapping.
Dr. Wegmüller is PI for ERS, ENVISAT, SRTM, and ALOS announcement of opportunity projects on SAR and SAR interferometry related calibration issues, application development and demonstration.
Charles L. Werner (S’75–M’79) received the Ph.D.
degree in systems engineering from the University of Pennsylvania, Philadelphia, in 1987.