R E S E A R C H A R T I C L E
Open Access
Identification and characterization of locus-specific
methylation patterns within novel loci
undergoing hypermethylation during breast
cancer pathogenesis
Tomasz K Wojdacz
1,2*, Johanne A Windeløv
1, Britta B Thestrup
1, Tine E Damsgaard
3, Jens Overgaard
2and Lise Lotte Hansen
1Abstract
Introduction:Despite similar clinical and pathological features, large numbers of breast cancer patients experience different outcomes of the disease. This, together with the fact that the incidence of breast cancer is growing worldwide, emphasizes an urgent need for identification of new biomarkers for early cancer detection and stratification of patients.
Methods:We used ultrahigh-resolution microarrays to compare genomewide methylation patterns of breast carcinomas (n= 20) and nonmalignant breast tissue (n= 5). Biomarker properties of a subset of discovered differentially methylated regions (DMRs) were validated using methylation-sensitive high-resolution melting (MS-HRM) in a case–control study on a panel of breast carcinomas (n= 275) and non-malignant controls (n= 74).
Results:On the basis of microarray results, we selected 19 DMRs for large-scale screening of cases and controls. Analysis of the screening results showed that all DMRs tested displayed significant gains of methylation in the cancer tissue compared to the levels in control tissue. Interestingly, we observed two types of locus-specific methylation, with loci undergoing either predominantly full or heterogeneous methylation during carcinogenesis. Almost all tested DMRs (17 of 19) displayed low-level methylation in nonmalignant breast tissue, independently of locus-specific methylation patterns in cases.
Conclusions:Specific loci can undergo either heterogeneous or full methylation during carcinogenesis, and loci hypermethylated in cancer frequently show low-level methylation in nonmalignant tissue.
Introduction
Denmark has the highest standardized incidence of breast cancer in the world, with over 4,500 new cases annually [1]. The breast cancer incidence has increased since the mid-1980s, and, despite the fact that early de-tection combined with specialized treatment has signifi-cantly improved the survival of cancer patients, the disease still presents a problem for healthcare systems.
Breast cancer treatment, as well as treatment of any other cancer, can be approached at two levels: first, early detection, which is critical for long-term survival of the patients, and second, personalized patient care, which potentially can become the most successful approach in cancer treatment. Both of these approaches require bio-markers for patient identification and stratification.
Methylation is a well-established epigenetic process of gene expression regulation. In general terms, methyla-tion of promoter sequences of protein-coding genes re-sults in transcriptional downregulation of the gene, and hypomethylation of previously methylated promoter re-gions permits transcription [2]. Two adverse phenomena characterize the process of carcinogenesis: locus-specific * Correspondence:[email protected]
1
Department of Biomedicine, University of Aarhus, Wilhelm Meyers Allé 4, The Bartholin Building, DK-8000 Aarhus C, Denmark
2
Department of Experimental Clinical Oncology, Aarhus University Hospital, Nørrebrogade 44, DK-8000 Aarhus C, Denmark
Full list of author information is available at the end of the article
hypermethylation and global depletion of methyl groups from cancer genomes. Hypermethylation of promoters has been widely shown to contribute to silencing of tumor suppressor genes during carcinogenesis. Global hypomethylation of the cancer genome was initially shown to cause genomewide allelic instability, but re-cently the involvement of this process in transcriptional gene regulation has become increasingly recognized [2].
DNA methylation changes have been shown to take part in the very first steps of neoplastic transformation, which makes methylation biomarkers very attractive targets for early cancer detection [3]. Moreover, many phenotypical features of the cancer are a consequence of the methylation changes. Those changes are pre-dominantly cancer type–specific and therefore have potential to be powerful biomarkers for cancer patient stratification [4].
In general, clinically useful biomarkers must be applic-able in one of the clinical disease management areas: diagnostics, prognostication and treatment monitoring. More than three decades of epigenetic research have provided strong research evidence that methylation-based biomarkers can be applied in all the above areas of clinical use. Nevertheless, current use of methylation biomarkers in clinical cancer management is very lim-ited. The difficulties in clinical implementation of the methylation biomarkers can be attributed mainly to low number of studies focused on extensive clinical valid-ation of the novel (and known) biomarkers.
A study aiming to develop a methylation biomarker for clinical use should, apart from utilizing state-of-the-art methylation detection methodologies, consist of five steps:
1. Discovery, whereby, in most of the cases
genomewide screening is applied in a search for the candidate biomarkers;
2. Initial clinical validation, whereby each candidate biomarker must be shown to provide an ability to distinguish nonmalignant healthy tissue from malignant cancer tissue;
3. Retrospective validation, whereby archival material is used to determine if there is a significant correlation between specific methylation changes and the disease phenotype. (Detailed records accompanying patient samples are critical for this part of the biomarker development process, and it is highly advisable to use samples from various patient populations in these studies.);
4. Prospective validation, whereby the biomarker is used in clinical trials; and
5. Long-term monitoring of the biomarker’s clinical use after the above-described biomarker development process to assess its impact.
Herein we present and discuss the results of the first two stages of the proposed biomarker development process for breast cancer.
Methods
Clinical sample material
Twenty freshly frozen breast carcinomas were obtained from Aarhus University Hospital, and DNA was ex-tracted from those samples using the DNeasy Blood & Tissue Kit (QIAGEN, Hilden, Germany) according to the manufacturer’s protocol. Seventy-four nonmalignant breast tissue samples from breast reduction surgeries were collected at the Department of Plastic Surgery, Aarhus University Hospital. The women undergoing breast reduction surgery had had mammograms, and only women without signs of malignancies were enrolled in this study. The breast tissue obtained from breast re-ductions can potentially differ from healthy breast tissue; however, because of ethical considerations, this type of control material was the only available source for our experiments. DNA taken from breast reduction samples was also extracted using the DNeasy Blood & Tissue Kit. Tumor DNA for screening analyses was obtained from 274 patients diagnosed with sporadic breast cancer. The DNA samples were collected between 1992 and 1994 at Aarhus University Hospital. Complete information about the breast cancer cohort and DNA extraction procedure were previously published [5,6]. Patient consent for our use of the human material in this study was obtained and approved by the Research Ethics Committee of Mid Jutland, Denmark.
Microarray analyses
The enrichment scores for the mean ratios of each class were subtracted to produce a differential score indicating enrichment or depletion of signal in one group relative to the other, and a significance threshold of 2 was applied to the differential scores. Two or more consecutive signifi-cant differential scores within 500 bases of each other con-stituted a differentially methylated region (DMR). Each DMR was mapped to the genome using NimbleScan soft-ware. Lists of the annotated regions can be found in Add-itional file 2. For the results presented in this paper, only the list of DMRs computed by subtraction of tumors from controls (hypermethylated DMRs) was manually mined for the candidate biomarkers. The potential candidate bio-markers (total of 24) with the highest differential scores were selected for validation analyses. All validation experi-ments were performed using methylation-sensitive high-resolution melting (MS-HRM) and verified by Sanger se-quencing. The microarray data were deposited in the Gene Expression Omnibus database (GEO) database [GEO:GSE43095].
Methylation-sensitive high-resolution melting
All MS-HRM assays were designed according to previ-ously published guidelines and optimized to allow for highly sensitive methylation detection [7,8]. In each run, a range of standards was included to control for un-biased sensitivity of the detection: 0% (unmethylated: EpiTect Control DNA; QIAGEN), 1% and 10% (fully methylated template in an unmethylated background) and 100% (methylated: EpiTect Control DNA). MS-HRM amplification was performed in triplicates. PCR mix consisted of 1× LightCycler 480 High Resolution Master mix (Roche, Penzberg, Germany), 3 mM Mg2+, 250 to 500 nM concentrations of each primer and 6 ng of template. PCR amplifications and HRM analyses were performed on the LightCycler 480 platform (Roche) and included 50 cycles at the assay-specific parameters de-scribed in Additional file 3. The conditions and primer sequences used in MS-HRM experiments are listed in Additional file 3. Bisulfite conversions of the clinical samples were performed with the EZ DNA Methylation-Gold Kit (ZymoResearch, Irvine, CA, USA).
Sequencing analyses
To confirm the MS-HRM results, a subset of MS-HRM PCR products was sequenced using the Sanger method as previously described [9]. In brief, PCR products ob-tained from MS-HRM analyses were directly sequenced using the same primers as those used for the MS-HRM analyses. To decrease the costs and labor required for the sequencing, the forward strand was sequenced from all the representative samples. In cases of ambiguous re-sults, the reverse strand was also sequenced. Overall, we performed more than 300 sequencing reactions to confirm
the MS-HRM results. Despite the fact that we attempted to sequence very small PCR products (around 100 bp; for details, see Additional file 3), we successfully and reprodu-cibly confirmed the methylation status for each HRM pro-file group described herein (see Results). We were not able to sequence WT1 and SIX6 PCR products (a very short PCR product), but our high confidence in the sequencing data derived from all other assays allowed us to generalize the results for those two DMRs. The sequencing data for samples displaying low-level methylation for the HTR1B MS-HRM assay did not show methylation. However taking into account both superior sensitivity of the MS-HRM over sequencing [9] and the fact that all other low-methylation profiles showed methylation on the sequencing data, we have classified these samples as low-level methylated (Table 1).
Statistical analyses
The statistical analyses were performed with the Stata 10.1 software package (StataCorp, College Station, TX, USA) and R statistics.
Results
Identification of hypermethylated loci
cases. The use of quantitative properties of MS-HRM in this experiment was therefore critical [7,10]. At the same time, this finding indicates that the microarray used in our experiments is able to robustly detect small relative differences in methylation between cases and controls.
Two of the MS-HRM assays used in the microarray validation experiments did not confirm the microarray results. One possible explanation is that PCR-based MS-HRM assays cover only approximately 100 bp, whereas the region with aberrant methylation called on the microarray can span large genomic regions and the methylation status within those sequence can differ [11]. Design of PCR assays without prior knowledge of the methylation changes throughout the region is still challenging and can simply result in targeting the part of the regions that does not undergo cancer-dependent methylation changes. This explanation does not rule out the possible technological limitations of the micro-array technology, however, which can lead to false dis-coveries. Despite the fact that false-positive results were present at a very low rate in our data set, the fact that they were present at all underlines the critical im-portance of validation of the results obtained by any genomewide screening technology by using PCR-based methods.
Initial clinical validation
[image:4.595.55.546.101.390.2]All DMRs positively validated in the microarray ation experiments were subjected to initial clinical valid-ation screening. In principle, this part of the biomarker development workflow aims to show (with a statistically sound sample number) the potential of the discovered DMR to distinguish between cancer (cases) and healthy controls. We have screened 275 samples of breast cancer with the same MS-HRM assays used in the microarray validation process as well as 74 DNA samples from breast reduction surgeries (representing healthy con-trols). The overall results of the initial clinical validation screening for the 19 DMRs are presented in Tables 1 and 2. The results of the screening for three of the DMRs are not included in the tables because the MS-HRM data for those DMRs were challenging to inter-pret. Further analyses of those loci have to be performed to clarify whether those DMRs are affected by specific genetic events occurring during breast tumor carcino-genesis (data not shown). The samples from the control group were subclassified into three groups on the basis of the MS-HRM results (Table 2): (1) samples displaying no methylation; (2) samples showing low levels of methy-lation with low-level methylation defined as methylation less than 1% standard or any aberrations from the Table 1 Frequencies of DNA methylation in the cancer tissue samples
Loci ID
Samples
availablea Methylation-negative,
n(%)
Low methylation,
n(%)b Heterogeneousmethylation,
n(%)
Full methylation,
n(%)
Both alleles present,n(%)
TITF1 220 0 (0.0) 38 (17.3) 0 145 (65.9) 37 (16.8)
HOXB13 239 18 (7.5) 20 (8.4) 0 23 (9.6) 178 (74.5)
NR2E1 164 15 (9.1) 14 (8.5) 18 (11.0) 89 (54.3) 28 (17.1)
HTR1B 162 28 (17.3) 68 (42.0) 20 (12.3) 4 (2.5) 42 (25.9)
HMX2 187 9 (4.8) 1 (0.5) 13 (7.0) 164 (87.7) 0
BC008699 261 4 (1.5) 4 (1.5) 26 (10.0) 206 (78.9) 21 (8.0)
SLC38A4 234 0 16 (6.8) 93 (39.7) 80 (34.2) 45 (19.2)
FLJ32447 264 0 28 (10.6) 191 (72.3) 48 (18.2) 0
WT1 218 44 (20.2) 0 178 (81.7) 21 (9.6) 0
TMEM132D 218 6 (2.8) 21 (9.6) 154 (70.6) 16 (7.3) 21 (9.6)
NKX2-3 169 0 16 (9.5) 108 (63.9) 38 (22.5) 7 (4.1)
GHSR 260 56 (21.5) 24 (9.2) 180 (69.2) 0 0
ONECUT 243 0 16 (9.5) 134 (55.1) 63 (25.9) 30 (12.3)
LHX1 243 0 28 (11.5) 145 (59.7) 41 (16.9) 29 (11.9)
SIX6 246 5 (2.0) 11 (4.5) 173 (70.3) 55 (22.4) 2 (0.8)
CA10 230 21 (9.1) 48 (20.9) 137 (59.6) 24 (10.4) 0
CHR 252 0 44 (17.5) 192 (76.2) 16 (6.3) 0
POU4F 255 10 (3.9) 6 (2.4) 195 (76.5) 44 (17.3) 0
PHOX2B 256 0 3 (1.2) 199 (77.7) 53 (20.7) 1 (0.4)
a
Variable numbers of the samples are reported because of clinical sample limitations.b
unmethylated profile; and (3) methylation-positive sam-ples. Interestingly, the cancer samples displayed a sig-nificant variety of the HRM profiles. The MS-HRM technology allowed us to evaluate heterogeneous methyla-tion in each sample screened. Heterogeneous methylamethyla-tion is referred to as the presence in the sample of multiple epialleles, each with a different pattern of methylated and unmethylated CpG sites for a given region. Heteroge-neously methylated samples display a characteristic HRM profile for the complex mixture of heteroduplexes formed between strands that only differ at a few CpG sites. The evaluation of heterogeneous methylation was not previ-ously performed on a large scale owing to technological limitations of the methods for methylation screening.
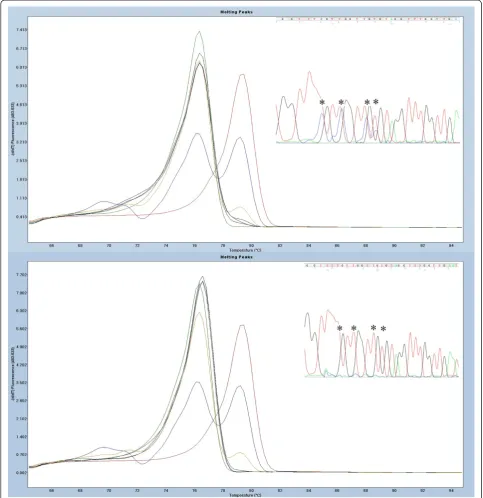
The significance of heterogeneous methylation is still debated, but this phenomenon may potentially be critical for the clinical application of methylation biomarkers (see Discussion for more details). Therefore, we have chosen to subdivide our results into five groups (see Table 1): (1) positive samples, (2) methylation-negative samples, (3) samples displaying heterogeneous methylation pattern, samples showing only fully methyl-ated melting profiles and (5) samples with both methylmethyl-ated and unmethylated alleles present. Figure 1 illustrates exam-ples of the different classes of HRM profiles detected in our analyses. To confirm the accuracy of the classification
of HRM profiles, we performed sequencing of a subset of the samples from each of the HRM profile groups and for each of the DMRs.
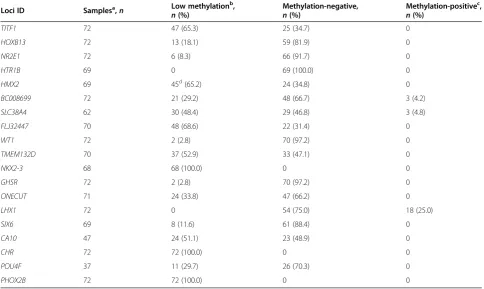
Specificity of the biomarkers and low-level methylation in controls
[image:5.595.56.541.101.390.2]The specificity of each of DMR was evaluated on the basis of MS-HRM screening of the control tissue. The results are presented in Table 2. Interestingly, we ob-served low-level methylation in control samples for 17 DMRs. The frequency of low-level methylation was as high as 100% for three of the loci (NKX2-3, CHR and PHOX2B). In addition, three loci (BC008699, SLC38A4 and LHX1) showed low frequencies of the methylation levels, similar to those observed in cancer tissue. These loci will not be further considered for biomarker devel-opment, as their specificity most likely will be very low. Figure 2 illustrates examples of the MS-HRM scans with low methylation levels and verification of the results by sequencing. Overall, on the basis of the sequencing re-sults, we conclude that any aberration of the HRM pro-file from the unmethylated standard indicates the presence of methylation in the analyzed sample. Only one DMR in our panel (HMX2) showed methylation levels between 1% and 10% in the control tissue samples. The methylation levels in controls at all other DMRs Table 2 Frequencies of DNA methylation in control tissue samples
Loci ID Samplesa,n Low methylation
b
,
n(%)
Methylation-negative,
n(%)
Methylation-positivec,
n(%)
TITF1 72 47 (65.3) 25 (34.7) 0
HOXB13 72 13 (18.1) 59 (81.9) 0
NR2E1 72 6 (8.3) 66 (91.7) 0
HTR1B 69 0 69 (100.0) 0
HMX2 69 45d(65.2) 24 (34.8) 0
BC008699 72 21 (29.2) 48 (66.7) 3 (4.2)
SLC38A4 62 30 (48.4) 29 (46.8) 3 (4.8)
FLJ32447 70 48 (68.6) 22 (31.4) 0
WT1 72 2 (2.8) 70 (97.2) 0
TMEM132D 70 37 (52.9) 33 (47.1) 0
NKX2-3 68 68 (100.0) 0 0
GHSR 72 2 (2.8) 70 (97.2) 0
ONECUT 71 24 (33.8) 47 (66.2) 0
LHX1 72 0 54 (75.0) 18 (25.0)
SIX6 69 8 (11.6) 61 (88.4) 0
CA10 47 24 (51.1) 23 (48.9) 0
CHR 72 72 (100.0) 0 0
POU4F 37 11 (29.7) 26 (70.3) 0
PHOX2B 72 72 (100.0) 0 0
a
Variable number of samples is reported due to clinical sample limitations.b
Low methylation is referred to as methylation similar to the methylation level observed in the 1% methylation standard.c
Methylation-positive samples are referred to as samples displaying a HRM profile characteristic for cases.d
were always below 1% when we analyzed the data against the 1% methylation level standard. The high fre-quency of low levels of methylation in the control tissue hampers the specificity of the biomarkers. However, the quantitative aspect of the MS-HRM technology allows establishment of a cutoff point for low-level methylation.
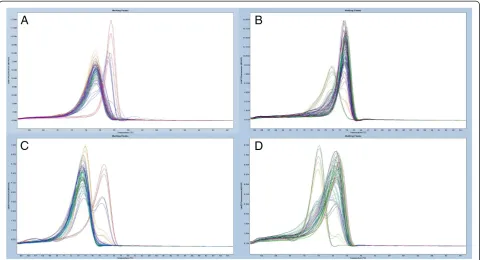
High methylation levels in cancer samples
Despite the fact that 17 of the DMRs from our panel showed low levels of methylation in the control tissue, those levels seem to be insignificant compared to the levels of the methylation observed at the same locus in the cancer samples. All tested DMRs showed drastic gains of methylation during carcinogenesis. A general switch in methylation pattern from unmethylated in controls to methylated in cancer samples for two of the screened loci (SIX6 and BC008699) is illustrated in Figure 3. Very few cancer samples in our cohort dis-played low methylation levels similar to those ob-served in the control tissue (see Table 1 for details). For specificity calculations, methylation in those sam-ples can be interpreted as a normal methylation level when a cutoff point has been established based on analyses of methylation in the control group. The cut-off points for low levels of methylation can provide
100% specificity for the methylation biomarkers. How-ever, before a cutoff point can be established, the pathological significance of low levels of methylation within each DMR has to be evaluated.
Two types of locus-specific methylation
The frequencies of methylation in cancer tissue samples are listed in Table 1. As shown, 12 DMRs in our panel displayed predominant gains of heterogeneous methyla-tion affecting from 55% to 81% of the samples. Five of the DMRs showed very low frequencies of heteroge-neous methylation (for example,TITF1andHMX2 with 65% and 87% of the cancer samples, respectively, show-ing the presence of full methylation of both alleles). No heterogeneous methylation was seen for the HOXB13 assay, but 74.5% of samples contained both methylated and unmethylated alleles at this DMR. Only one of the DMRs screened (SLC38A4) showed balanced frequencies of heterogeneous and full methylation of 39% and 34%, respectively.
[image:6.595.58.541.90.348.2]Functional and clinical effects of hypermethylation of the DMRs from our panel are outside the scope of this paper and will be addressed in future projects. However, it is interesting that the CGI we have targeted with our HOXB13 assay has previously been shown to undergo
hypermethylation in colon cancer [12]. Aberrant expression and methylation-dependent expression of the HOXB13 gene has been shown in cancer [13,14]. However, muta-tions within theHOXB13 gene and the linkage analyses of
[image:7.595.56.540.90.589.2]the neighboring 17q21–22 region found this region to be involved in the development of different cancers [15,16]. Our findings support those observations, and the fact that our results seem to indicate deactivation of only one allele
by DNA methylation makes this phenomenon even more intriguing.
Overall, our methylation screening results clearly show that a locus can undergo two types of methylation dur-ing carcinogenesis: either heterogeneous or full methyla-tion (at one or both alleles). The type of aberrant methylation seems to be locus-specific, and the mechan-ism of this process is unknown. To the best of our knowledge, our present study is the first to show this phenomenon, and the physiological and clinical conse-quences of this process have to be further researched. At the same time, the high locus specificity of the observed methylation changes indicates that our results are not a technological artefact of the methodology used in this study, but instead reflect a biological phenomenon.
Discussion
There is a strong base of research evidence to support the utility of methylation biomarkers in the entire process of clinical disease management, from screening for predisposition through detection of the condition to personalized treatment of the disease.
As mentioned in the Introduction, the process of bio-marker development for clinical applications can be de-scribed in five steps. The data presented herein address
the challenges of the first two steps of methylation bio-marker development for clinical use: discovery and ini-tial clinical validation. In the biomarker discovery step, microarray technologies and next-generation sequen-cing) are indispensable tools affording researchers, in a single experiment, the ability to uncover a landscape of methylation changes throughout a cell genome. Cur-rently, however, the complexity of those technologies does not allow for straightforward interpretation of the genomewide screening results. The validation step is es-pecially important when complicated statistical modeling is used to process microarray data. In the present study, we used a very simple statistical model for microarray data processing (see Methods). Despite the simple ap-proach involving very little data processing, validation experiments were necessary. They confirmed low (but present) false discovery results from the genomewide screening. This exemplifies the importance of validation of any genomewide methylation-based study before any conclusions are drawn. At the same time, our results il-lustrate that simple statistical models can be very effect-ive in the discovery of disease-dependent methylation aberrations.
[image:8.595.58.539.89.349.2]We have implemented an initial clinical validation of the biomarkers as a second step in the biomarker
Figure 3Examples of the overall methylation screening results in cases and controls illustrating a shift in methylation of the locus during carcinogenesis.Standards: 100% methylated (red), 10% methylated in a background of unmethylated template (blue), 1%
development workflow. This step, in which we initially aimed to answer only the question whether a potential biomarker can distinguish healthy tissue from cancer tis-sue, allowed us to address two important, recently emer-ging questions in the methylation biomarker field: (1) the question of the prevalence of low-level methylation of potential biomarkers in healthy tissue and the conse-quences of this phenomenon for biomarker specificity and (2) the question of the significance of the evaluation of heterogeneous methylation of potential biomarkers.
The significance of interindividual differences in low-level methylation of specific loci is frequently discussed in the field of methylation biomarkers [17,18]. There is no consensus with regard to the origin of this phenomenon and its pathological significance; however, the potential in-volvement of this type of methylation in disease predis-position has already been shown [19]. This phenomenon has direct influence on the specificity of the methylation biomarkers because, from the biomarker development perspective, methylation in healthy tissue should not be present in order for the biomarker to be highly inform-ative. Our data show that low-level methylation is very fre-quently present in healthy tissue, and our sequencing experiments provide evidence that the low-level methyla-tion we observed in our controls is not a technological artefact. The quantitative properties of the MS-HRM technology allow definition of a cut-off point for the low levels of methylation; however, before that can be done, the pathological insignificance of the low levels methyla-tion has to be shown for each biomarker. The high preva-lence of low-level methylation demonstrated in this study underlines the notion that evaluation of the low-level methylation in healthy tissue is critical for biomarker de-velopment and that only methods that allow for a defin-ition of a cutoff for background methylation levels are most likely to be applicable in clinical methylation bio-marker testing.
As mentioned above, a second very interesting finding of our initial clinical biomarker validation experiments in a relatively large-scale study is that the frequency of heterogeneous methylation can be very high, with some loci undergoing only heterogeneous methylation during carcinogenesis. Heterogeneous methylation was previ-ously shown to occur at some loci, but this phenomenon has never been studied extensively in a large sample. One reason could be the technological limitations of some of the methodologies used for DNA methylation assessment [9,20,21]. The MS-HRM technology allowed us to perform methylation screening with the capability of evaluating heterogeneous methylation in a large sam-ple panel [9]. To the best of our knowledge, we show for the first time a trend for loci to undergo two types of methylation during carcinogenesis, with some loci undergoing full methylation and others heterogeneous
methylation. Moreover, our results show that heteroge-neous methylation seems to be as specific to the locus as full methylation. Full methylation of the locus normally abolishes transcription. Heterogeneous methylation may not be sufficient to abolish transcription of the gene, but may interfere with only the transcription process or may be a “passenger” of the carcinogenesis process. Never-theless, these comments are only speculative, and the physiological and clinical significance of heterogeneous methylation has to be further researched in the future.
Overall, the initial clinical validation step in our bio-marker development procedure has allowed us to answer two critical questions for the potential applicability of the biomarker in clinical practice; hence, in our opinion, this step is essential for fast streamlining of the bio-marker validation process.
Conclusions
Our results show that loci undergoing hypermethylation during carcinogenesis can acquire either heterogeneous or full methylation. Furthermore, low-level methylation at those loci in nonmalignant tissue can be a common event. Consequently, researchers in studies addressing the clinical applicability of hypermethylated loci as bio-markers should evaluate the clinical relevance of both specific types of methylation, as well as low-level methy-lation of those loci in nonmalignant tissue.
Additional files
Additional file 1:Detailed methylated DNA immunoprecipitation (MeDIP) protocol used in the study.
Additional file 2:List of the differentially methylated regions obtained after processing of microarray data as described in the Methods section.
Additional file 3:Details of the methylation-sensitive high-resolution melting assays used in the validation experiments.
Competing interests
TKW and LLH are listed as inventors on a patent pending application for the aspects of MS-HRM technology. TKW, JO and LLH are also listed on a patent pending application for the aspects of the biomarkers discovered during this project. Roche Diagnostic, Penzberg, Germany, has partly supported this project based on the research agreement with the University of Aarhus, Denmark (under Danish legal regulations) but had no influence on the reporting of the results. A provisional patent application has been filed for the aspects of the new biomarkers by the University of Aarhus with TKW, JO and LLH listed as inventors.
Authors’contributions
TKW, JAW and BBT performed the experiments and analyzed the data. TKW and LLH drafted the manuscript. TED supervised obtaining ethical approval and collecting the specimens for the project. JO and LLH supervised the project. TKW, LLH, JO and TED conceived the project. All authors contributed to the editing of the final version of the manuscript and approved final version for publication.
Acknowledgements
Hager from the Department of Pathology, Aarhus University Hospital, for pathological assessment of the control samples and Tina Kjeldsen for excellent technical assistance during this project.
Author details 1
Department of Biomedicine, University of Aarhus, Wilhelm Meyers Allé 4, The Bartholin Building, DK-8000 Aarhus C, Denmark.2Department of Experimental Clinical Oncology, Aarhus University Hospital, Nørrebrogade 44, DK-8000 Aarhus C, Denmark.3Department of Plastic Surgery, Aarhus University Hospital, Nørrebrogade 44, DK-8000 Aarhus C, Denmark.
Received: 3 November 2012 Accepted: 13 January 2014 Published: 3 February 2014
References
1. Danish Health and Medicine:Cancer Incidence in Denmark 2001.Copenhagen: National Board of Health Statistics; 2006. http://sundhedsstyrelsen.dk/publ/ Publ2006/SESS/Cancer_incidens/Cancer_incidens_01.pdf (accessed 10 February 2014).
2. Stefanska B, Huang J, Bhattacharyya B, Suderman M, Hallett M, Han ZG, Szyf M: Definition of the landscape of promoter DNA hypomethylation in liver cancer.Cancer Res2011,71:5891–5903.
3. Suijkerbuijk KP, van Diest PJ, van der Wall E:Improving early breast cancer detection: focus on methylation.Ann Oncol2011,22:24–29.
4. Mikeska T, Bock C, Do H, Dobrovic A:DNA methylation biomarkers in cancer: progress towards clinical implementation.Expert Rev Mol Diagn 2012,12:473–487.
5. Hansen LL, Andersen J, Overgaard J, Kruse TA:Molecular genetic analysis of easily accessible breast tumour DNA, purified from tissue left over from hormone receptor measurement.APMIS1998,106:371–377. 6. Hansen LL, Yilmaz M, Overgaard J, Andersen J, Kruse TA:Allelic loss of
16q23.2-24.2 is an independent marker of good prognosis in primary breast cancer.Cancer Res1998,58:2166–2169.
7. Wojdacz TK, Dobrovic A, Hansen LL:Methylation-sensitive high-resolution melting.Nat Protoc2008,3:1903–1908.
8. Wojdacz TK, Hansen LL, Dobrovic A:A new approach to primer design for the control of PCR bias in methylation studies.BMC Res Notes2008,1:54. 9. Wojdacz TK, Møller TH, Thestrup BB, Kristensen LS, Hansen LL:Limitations
and advantages of MS-HRM and bisulfite sequencing for single locus methylation studies.Expert Rev Mol Diagn2010,10:575–580.
10. Migheli F, Stoccoro A, Coppedè F, Omar WAW, Failli A, Consolini R, Seccia M, Spisni R, Miccoli P, Mathers JC, Migliore L:Comparison study of MS-HRM and pyrosequencing techniques for quantification ofAPCandCDKN2Agene methylation.PLoS One2013,8:e52501.
11. Everhard S, Tost J, El Abdalaoui H, Crinière E, Busato F, Marie Y, Gut IG, Sanson M, Mokhtari K, Laigle-Donadey F, Hoang-Xuan K, Delattre JY, Thillet J: Identification of regions correlating MGMT promoter methylation and gene expression in glioblastomas.Neuro Oncol2009,11:348–356.
12. Ghoshal K, Motiwala T, Claus R, Yan P, Kutay H, Datta J, Majumder S, Bai S, Majumder A, Huang T, Plass C, Jacob ST:HOXB13, a target of DNMT3B, is methylated at an upstream CpG island, and functions as a tumor suppressor in primary colorectal tumors.PLoS One2010,5:e10338. 13. Rodriguez BAT, Cheng ASL, Yan PS, Potter D, Agosto-Perez FJ, Shapiro CL,
Huang THM:Epigenetic repression of the estrogen-regulatedHomeobox B13gene in breast cancer.Carcinogenesis2008,29:1459–1465.
14. Svingen T, Tonissen KF:Altered HOX gene expression in human skin and breast cancer cells.Cancer Biol Ther2003,2:518–523.
15. Alanee S, Couch F, Offit K:Association of a HOXB13 variant with breast cancer.N Engl J Med2012,367:480–481.
16. Ewing CM, Ray AM, Lange EM, Zuhlke KA, Robbins CM, Tembe WD, Wiley KE, Isaacs SD, Johng D, Wang Y,et al:Germline mutations in HOXB13 and prostate-cancer risk.N Engl J Med2012,366:141–149.
17. Dobrovic A, Kristensen LS:DNA methylation, epimutations and cancer predisposition.Int J Biochem Cell Biol2009,41:34–39.
18. Kristensen LS, Raynor MP, Candiloro I, Dobrovic A:Methylation profiling of normal individuals reveals mosaic promoter methylation of cancer-associated genes.Oncotarget2012,3:450–461.
19. Wong EM, Southey MC, Fox SB, Brown MA, Dowty JG, Jenkins MA, Giles GG, Hopper JL, Dobrovic A:Constitutional methylation of the BRCA1 promoter is specifically associated with BRCA1 mutation-associated
pathology in early-onset breast cancer.Cancer Prev Res (Phila)2011, 4:23–33.
20. Candiloro IL, Mikeska T, Dobrovic A:Assessing combined methylation-sensitive high resolution melting and pyrosequencing for the analysis of heterogeneous DNA methylation.Epigenetics2011,6:500–507. 21. Mikeska T, Candiloro IL, Dobrovic A:The implications of heterogeneous
DNA methylation for the accurate quantification of methylation. Epigenomics2010,2:561–573.
doi:10.1186/bcr3612
Cite this article as:Wojdaczet al.:Identification and characterization of locus-specific methylation patterns within novel loci undergoing hypermethylation during breast cancer pathogenesis.Breast Cancer Research201416:R17.
Submit your next manuscript to BioMed Central and take full advantage of:
• Convenient online submission
• Thorough peer review
• No space constraints or color figure charges
• Immediate publication on acceptance
• Inclusion in PubMed, CAS, Scopus and Google Scholar
• Research which is freely available for redistribution