R E S E A R C H A R T I C L E
Open Access
Development of a microarray for two rice
subspecies: characterization and validation
of gene expression in rice tissues
Jia-Shing Chen
†, Shang-Chi Lin
†, Chia-Ying Chen, Yen-Ting Hsieh, Ping-Hui Pai, Long-Kung Chen
and Shengwan Lee
*Abstract
Background:Rice is one of the major crop species in the world helping to sustain approximately half of the global population’s diet especially in Asia. However, due to the impact of extreme climate change and global warming, rice crop production and yields may be adversely affected resulting in a world food crisis. Researchers have been keen to understand the effects of drought, temperature and other environmental stress factors on rice plant growth and development. Gene expression microarray technology represents a key strategy for the identification of genes and their associated expression patterns in response to stress. Here, we report on the development of the rice OneArray® microarray platform which is suitable for two major rice subspecies,japonica and indica.
Results:The rice OneArray® 60-mer, oligonucleotide microarray consists of a total of 21,179 probes covering 20,806 genes ofjaponicaand 13,683 genes ofindica. Through a validation study, total RNA isolated from rice shoots and roots were used for comparison of gene expression profiles via microarray examination. The results were submitted to NCBI’s Gene Expression Omnibus (GEO). Data can be found under the GEO accession number GSE50844
(http://www.ncbi.nlm.nih.gov/geo/query/acc.cgi?acc=GSE50844). A list of significantly differentially expressed genes was generated; 438 shoot-specific genes were identified among 3,138 up-regulated genes, and 463 root-specific genes were found among 3,845 down-regulated genes. GO enrichment analysis demonstrates these results are in agreement with the known physiological processes of the different organs/tissues. Furthermore, qRT-PCR validation was performed on 66 genes, and found to significantly correlate with the microarray results (R = 0.95, p < 0.001***). Conclusion:The rice OneArray® 22 K microarray, the first rice microarray, covering bothjaponicaandindica subspecies was designed and validated in a comprehensive study of gene expression in rice tissues. The rice OneArray® microarray platform revealed high specificity and sensitivity. Additional information for the rice OneArray® microarray can be found at http://www.phalanx.com.tw/index.php.
Keywords:Japonica,Indica, Rice, Microarray
Background
Rice is one of the most important crops in the world - a staple food supporting more than half of the world’s 7 billion people. By 2050, the global population is antici-pated to expand between 7.5 and 10.5 billion with the growth concentrated mainly in rice consuming coun-tries. According to a 2009 report by the United Nations Food and Agriculture Organization (FAO), the world
will have to produce 70% more food by 2050 to feed a projected extra 2.3 billion people. As such, rice crop production will play an important role to maintain food security in the coming future.
In recent years due to abnormal climate changes, sev-eral grain countries such as Australia, Brazil, and Thailand, have suffered frequently from devastating floods and droughts, resulting in global grain crop losses and food price inflation. Additionally, extreme weather events have occurred with more frequency throughout the Asia Pacific region; for example, Typhoon Morakot brought catastrophic damage to Taiwan in 2009 [1]. * Correspondence:[email protected]
†Equal contributors
Phalanx Biotech Group, 6F, No.6, Technology Road 5, Hsinchu Science Park, Hsinchu 30078, Taiwan, Republic of China
Furthermore, substantial decreases in rice yields due to increased nighttime temperatures associated with global warming [2], and increased minimum air temperatures during growing seasons have been reported in China and Philippines with predictions of this phenomenon continu-ing [2,3]. Increascontinu-ing in atmospheric brown clouds and greenhouse gas has been proposed to reduce historical rice harvests in India well below expected levels. These studies have profound implications for ongoing and future efforts for climate and air quality improvements [4,5].
Therefore, the development of new rice strains against the threat of climate change and water shortages is an important issue of food security for the coming future [6,7]. Traditional rice breeding techniques required up-wards of 10 years to develop new rice strains due to a multi-generational process of selecting and preserving strain variety in the offspring. The application of mo-lecular marker-assisted breeding will facilitate the pyra-miding of desirable alleles at multiple loci and shorten the time needed for developing new varieties [8]. An in-crease in the fundamental knowledge of rice biology (e.g. seed formation, disease resistance, growth etc.) is neces-sary to provide for effective strategies to improve crop yield and production. Nevertheless, the majority of the rice consumption is produced by indica subspecies, but the greater part of the genomic work is done onjaponica. To overcome the imbalance in rice related studies, it is im-portant to generate a microarray using in both subspecies.
To aid rice researchers and plant biologists, the rice OneArray® gene expression microarray was developed by Phalanx Biotech Group Inc. Based on the rice genome sequences from the Rice Genome Annotation Project (version 6.1) and the Beijing Genome Institute 2008 database, probes were designed and selected to cover 90% of the well-annotated Gene found on bothjaponica
and indica subspecies. Researchers will find the rice OneArray® microarray suitable for large-scale basic stud-ies, stress physiology research, and biomarker discovery.
In this paper, we report the development and validation of the 22 k rice OneArray® oligo-microarray platform manufactured by Phalanx Biotech Group, Inc. The high data reproducibility on technical replicates and the plat-form’s capacity to identify differential gene expression in different tissues and rice subspecies was demonstrated.
Results and discussion
Rice OneArray® gene selection and probe design
The primary goal of this project was to develop a rice microarray platform to study gene expression patterns relevant to important biological and physical controls acrossjaponicaandindicasubspecies. The rice OneArray® microarray was specifically designed to cover important regulatory pathways and to include genes involved in the biological function of chloroplasts, oxidative stress, grain
quality, nitrogen phosphate, sugar synthesis, photosyn-thesis, plant hormone, anther development, and transcrip-tion factors. 9719japonicatarget genes were curated and selected from a compilation of databases including Michigan State University database (ftp://ftp.plantbiology. msu.edu/pub/data/Eukaryotic_Projects/o_sativa/annotation_ dbs/pseudomolecules/chloroplast.dir/chrC.cDNA), GOSlim (http://rice.plantbiology.msu.edu/annotation_pseudo_ goslim.shtml), K E G G (http://www.kegg.jp/kegg-bin/ show_organism?menu_type=pathway_maps&org=osa), Gramene (ftp://ftp.gramene.org/pub/gramene/pathways/ ricecyc/), and PlnTFDB (http://plntfdb.bio.uni-potsdam. de/v3.0/). mRNA transcript sequences of each japonica
target gene were first subjected for microarray probe de-sign by using IMPORT software (Industrial Technology Research Institute of Taiwan, R.O.C). Probes were de-signed according to the following criteria; 60 nucleotides in length, GC% between 40-60%, fewer than 6 simple nu-cleotide repeats, and probe location within 1200 bp from 3’terminus. To remove the probes with non-specific bind-ing and strong secondary-structure, probe sequences were run through Blast analyses against japonica (from Rice Genome Annotation Project (version 6.1)) and indica
whole genome sequences (from BGI; Beijing Genome In-stitute). Based on the above probe design procedure, 92% of 9719 japonica target genes and 86% of 8995 indica
[image:2.595.306.540.481.637.2]target genes were selected for inclusion on the rice OneArray® microarray. The probe set was further supple-mented with probes against well-annotated genes as de-fined by Gene Ontology. In total, 21,179 probes (Figure 1)
Figure 1Number of probes in the microarray represented in japonicaandindicasubspecies.A total of 21,179 probes were classified into seven groups(A, B, C, D, E, F and G)based on Blast analysis against corresponding genomes of both subspecies. For japonica, 20,806 probes were represented amongA,B,D,E,F, andG
groups, with single hit probes in groupA,B, andD, and multiple-hits probes in groupE,F, andG. For indica, 13,683 probes were incorporated inA,C,E,D, andGgroups, with single hit probes in groupA,C, andE
were selected and designed based on the rice whole gen-ome sequences fromjaponicaandindica subspecies, plus 824 control probes including IHC (Intrinsic Hybridization Control), IHL (Intrinsic Hybridization Ladder), ITQC (In-trinsic Target Quality control), and negative controls. In summary, the rice OneArray® microarray is suitable for the detection of 20,806 genes of japonica and 13,683 genes ofindica.
Array quality
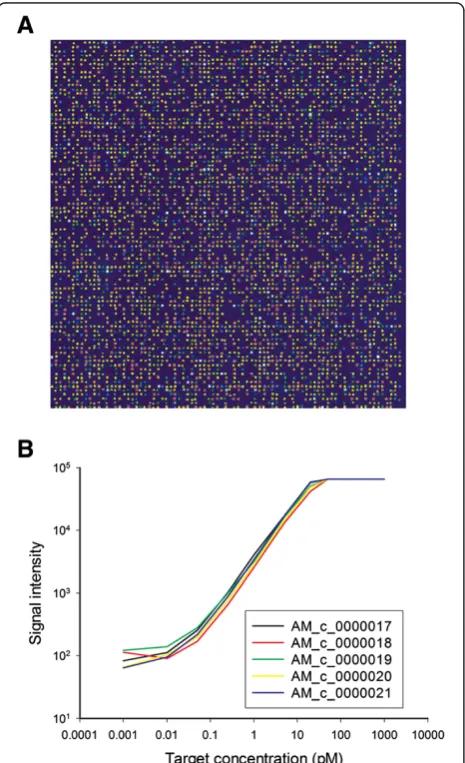
Each microarray undergoes a spot QC process to evaluate probe deposition and immobilization efficiency. In brief, microarrays were incubated with random, 10-mer oligo probes labeled with Cy3 using the standard hybridization protocol (Figure 2A). The sensitivity and dynamic detec-tion range of the rice OneArray miroarray were tested
using commercially available external control probe sets (external spike-in system) supplemented with 10μg Cy5-labeled aRNA of rice shoot. The results showed that the minimal detectable concentration of probes was approxi-mately 0.05 pM (Figure 2B). In summary, the rice micro-array demonstrated high sensitivity and dynamic range in this gene expression profiling study.
Rice OneArray® microarray technical performance
The Phalanx microarray platform is based upon the hybridization of a single labeled sample (derived from RNA), followed by one-channel detection. The intensity of the hybridization signal is used to determine target concentration. In order to validate the technical quality of each probe in our arrays, we carried out 10 independ-ent hybridizations on samples represindepend-enting two differindepend-ent rice tissues–root and shoot.
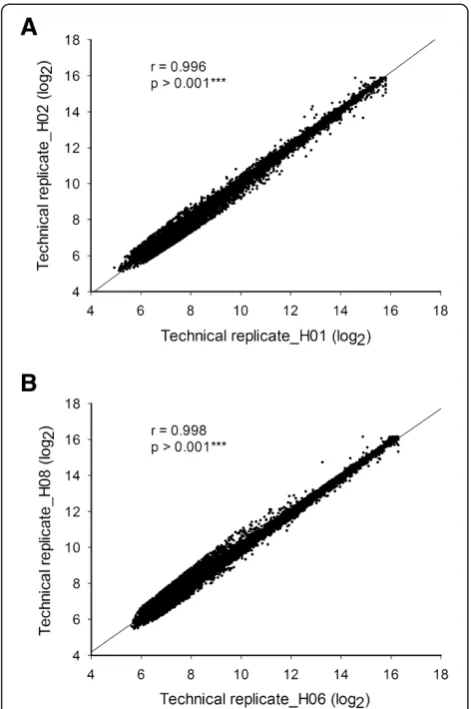
To examine the gene expression profiles between rice root and shoot development, total RNA extracted from rice root and shoot were processed on the rice OneArray® microarray following the standard protocol using five arrays for each tissue type. Raw expression data from 10 microarrays (e.g. 5 arrays × 2 tissues) were normalized and Pearson’s correlation coefficients were calculated for the data sets of hybridization signal inten-sities. All normalized and raw data were submitted to NCBI’s Gene Expression Omnibus (GEO) for others to examine. The data are accessible via GEO Series acces-sion number GSE50844 http://www.ncbi.nlm.nih.gov/ geo/query/acc.cgi?acc=GSE50844. It was demonstrated that the average spot number of each tissue was approxi-mately 18,000 spots with an average signal intensity of each spot of 3,000. High correlation coefficients were ob-tained in all cases and the results obob-tained for the rice root and shoot sample are shown in Figure 3A (r = 0.996; p-value <0.001***) and 3B (r = 0.998; p-value <0.001***) re-spectively. Furthermore, the significant correlation was ob-served between technical repeats (Table 1, R > 0.983) in each of the 5 arrays. In summary, 90% of probes can be detected in rice root and shoot tissue, the detectable spot percentage is higher than other species array data (60-70%). The higher coverage rate of the rice OneArray® microarray may be attributed to the comprehensive target gene selection of genes relevant to rice development. These results also demonstrate high correlation between different technical experiments underlining the high preci-sion manufacturing of the rice OneArray® microarray platform.
Comparison of gene expression in rice root and shoot using gene ontology analysis
[image:3.595.58.291.310.692.2]To elucidate the genes regulating rice tissue develop-ment, comparisons between shoot and root gene expres-sion profiles from the rice OneArray® microarray were
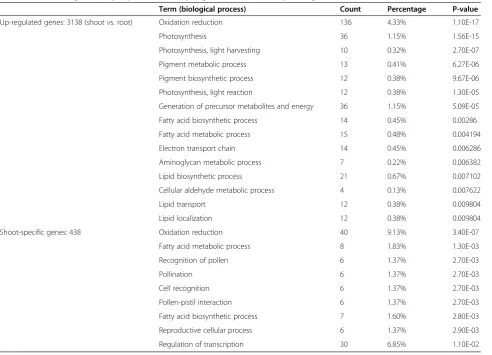
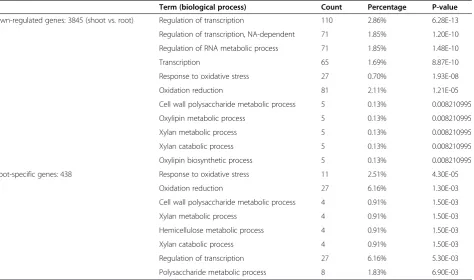
normalized and analyzed using Rosetta software. A list of differentially expressed genes was generated; among 3,138 up-regulated genes (Additional file 1), 438 were shoot-specific genes (Additional file 2), and among 3,845 down-regulated genes (Additional file 3), 463 were root-specific genes (Additional file 4). Gene set analysis was performed using Gene Ontology terms with functional annotation, as described in DAVID Bioinformatics Re-sources 6.7 (http://david.abcc.ncifcrf.gov/) [9,10]. First, this method detects significantly up- or down-regulated clusters of functionally related genes in lists ordered by differential expression. Annotated genes in these differ-ent groups were then classified into differdiffer-ent GO bio-logical processes and the percentages of differential gene expressions were calculated for each process. Among up-regulated genes, GO biological processes included oxidation reduction (4.33%), photosynthesis (1.15%), pigment metabolic (0.41%) and biosynthetic process (0.38%), and fatty acid metabolic (0.48%) and biosyn-thetic processes (0.45%). A similar set of GO processes were observed in the shoot-specific cluster (Table 2). Among down-regulated genes, GO biological processes included regulation of transcription (2.86%), response to oxidative stress (0.7%), and cell wall polysaccharide metabolic processes (0.13%), of which the majority was observed in root-specific cluster (Table 3). Overall, these results are in general agreement with the known physio-logical processes of the different organs/tissues suggest-ing the rice OneArray® platform is capable of providsuggest-ing reliable gene-expression data.
qRT-PCR validation
[image:4.595.56.292.88.443.2]To further validate the microarray results, quantitative real time PCR (qRT-PCR) assays were performed on the same RNA samples used for microarray analysis. A total of 66 genes at varying expression levels including up-regulated,
Figure 3Rice OneArray® microarray reproducibility.Scatter plot indicating correlation between microarray technical replicates. High correlations were found between all technical replicates.A. rice shoot (r = 0.996, p < 0.001***).B. rice root (r = 0.998, p < 0.001***).
Table 1 The correlation between technique repeats of rice shoot and root
Shoot Root
H01 H02 H03 H04 H05 H06 H07 H08 H09 H10
H01 1.000 0.989 0.987 0.986 0.985 0.670 0.673 0.674 0.675 0.672
H02 1.000 0.991 0.985 0.988 0.678 0.678 0.681 0.682 0.678
Shoot H03 1.000 0.987 0.988 0.681 0.679 0.683 0.681 0.678
H04 1.000 0.983 0.667 0.673 0.671 0.675 0.671
H05 1.000 0.674 0.679 0.677 0.681 0.677
H06 1.000 0.984 0.994 0.987 0.983
H07 1.000 0.987 0.993 0.985
Root H08 1.000 0.990 0.985
H09 1.000 0.986
[image:4.595.56.545.565.735.2]down-regulated, and not differentially-expressed were se-lected for validation by comparison of root and shoot ex-pression profiles. Comparisons between microarray and qRT-PCR data are shown (Table 4), and microarray results correlated well with qRT-PCR validation (Figure 4, R = 0.95, p < 0.001***).
Conclusions
A newly-designed rice microarray, the rice OneArray® 22 K microarray, was provided for examining both
japonicaandindicasubspecies. It was demonstrated this platform displayed high specificity and sensitivity follow-ing a comprehensive validation. Based on the unique de-sign, we believe this microarray will be of interest to many researchers in rice studies, especially in important bio-logical and physical controls, and it can be used to facili-tate the functional studies toward a hybrid subspecies.
Methods
Tissue preparation and total RNA extraction
A three-leaf-stage japonica subspecies (Tainung 67, TNG 67) was selected and subjected for total RNA
extraction. In general, 100 mg of rice tissue was cut into 5 cm lengths and stored immediately in RNAlater (Invi-trogen, Carlsbad, CA, USA) at 4°C until RNA isolation. Rice tissues were homogenized using a RNase-free mor-tar before performing RNA extraction, and total RNA was isolated from rice roots and shoots using the Qiagen RNeasy Mini kit (Qiagen, Chatsworth, CA, USA) ac-cording to manufacture’s protocols.
cRNA amplification
[image:5.595.57.550.98.453.2]1 μg of total RNA was converted to double stranded cDNA using reverse transcriptase, and amplified by in vitro transcription using MessageAmpII aRNA Amplifi-cation kit (Ambion Inc., Austin, Texas, USA). The synthe-sized cRNA was subsequently conjugated with Cyanine 5 NHS ester dye (GE Healthcare, Milwaukee, WI, USA). cRNA yield and labeling efficiency was calculated based on ND-1000 spectrophotometer measurements (NanoDrop Technologies, Wilmington, DE, USA). Incorporation rates of 20–60 dye molecules per 1,000 bases (20–33 bases/dye molecule) yielded the most usable data.
Table 2 Go term significantly represented in up-regulated and shoot-specific gene clusters
Term (biological process) Count Percentage P-value
Up-regulated genes: 3138 (shoot vs. root) Oxidation reduction 136 4.33% 1.10E-17
Photosynthesis 36 1.15% 1.56E-15
Photosynthesis, light harvesting 10 0.32% 2.70E-07
Pigment metabolic process 13 0.41% 6.27E-06
Pigment biosynthetic process 12 0.38% 9.67E-06
Photosynthesis, light reaction 12 0.38% 1.30E-05
Generation of precursor metabolites and energy 36 1.15% 5.09E-05
Fatty acid biosynthetic process 14 0.45% 0.00286
Fatty acid metabolic process 15 0.48% 0.004194
Electron transport chain 14 0.45% 0.006286
Aminoglycan metabolic process 7 0.22% 0.006382
Lipid biosynthetic process 21 0.67% 0.007102
Cellular aldehyde metabolic process 4 0.13% 0.007622
Lipid transport 12 0.38% 0.009804
Lipid localization 12 0.38% 0.009804
Shoot-specific genes: 438 Oxidation reduction 40 9.13% 3.40E-07
Fatty acid metabolic process 8 1.83% 1.30E-03
Recognition of pollen 6 1.37% 2.70E-03
Pollination 6 1.37% 2.70E-03
Cell recognition 6 1.37% 2.70E-03
Pollen-pistil interaction 6 1.37% 2.70E-03
Fatty acid biosynthetic process 7 1.60% 2.80E-03
Reproductive cellular process 6 1.37% 2.90E-03
Microarray pre-hybridization
Rice OneArray® microarrays were pre-heated at 60°C for 10 min in hybridization oven. Microarray slides were placed inside a falcon tube containing 100% ethanol, in-cubated for approximately 15 sec, shaken for 20 sec, and thoroughly rinsed with deionized water to remove any residual ethanol. Next, the microarray slides were fully submerged in an abundant amount of pre-hybridization solution (5X SSPE, 0.1% SDS, and 1% BSA) for 1 hr at 42°C. After 1 hr, slides were transferred to room-temperature dis-tilled water and washed gently for 2 min. Slides were spun dry for 2 min and stored in a dry and dark place until hybridization.
Microarray hybridization
10μg of cRNA was fragmented by using RNA Fragmenta-tion Reagent kit (AM#8740, Ambion Inc., Austin, Texas, USA), and then denatured in a PCR machine at 95°C for 5 minutes and held at 60°C. Fragmented cRNA was hybrid-ized on the rice OneArray® (Phalanx Biotech Group, Taiwan) at 50°C for 14–16 hrs. After hybridization, the mi-croarrays were washed sequentially in 2X SSC containing 0.2% SDS solution for 5 min at 42°C, 2X SSC for 5 min at 42°C, and 2X SSC for 5 min at room temperature. Finally, the microarrays were spun dry with a centrifuge for at least one minute and stored dry in the dark until ready for scanning.
Image scanning
Raw intensity signals for each scanned microarray were captured at 10-μm resolution using GenePix Personal 4000B (Molecular Devices Corporation, Sunnyvale, CA, USA), quantified by GenePix™Pro 4.0 software (Molecular Devices Corporation, Downingtown, PA, USA), and stored in GPR format. Microarray images were saved as TIFF files. Auto Photomultiplier tube (PMT) settings were se-lected and adjusted to include the overall feature inten-sities of Cy5 channel.
Data processing and statistical analysis
[image:6.595.66.541.100.380.2]The data from all microarrays was processed using pro-prietary modeling techniques developed on the Rosetta Resolver® System (Rosetta Biosoftware, Seattle, WA, USA). Raw data is comprised of probe intensities, back-ground values, detected signals, signal-to-noise ratio data, probe identification and gene annotations. After probe filtering based on flag note criteria, normalization of raw intensity was achieved by median scaling and the mean of the technical repeats. The log2 (Ratio) were cal-culated by pair-wise combination and error weighted average. Significant differentially expressed genes (DE genes) were selected according to its log2 (Ratio) and P-value based on the following criteria; log2 (Ratio) > = 1 and P-value (differentially expressed) <0.05.
Table 3 Go term significantly represented in down-regulated and root-specific gene clusters
Term (biological process) Count Percentage P-value
Down-regulated genes: 3845 (shoot vs. root) Regulation of transcription 110 2.86% 6.28E-13
Regulation of transcription, NA-dependent 71 1.85% 1.20E-10
Regulation of RNA metabolic process 71 1.85% 1.48E-10
Transcription 65 1.69% 8.87E-10
Response to oxidative stress 27 0.70% 1.93E-08
Oxidation reduction 81 2.11% 1.21E-05
Cell wall polysaccharide metabolic process 5 0.13% 0.008210995
Oxylipin metabolic process 5 0.13% 0.008210995
Xylan metabolic process 5 0.13% 0.008210995
Xylan catabolic process 5 0.13% 0.008210995
Oxylipin biosynthetic process 5 0.13% 0.008210995
Shoot-specific genes: 438 Response to oxidative stress 11 2.51% 4.30E-05
Oxidation reduction 27 6.16% 1.30E-03
Cell wall polysaccharide metabolic process 4 0.91% 1.50E-03
Xylan metabolic process 4 0.91% 1.50E-03
Hemicellulose metabolic process 4 0.91% 1.50E-03
Xylan catabolic process 4 0.91% 1.50E-03
Regulation of transcription 27 6.16% 5.30E-03
Table 4 Comparison of expression levels (log2 ration) from qRT-PCR and microarray for selected target genes
Target gene MSU Gene ID Microarray value
(log2ratio)
qRT-PCR value (log2ratio)
Zinc finger, C3HC4 type, domain containing protein, expressed Os07g29600 0.73 0.14
bZIP transcription factor domain containing protein, expressed Os07g48180 −0.04 −0.7
Ankyrin repeat-rich protein, putative, expressed Os08g15840 −0.99 −0.66
bZIP transcription factor domain containing protein, expressed Os08g26880 1.42 1.19
Zinc finger family protein, putative, expressed Os08g03310 4.58 4.99
MYB family transcription factor, putative, expressed Os08g33660 3.93 2.8
B-box zinc finger family protein, putative, expressed Os09g35880 0.93 0.97
Zinc finger, C3HC4 type domain containing protein, expressed Os09g33670 −0.13 −0.12
MYB family transcription factor, putative, expressed Os09g36250 0.75 0.2
OsWRKY80 - Superfamily of TFs having WRKY and zinc finger domains, expressed
Os09g30400 −0.17 −0.48
BHLH transcription factor, putative, expressed Os09g32510 2.66 1.73
Zinc finger, C3HC4 type domain containing protein, expressed Os09g26400 −0.17 −0.53
Dof zinc finger domain containing protein, putative, expressed Os09g29960 2.57 2.71
Auxin response factor 18, putative, expressed Os10g33940 −1.11 −0.32
Transcription factor, putative, expressed Os12g13170 −0.08 0.66
ZOS12-05 - C2H2 zinc finger protein, expressed Os12g31840 −0.45 −0.38
OsRR4 type-A response regulator, expressed Os01g72330 2.53 2.42
Inducer of CBF expression 2, putative, expressed Os01g70310 4.86 4.05
PHD finger protein, putative, expressed Os01g66420 0.02 −0.28
SNF2 family N-terminal domain containing protein, expressed Os02g02290 0.14 0.11
MYB family transcription factor, putative, expressed Os01g59660 −1.41 −0.76
No apical meristem protein, putative, expressed Os01g48130 0.31 −0.02
GATA transcription factor 25, putative, expressed Os02g05510 −0.53 −0.09
PHD finger protein, putative, expressed Os02g35600 2.08 0.74
AP2 domain containing protein, expressed Os02g29550 0.42 1.23
Two-component response regulator, putative, expressed Os02g55320 0.84 0.46
OsMADS22 - MADS-box family gene with MIKCc type-box, expressed Os02g52340 2.78 2.13
Histidine kinase, putative, expressed Os02g50480 0.12 0.49
DIRP family protein, putative, expressed Os03g43800 −0.18 0.21
OsWRKY55 - Superfamily of TFs having WRKY and zinc finger domains, expressed
Os03g20550 −2.11 −2.45
ZOS3-23 - C2H2 zinc finger protein, expressed Os03g61640 −0.64 0.3
NAC domain-containing protein 67, putative, expressed Os03g60080 −4.04 −4.17
MYB family transcription factor, putative, expressed Os04g49450 −2.27 −2.01
Auxin response factor, putative, expressed Os04g57610 1.17 1.13
MYB_Al protein, putative, expressed Os04g58020 0.1 −0.12
Zinc RING finger protein, putative, expressed Os06g03580 −2.82 −2.41
bHelix-loop-helix transcription factor, putative, expressed Os05g46370 −0.55 −0.81
Transcription factor, putative, expressed Os05g37170 −2.58 −1.44
myb-like DNA-binding domain containing protein, expressed Os06g24070 4.09 4.63
Zinc finger protein, putative, expressed Os06g33810 0.27 −0.25
N-terminal asparagine amidohydrolase, putative, expressed Os06g41390 −0.6 −0.02
Quantitative real-time RT-PCR
Total RNA was isolated according to the methodology pre-viously described. Primer designs are listed in Additional file 5. 2 ug of total RNA was used to synthesize first-strand cDNA using random hexamers and cDNA reverse tran-scription kit (Applied Biosystems, Foster City, CA, USA) in a reaction volume of 20μL. The PCR reactions were per-formed in a 20μL volume containing 1× Fast SYBR Green Master Mix, 20 ng cDNA, 10 nM of forward primers, 10 nM of reverse primers using an ABI Prism 7900 HT se-quence detection system (Applied Biosystems, Foster City, CA, USA). The amplification conditions were as follows; 95°C for 20 sec, followed by 40 cycles of 95°C for 5 sec and 60°C for 30 sec, and final soak at 4°C. Actin RNA served as the internal control. The levels of 66 mRNA expressions in each of the rice tissue samples were measured by using the
2-△△Ct method. All measurements were performed in
[image:8.595.61.537.112.460.2]triplicate and the experiments were repeated at least twice.
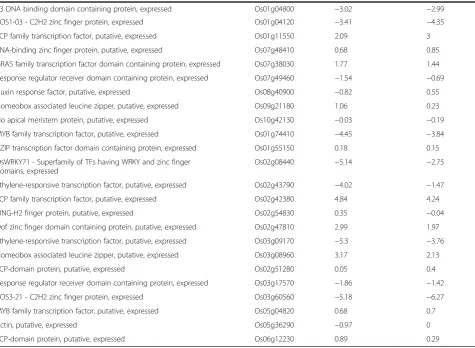
Table 4 Comparison of expression levels (log2 ration) from qRT-PCR and microarray for selected target genes (Continued)
B3 DNA binding domain containing protein, expressed Os01g04800 −3.02 −2.99
ZOS1-03 - C2H2 zinc finger protein, expressed Os01g04120 −3.41 −4.35
TCP family transcription factor, putative, expressed Os01g11550 2.09 3
RNA-binding zinc finger protein, putative, expressed Os07g48410 0.68 0.85
GRAS family transcription factor domain containing protein, expressed Os07g38030 1.77 1.44
Response regulator receiver domain containing protein, expressed Os07g49460 −1.54 −0.69
Auxin response factor, putative, expressed Os08g40900 −0.82 0.55
Homeobox associated leucine zipper, putative, expressed Os09g21180 1.06 0.23
No apical meristem protein, putative, expressed Os10g42130 −0.03 −0.19
MYB family transcription factor, putative, expressed Os01g74410 −4.45 −3.84
bZIP transcription factor domain containing protein, expressed Os01g55150 0.18 0.15
OsWRKY71 - Superfamily of TFs having WRKY and zinc finger domains, expressed
Os02g08440 −5.14 −2.75
Ethylene-responsive transcription factor, putative, expressed Os02g43790 −4.02 −1.47
TCP family transcription factor, putative, expressed Os02g42380 4.84 4.24
RING-H2 finger protein, putative, expressed Os02g54830 0.35 −0.04
Dof zinc finger domain containing protein, putative, expressed Os02g47810 2.99 1.97
Ethylene-responsive transcription factor, putative, expressed Os03g09170 −5.3 −3.76
Homeobox associated leucine zipper, putative, expressed Os03g08960 3.17 2.13
TCP-domain protein, putative, expressed Os02g51280 0.05 0.4
Response regulator receiver domain containing protein, expressed Os03g17570 −1.86 −1.42
ZOS3-21 - C2H2 zinc finger protein, expressed Os03g60560 −5.18 −6.27
MYB family transcription factor, putative, expressed Os05g04820 0.68 0.7
Actin, putative, expressed Os05g36290 −0.97 0
TCP-domain protein, putative, expressed Os06g12230 0.89 0.29
Gene expression was calculated as log2ratio of shoot vs. root samples. Gene ID was obtained from Michigan State University database.
[image:8.595.58.290.504.684.2]Additional files
Additional file 1:Analyses of up-regulated gene expression be-tween rice shoot and root tissues.Excel file containing the raw data of up-regulated genes represented for shoot vs. root.
Additional file 2:Shoot-specific expression genes.Excel file containing the raw data of shoot-specific expression genes represented for comparison between shoot and root.
Additional file 3:Analyses of down-regulated gene expression be-tween rice shoot and root tissues.Excel file containing the raw data of down-regulated genes represented for shoot vs. root.
Additional file 4:Root-specific expression genes.Excel file containing the raw data of root-specific expression genes represented for compari-son between shoot and root.
Additional file 5:Primer design list for qRT-PCR validation.Word table containing the selected gene description and primer sequences indicated the primers used for qRT-PCR examination.
Competing interests
The authors declare that they have no competing interests.
Author’s contributions
SL drafted the manuscript. JSC, SCL, CYC, YTH, PHP, and LC collected the genes information and designed those probes. JSC and PHP tested the microarray quality and performed microarray experiment for rice tissues. SCL and LC performed bioinformatic analysis of microarray QC testing, the statistical analysis of expression data and GO functional analysis. JSC and SCL designed and coordinated the study. All authors read and approved the final manuscript.
Acknowledgements
We would like to thank Professor Men-Chi Chang (Department of Agronomy, National Taiwan University), Maurice S. B. Ku (Institute of Agricultural Biotech-nology, College of Agriculture, National Chiayi University), and Yong-Pei Wu (Chiayi Agricultural Experiment Station, Taiwan Agricultural Research Institute) for providing rice tissues and advising on the microarray design. This work was partially supporting by a grant from the Council of Agriculture, Taipei, Taiwan.
Received: 21 March 2013 Accepted: 3 January 2014 Published: 8 January 2014
References
1. Butler CD:Food security in the asia-pacific: climate change, phosphorus, ozone and other environmental challenges.Asia Pac J Clin Nutr2009, 18(4):590–597.
2. Peng S, Huang J, Sheehy JE, Laza RC, Visperas RM, Zhong X, Centeno GS, Khush GS, Cassman KG:Rice yields decline with higher night temperature from global warming.Proc Natl Acad Sci U S A2004,101(27):9971–9975. 3. Tao F, Yokozawa M, Xu Y, Hayashi Y, Zhang Z:Climate changes and trends
in phenology and yields of field crops in China, 1981–2000.Agr Forest Meteorol2006,138(1):82–92.
4. Auffhammer M, Ramanathan V, Vincent JR:Integrated model shows that atmospheric brown clouds and greenhouse gases have reduced rice harvests in India.Proc Natl Acad Sci U S A2006,103(52):19668–19672. 5. Cramer W:Air pollution and climate change both reduce Indian rice
harvests.Proc Natl Acad Sci U S A2006,103(52):19609–19610. 6. Luo L:Breeding for water-saving and drought-resistance rice (WDR) in
China.J Exp Bot2010,61(13):3509–3517.
7. Redman RS, Kim YO, Woodward CJ, Greer C, Espino L, Doty SL, Rodriguez RJ:Increased fitness of rice plants to abiotic stress via habitat adapted symbiosis: a strategy for mitigating impacts of climate change.PLoS One 2011,6(7):e14823.
8. Collard BCY, Vera Cruz CM, McNally KL, Virk PS, Mackill DJ:Rice molecular breeding laboratories in the genomics era: current status and future considerations.Int J Plant Genom2008. doi:10.1155/2008/524847.
9. Da Wei Huang BTS, Lempicki RA:Systematic and integrative analysis of large gene lists using DAVID bioinformatics resources.Nat Protoc2008, 4(1):44–57.
10. Sherman BT, Lempicki RA:Bioinformatics enrichment tools: paths toward the comprehensive functional analysis of large gene lists.Nucleic Acids Res2009,37(1):1–13.
doi:10.1186/1756-0500-7-15
Cite this article as:Chenet al.:Development of a microarray for two rice subspecies: characterization and validation of gene expression in
rice tissues.BMC Research Notes20147:15.
Submit your next manuscript to BioMed Central and take full advantage of:
• Convenient online submission
• Thorough peer review
• No space constraints or color figure charges
• Immediate publication on acceptance
• Inclusion in PubMed, CAS, Scopus and Google Scholar
• Research which is freely available for redistribution