TITLE
Implicit and Explicit Risk Perception, Affect, and Trust: An Investigation of Food “Traffic Lights”.
AUTHORS
Tony McCarthy (University of Strathclyde) Calvin Burns (University of Strathclyde) Matthew Revie (University of Strathclyde)
CORRESPONDING AUTHOR Tony McCarthy
Email: [email protected]
ACKNOWLEDGMENTS
This work was supported by the Economic and Social Research Council Doctoral Training Centre and the Harvard Center for Risk Analysis. The authors are grateful to Rus Fazio and colleagues for supplying us with a set of target words (affect only) for use in the experiment.
DISCLAIMER
“The findings and conclusions of this paper are those of the author(s) and do not imply endorsement by any component of Harvard University or other sponsors of this workshop. Comments should be directed to the author(s).”
TITLE
Implicit and Explicit Risk Perception, Affect, and Trust: An Investigation of Food “Traffic Lights”.
AUTHORS
Tony McCarthy (University of Strathclyde) Calvin Burns (University of Strathclyde) Matthew Revie (University of Strathclyde)
ABSTRACT
Obesity is a health problem in many developed countries and is a growing problem
worldwide. In an effort to improve food choices the “traffic lights” nutritional labelling system has been developed. This system informs consumers of the relative (low, medium,
high) levels of fat, saturated fats, sugar, and salt, along with energy information. There is debate over what type of thought processing drives perceptions of affect (or emotion) and risk regarding food products. These are System 1 (quick, intuitive) processing and System 2
(slower, deliberative) processing. In order to capture data on both types of processing, we used explicit and implicit measures (we developed an implicit measure of risk for this study).
We also investigated the relationships of risk with affect, and trust. The results showed the presence of food “traffic lights” sometimes influenced both risk and affect perceptions but
this was more pronounced for explicit measures. We also found that high risk was associated with negative affect, and low risk with positive affect, with larger effects when the “traffic lights” were present. We concluded that “traffic lights” can influence risk perception at both
explicit and implicit levels but the influence was stronger if either the risk information was clear or the person was consciously evaluating the risk. Future research was discussed.
KEY WORDS
1. INTRODUCTION
Obesity is a health problem in many developed countries and is a growing problem
worldwide (Apovian, 2010). It is generally recognized that obesity results from many factors including a genetic predisposition, unhealthy eating, and lack of exercise (Apovian, 2010).
When communicating food risks such as unhealthy eating, it is important to consider how these risks are perceived (Frewer, 2000). Previous research has drawn on the psychometric paradigm (Slovic, 1987) to investigate risk attitudes to food (e.g. Frewer, Howard, Hedderley,
& Shepherd, 1996; Hansen, Holm, Frewer, Robinson, & Sandoe, 2003). Although the psychometric paradigm has been influential in the study of risk perception, it is limited to the
use of explicit attitude measures (e.g. surveys). These measures require people to consciously consider and state their attitudes to attitude-objects (i.e. by asking people to think about a hazard and state how risky it is). Implicit attitude measures are being used increasingly in
social cognition research (for a review see De Houwer, Teige-Mocigemba, Spruyt, & Moors, 2009 and references therein). These measures can offer new insights into risk-related attitude
formation and change about eating unhealthy food. This paper develops an implicit measure of risk attitudes toward food products. Along with explicit measures, this implicit measure is used to investigate the relationship between risk and affect, with and without food “traffic light” risk information.
The food “traffic light” system is a format for the labelling of nutritional information
on food products but it can also be considered a form of food risk communication. It was developed by the Food Standards Agency (FSA) in the UK in the early 2000s largely as a response to the difficulty many consumers had with previous nutritional information formats
(Drichtoutis et al., 2006). This system has focused on five main areas of concern for food health: energy/calories, fat, saturated fats, salt, and sugar. Along with numerical details such
energy) with Green indicating low levels, Amber indicating medium levels, and Red indicating high levels of each substance based on the recommended daily intake (Department
of Health, 2013). The FSA calculated these levels based on the recommended daily intake of each nutrient while considering that they would form only part of the overall daily diet. As
such, high levels may in reality constitute less than a third of the recommended daily intake, although in some cases may be much higher. With the exception of a few eye-tracking studies (e.g. Ares et al., 2013), research on the food “traffic light” system has generally been
limited to explicit measures (e.g. surveys, interviews). Explicit measures are believed to measure only one type of thought processing.
Dual Process Theories of Thinking (e.g. Kahnemann, 2011) can be used to explain how people make risk decisions in food choices. System 1 processing consists of quick, intuitive responses that can be associated with emotion. In contrast, System 2 processing is
slower and requires deliberative, consciously controlled responses. Food choices have been considered to be governed by System 2 (deliberative) processing (Dieckmann, Dippold, &
Dietrich, 2009) but this has been called into question as nutritional information can be difficult to process (Milosavljevic & Cerf, 2008). This complexity coupled with potential time constraints when making food choices suggest that System 1 (automatic/intuitive)
processing may occur more frequently than previously thought as this type of processing is known to be favoured in situations of complexity or time limitations (Kahnemann, 2011).
While explicit measures like attitude surveys can be used to investigate System 2 processing, implicit measures are needed to investigate System 1 processing (De Houwer et al., 2009). Implicit measures assess attitudes that individuals may not be consciously aware that they hold and are less susceptible to response biases like social desirability because they are activated automatically (Greenwald & Banaji, 1995). While there are various types of
less feasibly controlled by the participant. In research that has directly compared implicit attitude measures with explicit attitude measures, they have rarely correlated (e.g. Fazio,
Jackson, Dunton, & Williams, 1995; Greenwald, McGhee, & Schwartz, 1998).
The use of implicit measures in the context of food health has generally involved the
affective priming task (APT). This task was developed by Fazio et al. (1995) and requires participants to view “priming” words or images for a very short time followed by “target”
words or images which they must then categorize as either positive or negative. The “prime”
can either facilitate (speed up) or inhibit (slow down) responding to the target word based on the automatic associations the participant has stored in memory. For instance, if one is able to classify the target word “dangerous” quicker after viewing a priming image of sugar than
when no prime is presented, then that person has a negative implicit attitude to sugar (i.e. the person has an automatic association between “dangerous” and “sugar” stored in memory).
In food health research, the APT has been successful in measuring recently induced food attitudes using images as both primes and targets (Verhulst, Hermans, Baeyens, Spruyt,
& Eelen, 2006). Food likes and dislikes have also been successfully measured using the APT (Roefs, Herman, MacLeod, Smulders, & Jansen, 2005). Attitudes for participants varying in BMI have also been investigated, and restrained eaters compared with unrestrained eaters
(Czyzewska & Graham, 2008; Papies, Stroebe, & Aarts, 2009). Implicit measures have also been used to investigate self-regulation in food choice and consumption behaviour (Friese,
Hofmann, & Wanke, 2008). Food health studies that have used an APT have generally focused on affective perception.
Some researchers have claimed that risk perception is often associated with affect or
emotion. The affect heuristic is a prominent theory in this field. It is a cognitive process in which people use their positive and negative feelings to evaluate risk (Slovic, 2010). The
negative affect and perceptions of low risk are associated with positive affect (Loewenstein, Weber, Hsee, & Welch, 2001). Our previous research on cyber-security using explicit
measures (McCarthy, Burns, & Revie, 2013a) revealed an expected correlation of negative affect with perceptions of high risk, and positive affect with perceptions of low risk. From
our work, it appears though that the risk-affect relationship is stronger for high risk / negative affect attitude-objects than for low risk / positive affect attitude-objects. Some researchers (e.g. Finucane, Alhakami, Slovic, & Johnson, 2000) have suggested that affect plays a more
important role in implicit attitudes (System 1) than explicit attitudes (System 2).
When considering the affective component of risk perception it is relevant to consider the issue of trust in the risk information source. In the context of “traffic lights”, the risk
information is communicated via various agencies, such as supermarkets or the FSA. It is relevant, therefore, to investigate how trust (along with risk and affect) in these agencies may
vary. Trust has long been known to influence risk acceptance. When people lack personal knowledge about a hazard, trust is an important predictor of risk estimates and risk
acceptance. Based on research from technological / societal risks like nuclear power, when trust in an information source is low, the associated risk is considered to be high but when trust in an information source is high, the associated risk is considered to be low (Siegrist &
Cvetkovich, 2000). Models of organisational trust (e.g. Mayer, Davis, & Schoorman, 1995) suggest that affect (through perceptions of benevolence) is an important determinant of
perceived trustworthiness.
2. AIMS AND OBJECTIVES
The purpose of this paper is threefold. First, we developed an implicit measure of risk attitudes toward food products and used it along with explicit measures to investigate risk
we anticipated that there would not be any relationship between explicit and implicit risk attitude measures of food risk.
We used explicit and implicit measures to investigate the relationship between risk and affect, with and without food “traffic light” risk information. We anticipated that the
presence of “traffic light” information would increase the salience of the food risk and thus
strengthen the risk-affect relationship for both explicit and implicit measures.
Finally, based on explicit measures (survey data), we investigated the relationships
between risk, affect, and trust in order to gauge how likely it is that trust in the risk information source will influence subsequent behaviour. We anticipated a positive
relationship between trust and affect for supermarket brands or other relevant food agencies. Consistent with the technological / societal risks literature, we expected an inverse relationship between risk and trust, and risk and affect for supermarket brands and other food
agencies.
The remainder of the paper is structured as follows. The data collection method is
discussed in Section 3. The data and analyses are presented in Section 4. These results are discussed in Section 5 and the limitations of the study are highlighted in Section 6. Section 7 concludes the paper by summarising the work and proposing future areas of research.
3. METHODS
This study consisted of two parts: a questionnaire and priming tasks. The questionnaire measured participants’ explicit risk and affect towards food products. The
priming tasks measured participants’ implicit risk and affect towards the same food products.
Participants were randomly allocated to one of two conditions, which involved viewing the images with or without “traffic lights.” In the “without traffic lights” group, the order of
priming task first as those who completed the affect priming task first. This group was also counterbalanced so that half of the participants completed the priming tasks first, and half the survey first. The “with traffic lights” group was similarly counterbalanced although all
completed the priming task first because completing the survey first would have provided key
information on the “traffic lights” which could have resulted in confounds. No effects based on the order of sections were found. Following the completion of all sections, participants were fully debriefed and a short interview was conducted to ascertain if they had any issues,
or for general comments.
3.1 PARTICIPANTS
Participants were undergraduate students at a UK university taking a Work and Organisational Psychology class and received course credits for their participation. They
were randomly allocated to one of two conditions: “images with traffic lights” and “images without traffic lights”, with 23 participants in each condition. In the “with traffic lights”
condition, there were five males and 18 females, with mean age of 19.65 years ranging from 18 to 22 years (SD = 1.37). The “without traffic lights” condition included eight males and 15 females, with mean age 20.17 years ranging from 18 to 24 years (SD = 1.47). We specifically
sampled 18 to 24 year olds as they are used to seeing “traffic lights” and given their youth, were a more relevant population looking forward in time.
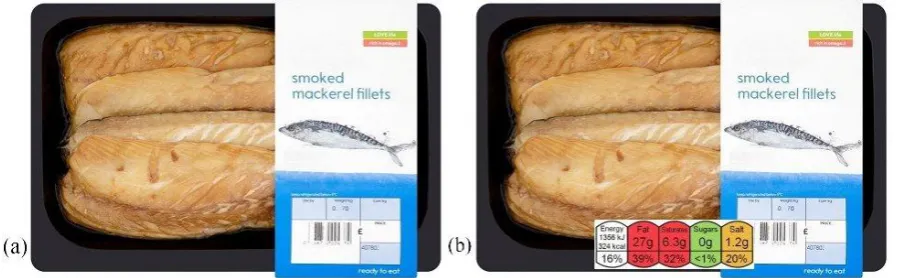
3.2 STIMULUS MATERIALS – FOOD PRODUCTS & “TRAFFIC LIGHTS”
We generated a large set of food products based on criteria intended to provide a wide
range of food types and variety of nutrient levels. These were used in a pilot survey and from this, a set of five food products were selected for use in this study: Mackerel, Crumpets, Ice
around 18cm in diameter and 0.8 cm thick. The US equivalent of an Ice Lolly is a popsicle). The rationale was to have two products that were likely to be considered low risk (or
healthy), e.g. Mackerel and Cod, two products that were likely to be considered high risk, e.g. Spaghetti Carbonara and Crumpets, and one neutral option, e.g. Ice Lolly. Among these, one
high risk product had “traffic lights” that contained mostly green lights (Crumpets), and one contained multiple red lights (Spaghetti Carbonara). There was also one low risk product that contained mostly green lights (Cod), with one containing multiple red lights (Mackerel). This
meant that we could investigate the impact of “traffic lights” that potentially may be somewhat in line with expectation and also products where the nutrient details may be
somewhat different from expectations. It also meant we had a mixture of “traffic light” combinations, including all green lights, mostly green lights with no red lights, one red light only, two red lights, and three red lights.
The products selected were all ‘own brand’ products from the UK supermarket
Waitrose. The reasons for choosing this product range were that nutrient details were
available and the packaging was consistent across products. Waitrose is also considered a ‘high end’ or more expensive supermarket (“Food and grocery prices”, 2013) so given that
our sample included young students it seemed likely that few of the participants would
recognize the packaging. Any details on the packaging, such as the Waitrose logo and already present “traffic lights” were removed using the image software package Photo Pos Pro. This
ensured that prior opinions of the store would not influence behaviour and enabled us to add our own standardized “traffic lights”.
The UK Department of Health, in conjunction with the FSA, the UK devolved
the “with traffic lights” condition) were in the same format and resolution. The “traffic
lights” were then added to the images of the food products, ensuring that they were all equal
in size. See Figure 1 for examples of the images in each condition.
3.3 SURVEY
The survey measured risk perception and affect. Participants were required to make explicit ratings of the food product images which were presented via an online survey. The
risk items asked participants to rate the images based on how they would most accurately categorize the images on a 6-point scale (Very Low Risk, Moderately Low Risk, Somewhat
Low Risk, Somewhat High Risk, Moderately High Risk, Very High Risk). The affect items were identical but with different rating choices (Very Positive, Moderately Positive, Somewhat Positive, Somewhat Negative, Moderately Negative, Very Negative). The survey
included some other ratings and details, such as Risk, Affect, and Trust ratings of various supermarkets, and the participant’s shopping habits. Other details, such as any foods
participants do not eat, and their native languages were also collected.
[image:10.595.71.523.514.653.2]The survey was completed in a private room during the same session as the priming tasks. Participants were given as much time as they required to complete the survey but on
average they took 10 minutes. The survey was completed using the online survey website Qualtrics. All instructions were given on screen but the experimenter reminded participants
that they could take as long as they needed to complete the survey.
3.4 PRIMING TASK
We developed two different priming tasks for this study. They were both variants of Fazio et al.’s (1995) Bona Fide Pipeline. The first task measured implicit affect toward the food products, largely as per Fazio et al.’s (1995) method. The second task measured implicit risk attitudes toward the food products. This implicit risk task was developed from earlier pilot work (Burns, 2012).
In each version of the task, participants were briefly shown a prime (food product image) and then had to categorize a subsequently displayed target word. The target words
were a selection of words which consistently suggested one of two rating extremes (e.g. High Risk or Low Risk). The affect target words were selected from options provided by Fazio’s lab. The risk target words were developed from a previous study survey which identified
highly familiar words which were consistently rated as either associated with high risk or low risk (McCarthy, Burns, & Revie, 2013b). There were five High Risk target words (e.g.
dangerous, hazardous), five Low Risk target words (e.g. harmless, trusted), five Positive Affect target words (e.g. pleasant, wonderful), and five Negative Affect target words (e.g. horrible, disturbing). The number of primes and target words were limited in order to avoid
participants becoming fatigued during the tasks.
Each priming task involved three phases: a baseline phase, a priming phase, and a
target words. Here, participants simply had to classify a target word as either high / low risk or good / bad (depending on which version of the task they were completing). The second
phase was the actual priming. In each trial, a food product image was flashed on screen followed by a target word. The participants had to pay attention to the image but judge the
meaning of the target word. The last phase consisted of a recognition memory test and was included to check whether participants had followed instructions to pay attention to the primes in the priming phase.
Following the procedure used by Fazio et al. (1995), each food product image was displayed in the centre of the screen for 315 ms then the screen was blank for 135 ms,
followed by the target word which the participant had to categorize. This meant the stimulus onset asynchrony (SOA) was 450 ms. There have been suggestions that SOAs are optimal at lower intervals than this (Wentura & Degner, 2010) but given the amount of information in the images (picture of food, name of food in text, and “traffic lights”) it was deemed
appropriate to maintain this longer SOA. The baseline condition was identical to the priming
condition but with a row of asterisks instead of the image prime. Each baseline RT was calculated based on two trials. The baseline phase was conducted after some practice trials.
3.5 EQUIPMENT
The priming task and survey were conducted on a Dell PC computer with a 21.5 inch
screen. The priming task was designed and administered via Super Lab version 4.5. The images were shown on the centre of the screen and the dimensions were ~300 pixels by ~500 pixels, at 300 dpi, varying based on differing basic shapes. The target words were also shown
on the centre of the screen in Times New Roman 45-point font. Participants used a Model RB-530 response box which included buttons labelled Yes and No, along with either High
4. RESULTS
This study had three objectives. The first objective was to develop an implicit measure of risk and provide a preliminary validation of that measure by investigating its
relationship with explicit measures of risk. This is considered in section 4.2. The second objective was to investigate the relationship between risk and affect using both explicit and implicit measures, with and without “traffic lights”. These data and analyses are presented in
sections 4.3 and 4.4. The final objective was to investigate the relationship between trust and risk, and trust and affect. This is considered in section 4.5.
4.1. PRELIMINARY ANALYSES
No significant or problematic differences were found between the survey ratings or
scores from the priming tasks and gender, nor the ratings/scores with task order. The same was true for associations with native language (i.e. native language was English or not), and
food preferences (e.g. vegetarians and non-vegetarians). No associations were found between the ratings / scores and age.
4.2. EXPLICIT AND IMPLICIT MEASURES ASSOCIATIONS
In order to investigate the relationships of the explicit measures (survey) and implicit
measures (priming task), correlation analyses were conducted for each category (Risk and Affect) separately. Table I contains the results of these analyses. As expected, no associations were found for any of the combinations. These data suggest that the implicit risk and affect
Table I: Spearman correlation results when comparing explicit results (survey) and implicit results (priming task) for combinations of risk or affect when images were shown with “traffic light” nutrition information or without.
Rating type Rho p-value N
Images with Traffic Lights
Risk .115 .221 115
Affect -.030 .753 115
Images without Traffic Lights
Risk .135 .152 114
Affect .067 .475 115
4.3. DIFFERENCES BASED ON “TRAFFIC LIGHT” INFORMATION
4.3.1. SURVEY DATA (“TRAFFIC LIGHTS”)
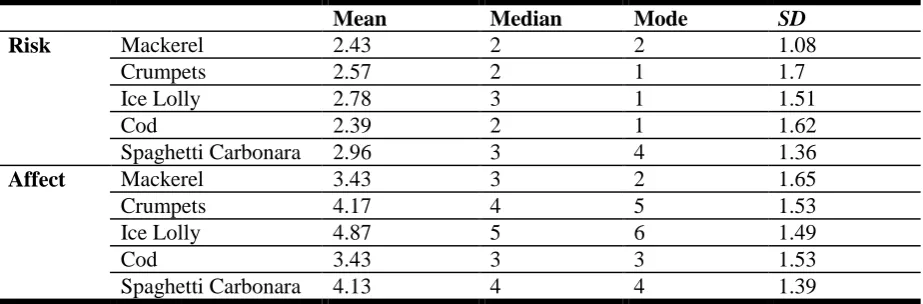
An initial analysis of the data was carried out by gathering descriptive statistics of the
[image:14.595.65.527.121.196.2]data. See Table II for the means, medians, modes and SDs for the survey results in the “without traffic lights” condition, and Table III for the “with traffic lights” condition.
Table II: Means, medians, modes, and standard deviations (SD) for the risk and affect survey ratings when subjects viewed food product images without traffic light nutrition information.
Mean Median Mode SD
Risk Mackerel 2.43 2 2 1.08
Crumpets 2.57 2 1 1.7
Ice Lolly 2.78 3 1 1.51
Cod 2.39 2 1 1.62
Spaghetti Carbonara 2.96 3 4 1.36
Affect Mackerel 3.43 3 2 1.65
Crumpets 4.17 4 5 1.53
Ice Lolly 4.87 5 6 1.49
Cod 3.43 3 3 1.53
Spaghetti Carbonara 4.13 4 4 1.39
[image:14.595.68.530.509.661.2]Table III: Means, medians, modes, and standard deviations (SD) for the risk and affect survey ratings when subjects viewed food product images with traffic light nutrition information.
Mean Median Mode SD
Risk Mackerel 3.7 4 5 1.55
Crumpets 2.74 2 2 1.45
Ice Lolly 3.57 3 6 1.85
Cod 1.3 1 1 0.76
Spaghetti Carbonara 5.22 6 6 1.24
Affect Mackerel 3.3 3 2 1.22
Crumpets 4.48 5 6 1.34
Ice Lolly 4.13 5 6 1.87
Cod 5.22 6 6 1.2
Spaghetti Carbonara 2.26 1 1 1.86
(Range 1-6)
An interesting result emerged from Tables II and III. We see that there appears to be a
difference between the risk scores for Mackerel, Cod and Spaghetti Carbonara when we add the “traffic light” information. Specifically, for both Mackerel and Spaghetti Carbonara, we
see that the risk score rises when the information is added. Conversely, the risk score for Cod reduces when the risk score information is added. This is in line with what was anticipated. There seems to be little difference between the risk scores for Crumpet and Ice Lolly.
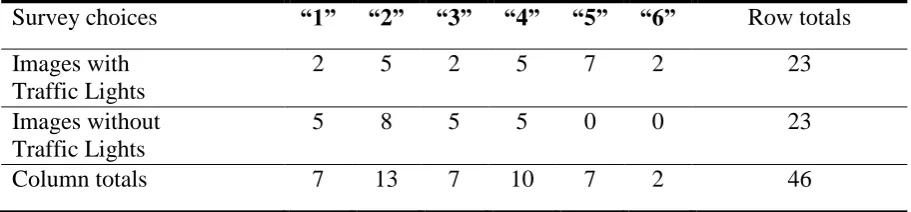
Table IV shows the contingency table of Risk judgement counts for one of the food products: Mackerel. As there were six discrete variables for the survey judgement choices,
the Chi-Square statistic may have been used but the expected values in each cell was <5 for more cells than would be deemed acceptable. It was therefore more appropriate to use the Fisher’s Exact Test. In order to investigate any differences between the conditions (with or without “traffic lights”) in the survey data, Fisher’s Exact Tests were therefore conducted.
Table IV: Contingency table of counts for the survey Risk judgements (from 1-6) for Mackerel.
Survey choices “1” “2” “3” “4” “5” “6” Row totals Images with
Traffic Lights
2 5 2 5 7 2 23
Images without Traffic Lights
5 8 5 5 0 0 23
Column totals 7 13 7 10 7 2 46
Survey choice “1” denoted a judgement of Very Low Risk, and “6” denoted Very High Risk. See Section 3.3 for details.
Using the same procedure (no contingency tables reported) Spaghetti Carbonara was also rated as higher Risk in the “with traffic lights” condition (p < .001), Cod (p = .055)
tended towards being rated as lower risk with traffic lights.It was also rated as more Positive in the “with traffic lights” condition (p = .002), while Spaghetti Carbonara was rated more
Negative in this condition (p < .001). None of the other comparisons were significant (p = .27 to .851). These data suggest that traffic lights have some impact on explicit perceptions of risk and affect.
4.3.2. PRIMING TASK DATA (“TRAFFIC LIGHTS”)
Facilitation scores were calculated following the procedure described by Fazio et al. (1995). The response time (RT) for each priming condition (i.e. where a food product was
shown) was subtracted from the baseline (no prime shown) condition for each target word. The median RTs within each group of target words (e.g. the High Risk target words) were
[image:16.595.66.522.101.207.2]attitude index (Czyzewska & Graham, 2008), which was one overall average indicating the general trend in the responses. For Risk, a higher index score indicated more automatic risk
activation for that food product. A similar process was carried out for the Affect data, with a higher overall index score indicating more automatic positive affect activation. Table V
reports the means and standard deviations (SDs) for the scores from the priming task in the “with traffic lights” condition, and Table VI reports the priming task scores for the “without
traffic lights” condition. From these averages, Mackerel appeared to score higher for Risk
when the “traffic lights” are present. To a lesser extent, a similar trend was shown for Spaghetti Carbonara and Ice Lolly. The Affect scores did not appear to differ much across “traffic light” conditions, with Mackerel and Spaghetti Carbonara showing some change
(more negative when lights are present).
In order to investigate any differences between the conditions (with or without “traffic lights”) in the priming task data, independent-samples t-tests were conducted. The only
significant difference was the risk comparison for Mackerel, with the product rated as higher risk in the “with traffic lights” condition, t(42) = 2.24, p = .03, 95% CI of diff = (11.4, 220.4).
No other comparisons were significant (p = .11 to .788).
In response to the objectives, it appears that the presence of “traffic lights” can
Table V: Means and standard deviations (SD) for the risk and affect facilitation scores (in the priming tasks) when subjects viewed food product images with traffic light nutrition information.
Mean (ms) SD N
Risk Mackerel 73.1 145.74 23
Crumpets 89.41 220.53 23
Ice Lolly 96.15 195.52 23
Cod 82.58 156.06 23
Spaghetti Carbonara 113.76 169.91 23
Affect Mackerel -6.93 175.11 23
Crumpets -9.32 129.82 23
Ice Lolly -9.87 139.22 23
Cod -22.3 112.09 23
Spaghetti Carbonara 4.51 132.92 23
Higher Risk averages denote higher risk facilitation scores, and higher Affect scores denote more positive facilitation scores.
Table VI: Means and standard deviations (SD) for the risk and affect facilitation scores (in the priming tasks) when subjects viewed food product images without traffic light nutrition information.
Mean (ms) SD N
Risk Mackerel -42.82 201.39 23
Crumpets 73.11 181.6 22
Ice Lolly 39.71 178.09 23
Cod 54.73 221.86 23
Spaghetti Carbonara 40.45 210.7 23
Affect Mackerel -76.7 135.22 23
Crumpets -37.07 75.51 23
Ice Lolly -26.18 106.91 23
Cod -33.42 145.11 23
Spaghetti Carbonara -61.04 136.8 23
Higher Risk averages denote higher risk facilitation scores, and higher Affect scores denote more positive facilitation scores.
4.4. RISK AND AFFECT RELATIONSHIP
4.4.1. SURVEY DATA (RISK AND AFFECT)
[image:18.595.66.530.402.567.2]Table VII, and indicate a moderate to strong relationship for the “with traffic lights” condition and a weaker but also significant relationship for the “without traffic lights”
[image:19.595.66.531.220.294.2]condition. The data from all food products were combined in order to calculate an overall correlation coefficient for each condition.
Table VII: Spearman correlation results when comparing risk and affect ratings in survey.
Rho p-value N
Images with Traffic Lights
-.596 <.001 115
Images without Traffic Lights
-.275 .003 115
4.4.2. PRIMING TASK DATA (RISK AND AFFECT)
Pearson correlation analyses were conducted on the priming task data to investigate any associations between Risk and Affect for each condition. These results are shown in Table VIII, and indicate a significant relationship for the “with traffic lights” condition but no relationship for the “without traffic lights” condition.
In response to the objectives, the expected associations of high risk with negative
[image:19.595.65.529.653.727.2]affect, and low risk with positive affect were found for explicit measures. The strength of this was higher when “traffic lights” were present, and was evident for implicit measures in this “with traffic lights” condition only.
Table VIII: Pearson correlation results when comparing risk and affect facilitation scores in the priming tasks.
Rho p-value N
Images with Traffic Lights
-.257 .006 115
Images without Traffic Lights
4.5. TRUST RATINGS (SURVEY)
The survey included additional ratings of several supermarket brands prevalent in the
UK and other associated organisations (Asda, Tesco, Sainsbury’s, Morrison’s, Waitrose, Supermarkets in general, Food manufacturers, the FSA, The UK government, and the EU).
These ratings included Risk, Affect, and Trust. There were strong positive associations between Affect and Trust (i.e. more Positive affect associated with higher Trust) for several comparisons. For instance, the association for the supermarket Sainsbury’s was significant,
r(44) = .59, p < .001. There were also several strong negative associations between both Affect and Trust with Risk (i.e. more Positive or higher Trust with lower Risk). For Sainsbury’s, this was evident for both Risk and Affect, r(44) = -.56, p < .001, and Risk and Trust, r(44) = -.42, p = .004.
Additionally, there were some occasions when these ratings were related to how often
the participants shopped in the particular supermarkets (shopping habits were also measured in the survey). For instance, if they shopped more often in the supermarket Asda, they tended
to rate it as lower Risk, r(43) = -.32, p = .033, more Positive, r(43) = .35, p = .02., and more Trustworthy, r(43) = .34, p = .024. For Sainsbury’s, the associations were found for Affect, r(44) = .5, p < .001, and Trust, r(44) = .56, p < .001, although not for Risk, r(44) = -.18, p = .223.
5. DISCUSSION
5.1. EXPLICIT AND IMPLICIT MEASURES
Explicit measures and implicit measures have often lacked correlations in several previous studies (e.g. Fazio, Jackson, Dunton, & Williams, 1995; Greenwald, McGhee, &
for measures of both risk and affect, within the two main experimental conditions (with or without food “traffic lights”). As such, this suggests that the processing that is guiding
attitudes differs in each measurement condition. Future studies of food risk should include implicit measures.
5.2 THE FOOD “TRAFFIC LIGHT” SYSTEM
The food “traffic light” system provides nutritional information for energy, fat,
saturated fats, salt, and sugar. This includes a colour coding system based on relative levels of the recommended daily intake (Green for low levels, Amber for medium levels, and Red for
high levels). Research has often shown positive results regarding the effectiveness of the system, especially in comparison with other nutrition labelling formats. Eye tracking measures have shown that standard nutrition formats are often difficult to understand and
result in a lack of focus on the relevant details (Jones & Richardson, 2007). These issues were greatly reduced for the “traffic light” system, and it also enabled more accurate healthiness judgements. Other studies have also suggested that the “traffic light” system enables better
healthiness judgements of foods compared with other formats (Borgmeier & Westenhoefer, 2009). This last study, however, also suggests that this is unlikely to lead to actual changes in
food choices.
The use of these explicit measures (such as surveys) is sufficient if food choice
behaviour is considered to be normally governed by System 2 processing (Dieckmann, Dippold, & Dietrich, 2009), meaning that decision making is guided by consciously controlled and considered thinking. It is not clear how often this is the case, however, and
there have been suggestions that System 1, or intuitive, quick processing may very often drive choices (Milosavljevic & Cerf, 2008). It is also reasonable to presume that many
processing will often be favoured (Kahnemann, 2011). In order to investigate System 1 processing, it is necessary to use implicit measures. As such, this study aimed to investigate the food “traffic light” system using both explicit and implicit measures.
For the explicit measures (survey data) there were differences found based on the presence or absence of the food “traffic lights”. Both Mackerel and Spaghetti Carbonara showed higher ratings of risk perception when the “traffic lights” were present compared
with when they were absent. In the design of the study the food products were selected based on various characteristics. Among these was whether the “traffic lights” were likely to meet
expectations. Both Mackerel and Spaghetti Carbonara contained multiple red lights (denoting
high levels) but we believed that this would be contrary to expectations for Mackerel only. The fact that both showed an effect may suggest that the presence of red lights (at least multiple red lights) may be sufficient to influence (explicit) risk perception. Previous studies
have suggested that people do tend to focus mainly on red lights when considering “traffic light” information (e.g. Balcombe, Fraser, & Di Falco, 2010; Hieke & Wilczynski, 2012).
The survey results also revealed that Cod was tending towards a difference, with the risk perception ratings tending towards lower risk when the “traffic lights” were present. This can be explained based on similar characteristics as above since Cod contained all green
lights (low levels). We did not believe this was contrary to expectations but possibly containing all green lights was nonetheless sufficient to produce the effect. Crumpets also had
all green lights yet did not show an effect which is possibly due to the participants (based on short interviews conducted after the experiment) being more aware of the likely nutrient levels in Crumpets than we expected. Ice Lolly also showed no effect but this was expected
demonstrated that affect can also be impacted by the “traffic lights” but in a less consistent
manner.
For the implicit measures (priming tasks), the only difference that was found was for Mackerel risk perception results. Specifically, Mackerel showed automatically activated attitude associations with higher risk when the “traffic lights” were present compared with
when they were absent. As with the survey data results, part of the reason may be the presence of multiple red lights. Since, however, the priming task results did not show the
same effect for Spaghetti Carbonara, it may be that the potentially unexpected presence of the red lights (as perceived by the participants) may have added to the effect. It is not clear if this may be due to the “implicit” effect simply being smaller, or if this is due to the sensitivity of
the implicit measure. Future research may be able to investigate this uncertainty. Another possibility is that Mackerel may be differentially evaluated in comparison with Spaghetti
Carbonara since it is a component of a meal rather than a full meal. Overall, it does seem that automatically activated risk perceptions can be produced when using the food “traffic light”
system.
It is clear, however, that any influence of the “traffic lights” on risk perception is
greater when judgements are made explicitly. This suggests that in a situation where someone is consciously thinking about the concept of risk, the risk information contained in the “traffic lights” may be more salient. A study in a Boston hospital claimed that a variant of the “traffic
light” system did influence shoppers to make healthier choices but only when they were
consciously made aware of the health issues (Sonnenberg et al., 2013). The fact that there were no affect perception differences for the priming task results may bring in to question
5.3. AFFECT HEURISTIC
The correlation analyses of the survey data produced the expected associations of risk
and affect (e.g. higher risk associated with negative affect) for both the “with traffic lights” and “without traffic lights” conditions. The effect size was notably larger, however, in the
“with traffic lights” condition. This suggests that the food products in isolation may not as
readily produce affect heuristic type effects. Indeed, it may be that any risk judgements of typical supermarket food products may be based on other factors or even largely ignored.
Alternatively, the affective response may be driven by other factors rather than risk, such as taste preferences (Grunert & Wills, 2007), or pricing (Waterlander, Steenhuis, de Boer,
Schuit, & Seidell, 2012).
The correlation results from the priming task seem to somewhat support these interpretations of the survey data results. There was an association found between risk and affect for the “with traffic lights” condition only. It would seem then that there is a lack of
affect heuristic effect (or sufficiently small to avoid detection using the measure) when
simply exposed to food products. The “traffic light” information, especially involving the warning signal of red, seems to be more salient for this type of processing. It is not clear how these potentially differing processes may combine when the food products are shown with “traffic lights” but the fact that the effect size was notably smaller than the equivalent explicit measure (i.e. survey correlations for the “with traffic lights” group) may suggest that there is
some competition between the two types of processing.
5.4. TRUST
It is important to recognize that the risk information provided in the “traffic lights” is
received by the shopper via intermediaries. Specifically, their attitude towards the
may influence how they then perceive the “traffic light” information. As expected, the
explicit perceptions (via survey only) of trust and affect were positively associated. It was
also found that risk was negatively associated with both trust and affect. Specifically, higher risk was associated with both more negative affect and less trust. As such, the salience of the “traffic light” effect may be mediated, or possibly destroyed, if a shopper has low trust in the
organizations involved. Alternatively, if they have high trust in, for instance, the supermarket brand this may enhance the salience.
The results also showed that trust was increased, affect was more positive, and risk lower (in a specific supermarket) if the participant frequently shopped in that particular
supermarket. This further emphasizes that the overall context, and trust in information sources, could influence the effectiveness of the risk information (i.e. “traffic lights”).
6. IMPLICATIONS
The use of food “traffic lights” has received support from research from many
different countries (e.g. Méjean, Macouillard, Péneau, Hercberg, & Castetbon, 2013; Kelly et al., 2009). Despite the support, however, lobby groups for the food producers have successfully prevented the “traffic light” system from being made compulsory in the UK
(Smyth, 2013) as well as other countries, such as Australia and New Zealand (Swinburn & Wood, 2013). While disappointing for supporters of the system, there have been doubts cast
on the likely influence of the “traffic light” system in real world situations. Data based on actual sales from a store (albeit with a limited product selection) suggested that there was no relationship between healthiness of choices and the “traffic light” details (Sacks, Rayner, &
Swinburn, 2009). It has also been shown that while a high proportion of UK shoppers appeared to understand the information in the “traffic light” system (87.5%), a much smaller
It is beyond the scope of this paper to clarify how likely perception of any type may influence behaviour but future research may be able to investigate this.
It would seem that people are more likely to be influenced if consciously thinking about the issues and focussing on the lights somewhat. Making the system, risk issues, and
reminding shoppers before they shop may all help. The Mackerel example also shows that the lights may sometimes be misinforming as the red lights do not specify “good fats” or other nutrients such as vitamins. Also a red light may not be of great concern and can vary
enormously (e.g. 30% or 80% recommended daily intake would normally both be red). As such, the simplicity of the system while effective can sometimes mean shoppers may make
poor judgements. It also seems that the affect heuristic plays a part in this which makes sense as red is a warning sign.
7. LIMITATIONS / FUTURE
We decided to use a sample of 18-24 year olds as these were a group who were used to seeing “traffic lights” and given their youth, were a more relevant population looking forward in time. There is evidence that adolescents can be influenced by the “traffic light”
system in comparison to other nutritional formats, including making healthier food
judgements (Babio et al., 2013). While useful in providing data regarding this specific population, it is clearly relevant to consider older people in society, especially parents. Future
research should aim to widen the variety of participants in order to provide a fuller picture of how the “traffic lights” are perceived.
The risk priming task was a newly developed method for this study. Inevitably there are potential refinements that could be made in the future. The “target words” could be
varied, the SOA times varied, the number of trials changed, and several other variations may
attitude-objects. Food products may not as readily be associated with risk as some other products or concepts. Therefore seeing the method used in other contexts is likely to be
valuable.
The choice of food products may also be an area that could be changed in future
research. The selection was rather limited so certainly a larger selection would produce more informative data. It is also worth considering how variable perception will be based on whether the food product is a full meal, component of a meal, snack, a treat, or other
variations. The participants’ knowledge of nutrition may also be important but this would require some form of test as it would not be certain that self-reported expertise would be
accurate.
Arguably the most important question is whether perception effects will lead to behavioural change. As mentioned previously, there are doubts over how likely it is that shoppers will change their food choices based on the “traffic lights”. If it were possible to
fully combine the implicit measures with a behavioural correlate, this would provide a more
convincing argument regarding the likely influence of the “traffic lights” on food choices. The work that has been conducted in this area is valuable but since many (possibly most) shoppers will not be paying much attention to the “traffic lights”, a link between implicit, automatic processing and behaviour is needed to know how useful the “traffic light” system
is likely to be.
REFERENCES
Apovian, C. M. (2010). The causes, prevalence, and treatment of obesity revisited in 2009: what have we learned so far? The American journal of clinical nutrition, 91(1), 277S-279S. doi:10.3945/ajcn.2009.28473A
Babio, N., Vicent, P., López, L., Benito, A., Basulto, J., & Salas-Salvadó, J. (2013).
Balcombe, K., Fraser, I., & Di Falco, S. (2010). Traffic lights and food choice: A choice experiment examining the relationship between nutritional food labels and price. Food Policy, 35(3), 211-220. Retrieved from http://dx.doi.org/10.1016/j.foodpol.2009.12.005 Borgmeier, I., & Westenhoefer, J. (2009). Impact of different food label formats on
healthiness evaluation and food choice of consumers: a randomized-controlled study. BMC public health, 9, 184.
Burns, C. (2012). Implicit and explicit risk perceptions in construction workers, Paper
presented at Occupational Risk Symposium at the European Academy of Occupational Health Psychology, Zurich, April 2012.
Czyzewska, M., & Graham, R. (2008). Implicit and explicit attitudes to high- and low-calorie food in females with different BMI status. Eating behaviors, 9(3), 303-312.
doi:10.1016/j.eatbeh.2007.10.008
Department of Health. (2013). Guide to creating a front of pack (FoP) nutrition label for pre-packed products sold through retail outlets. Accessed 9th June 2013 from
https://www.gov.uk/government/uploads/system/uploads/attachment_data/file/207588/F INAL_VERSION_OF_THE_2013_FOP_GUIDANCE_-_WEB.pdf
De Houwer, J., Teige-Mocigemba, S., Spruyt, A., & Moors, A. (2009). Implicit measures: A normative analysis and review. Psychological bulletin, 135(3), 347-368.
doi:10.1037/a0014211
Dieckmann, A., & Dietrich, H. (2009). Compensatory versus noncompensatory models for predicting consumer preferences. Judgment and Decision Making, 4(3), 200-213. Citeseer. Retrieved from http://ideas.repec.org/a/jdm/journl/v4y2009i3p200-213.html Drichoutis, A C, Drichoutis, A. C., Lazaridis, P., Lazaridis, P., Nayga, R. M., & Nayga, R. (2006). Consumers’ use of nutritional labels: a review of research studies and issues. Academy of Marketing Science Review, 9(9), 1–22. Retrieved from
http://works.bepress.com/cgi/viewcontent.cgi?article=1004&context=andreas_drich outis
Fazio, R H, Jackson, J. R., Dunton, B. C., & Williams, C. J. (1995). Variability in automatic activation as an unobtrusive measure of racial attitudes: a bona fide pipeline? Journal of Personality and Social Psychology, 69(6), 1013-1027. Retrieved from
http://www.ncbi.nlm.nih.gov/pubmed/8531054
Fazio, Russell H, & Olson, M. A. (2003). Implicit Measures in Social Cognition Research. Annual Review of Psychology, 54, 237-297.
doi:10.1146/annurev.psych.54.101601.145225
Finucane, M. L., Alhakami, A., Slovic, P., & Johnson, S. M. (2000). The affect heuristic in judgments of risks and benefits. Journal of Behavioral Decision Making, 13(1), 1-17. John Wiley & Sons.
doi:10.1002/(SICI)1099-0771(200001/03)13:1<1::AID-BDM333>3.0.CO;2-S
Food and grocery prices: what you need to know. Supermarket prices compared. (2013). Retrieved June 9th, 2013, from
http://www.which.co.uk/home-and- garden/leisure/guides/food-and-grocery-prices-what-you-need-to-know/supermarket-prices-compared/
Frewer, L. (2000). Risk perception and risk communication about food safety issues. Nutrition Bulletin, 25(1), 31-33. doi:10.1046/j.1467-3010.2000.00015.x
Frewer, L. J., Howard, C., Hedderley, D., & Shepherd, R. (1996). What determines trust in information about food-related risks? Underlying psychological constructs. Risk Analysis, 16(4), 473-486. doi:10.1111/j.1539-6924.1996.tb01094.x
and consumption behaviour. The British journal of social psychology, 47(Pt 3), 397-419. doi:10.1348/014466607X241540
Greenwald, A. G., McGhee, D. E., & Schwartz, J. L. (1998). Measuring individual
differences in implicit cognition: the implicit association test. Journal of Personality and Social Psychology, 74(6), 1464-1480. Retrieved from
http://www.ncbi.nlm.nih.gov/pubmed/9654756
Grunert, K. G., & Wills, J. M. (2007). A review of European research on consumer response to nutrition information on food labels. Journal of Public Health. doi:10.1007/s10389-007-0101-9
Grunert, K. G., Wills, J. M., & Fernández-Celemín, L. (2010). Nutrition knowledge, and use and understanding of nutrition information on food labels among consumers in the UK. Appetite, 55(2), 177-189.
Hansen, J., Holm, L., Frewer, L., Robinson, P., & Sandøe, P. (2003). Beyond the knowledge deficit: recent research into lay and expert attitudes to food risks. Appetite, 41(2), 111-121. doi:10.1016/S0195-6663(03)00079-5
Hieke, S., & Wilczynski, P. (2012). Colour Me In – an empirical study on consumer responses to the traffic light signposting system in nutrition labelling. Public Health Nutrition. doi:10.1017/S1368980011002874
Jones, G., & Richardson, M. (2007). An objective examination of consumer perception of nutrition information based on healthiness ratings and eye movements. Public health nutrition, 10(3), 238-244. doi:10.1017/S1368980007258513
Kahneman, D. (2011). Thinking, Fast and Slow. New York: Farar, Straus and Giroux. Kelly, B., Hughes, C., Chapman, K., Louie, J. C.-Y., Dixon, H., Crawford, J., King, L., et al.
(2009). Consumer testing of the acceptability and effectiveness of front-of-pack food labelling systems for the Australian grocery market. Health promotion international, 24(2), 120-129. doi:10.1093/heapro/dap012
Loewenstein, G. F., Weber, E. U., Hsee, C. K., & Welch, N. (2001). Risk as feelings. Psychological Bulletin, 127(2), 267-286. Retrieved from
http://doi.apa.org/getdoi.cfm?doi=10.1037/0033-2909.127.2.267
Mayer, R. C., Davis, J. H., & Schoorman, F. D. (1995). An Integrative Model of Organizational Trust. Academy of Management Review, 20(3), 709-734. doi:10.2307/258792
McCarthy, T., Burns, C., & Revie, M. (2013a). Risk perception, trust and affective judgement: Cyber-security. CIP Exchange, Fall edition.
McCarthy, T., Burns, C., & Revie, M. (2013b). Affective judgements and risk perception in experts and laypeople. Paper presented at the 60th British Psychological Society’s Social Psychology Section Conference, Exeter, September 2013.
Méjean, C., Macouillard, P., Péneau, S., Hercberg, S., & Castetbon, K. (2013). Perception of front-of-pack labels according to social characteristics, nutritional knowledge and food purchasing habits. Public Health Nutrition. doi:10.1017/S1368980012003515
Milosavljevic, M., & Cerf, M. (2008). First attention then intention: insights from
computational neuroscience of vision. International Journal of Advertising, 27(3), 381. doi:10.2501/S0265048708080037
Papies, E. K., Stroebe, W., & Aarts, H. (2009). Who likes it more? Restrained eaters’ implicit attitudes towards food. Appetite, 53(3), 279-287. doi:10.1016/j.appet.2009.07.001 Roefs, A., Herman, C. P., Macleod, C. M., Smulders, F. T. Y., & Jansen, A. (2005). At first
Sacks, G., Rayner, M., & Swinburn, B. (2009). Impact of front-of-pack “traffic-light” nutrition labelling on consumer food purchases in the UK. Health promotion international, 24(4), 344-352. doi:10.1093/heapro/dap032
Siegrist, M., & Cvetkovich, G. (2000). Perception of hazards: The role of social trust and knowledge. Risk Analysis, 20, 713-719.
Slovic, P. (1987). Perception of risk. Science, 236(4799), 280-285. doi:10.1126/science.3563507
Slovic, P. (2010). The feeling of risk: New perspectives on risk perception. London: Earthscan.
Smyth, C. (2012, June 19th). Big food names refuse to join ‘traffic lights’ scheme. The Times, Retrieved from http://www.thetimes.co.uk/tto/health/news/article3794559.ece Sonnenberg, L., Gelsomin, E., Levy, D. E., Riis, J., Barraclough, S., & Thorndike, A. N.
(2013). A traffic light food labeling intervention increases consumer awareness of health and healthy choices at the point-of-purchase. Preventive medicine, 1-5.
doi:10.1016/j.ypmed.2013.07.001
Swinburn, B., & Wood, A. (2013). Progress on obesity prevention over 20-years in Australia and New Zealand. Obesity reviews : an official journal of the International Association for the Study of Obesity, 14(November), 60-68. doi:10.1111/obr.12103
Verhulst, F., Hermans, D., Baeyens, F., Spruyt, A., & Eelen, P. (2006). Determinants and predictive validity of direct and indirect measures of recently acquired food attitudes. Appetite, 46(2), 137-143. doi:10.1016/j.appet.2005.11.004
Waterlander, W. E., Steenhuis, I. H., de Boer, M. R., Schuit, A. J., & Seidell, J. C. (2012). The effects of a 25% discount on fruits and vegetables: results of a randomized trial in a three-dimensional web-based supermarket. International Journal of Behavioral
Nutrition and Physical Activity. doi:10.1186/1479-5868-9-11
Wentura, D. & Degner, J. (2010). A practical guide to sequential Priming and related tasks. In B. Gawronski & B. K. Payne (Eds.), Handbook of Implicit Social