Effect of Shielding Gas on the Properties and Microstructure
of melted steel surface using a TIG Torch
P Muñoz-Escalona
a,
S Mridha
band T.N Baker
cDepartment of Mechanical and Aerospace Engineering University of Strathclyde, Glasgow, G1 1XJ, UK
a
[email protected], [email protected], [email protected]
Keywords: surface engineering, shielding gas, TIG, surface roughness.
Abstract. A surface engineering technique based on a Tungsten Inert Gas (TIG) torch was used to
melt single tracks on the surface of a micro-alloyed steel with a hardness of 150 HV. The influence of three shielding gases, argon, helium and nitrogen, on the microstructure and hardness of the re-solidified surfaces was analyzed.
In all melting techniques, the heat generated by the source is normally conducted to the substrate ahead of the torch, and has been described as ‘preheat’. This leads to a gradually higher substrate temperature, from the start to the finish of a melted surface track. The aim of this research was to analyze any inhomogeneities in the microstructure, due to ‘preheat’, which is rarely considered in the published literature. Three thermocouples were located along the melted track in order to record the temperature at three different points. An energy input of ~ 840J/mm was used in each experiment and the results show that the maximum temperature recorded by the last thermocouple,
No three (subjected to the preheat), for argon, helium and nitrogen gas was 590 ºC, 1120º C and 740
ºC respectively, where a difference of 150 ºC and 200 ºC was registered between the first and third thermocouples when using helium and nitrogen respectively. The corresponding hardness values were 170 HV, 162 HV and 225 HV, and the corresponding surface roughness values were 6 µm, 12 µm and 25µm. A decrease of almost 60% in the roughness value was observed between the initial and last stage of the melted track, when using argon as shielding gas.
Introduction
The application of surface engineering techniques to improve the surface properties of carbon steels using high powered lasers for transformation hardening [1] and surface melting [2-4] is well established. More recently, a TIG torch technique has been explored for the surface modification of steels as a much cheaper option to lasers [5-8]. Both techniques require a gaseous atmosphere,
usually CO2, Ar, He or mixture of these gases, to protect the molten surface from dissolving
Therefore it is essential that the surface treatment produces a modified layer of such a thickness that it still provides the improved properties, such as wear or erosion resistance, over the life-time of the component. This research is a prerequisite to a wider study of TIG processing to create modified surfaces by powder alloying techniques having a superior wear and erosion properties.
Experimental Method
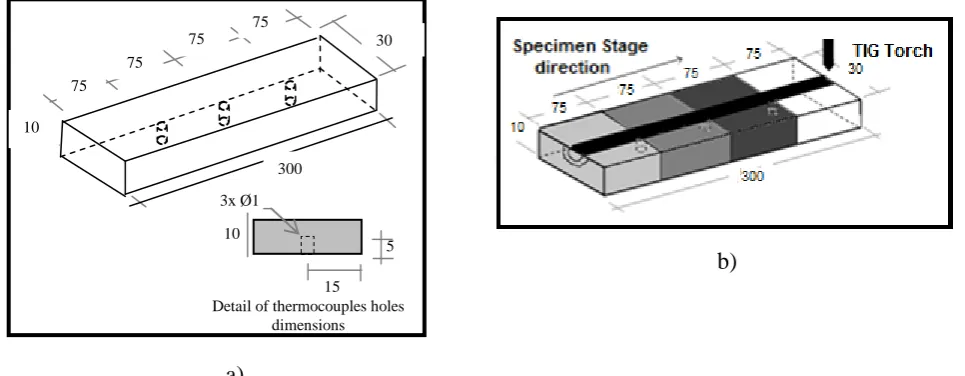
A surface engineering technique based on a Tungsten Inert Gas (TIG) torch was used to study the influence of three different shielding gases, argon, helium and nitrogen, on the microstructure and hardness of a microalloyed steel. The microalloyed steel substrate, with composition of 0.1C-0.7Mn-0.05Cu-0.05Nb (all in wt. %) was determined using a Glow Discharge Optical Emission Spectrometer, model Horiba GD-OES profilometer. The substrate, with dimensions, 300 x 30 x 10 mm, had three holes of 1 mm diameter and 5 mm depth drilled from the underside of the 10 mm thick substrate to place three thermocouples. These holes divided the melted track into four sections of 75 mm each, Fig. 1a.
A Miller Dynastry 300DX TIG equipment was used to generate an arc with a 2.4 mm diameter thoriated tungsten electrode. The electrode was direct current negative and the tip of the electrode was placed 1 mm above the specimen surface. Each sample was melted on the surface as shown in Fig. 1b. The current (I), the voltage (V), the speed (s), were changed as shown in Table 1 in order to guarantee a constant energy input (E) of ~ 840 J/mm along the melt track when using the different shielding gases at a constant flow rate of 10 L/min. Table 2 gives the thermal properties of the microalloyed steel and the shielding gases used in this research.
b)
[image:2.595.57.540.420.608.2]a)
Figure 1. Schematic TIG melted surface. a) Sample’s dimensions and location of thermocouple b) location of melted track and welding direction
The energy input was calculated using Eq. 1.
E=η VI/s (1)
where η is the efficiency of energy absorption, which was taken as 48% for a TIG process [20] Detail of thermocouples holes
dimensions 15
5 3x Ø1
10 75
75 75
75
10
300
During the melting process, the temperatures were recorded by thermocouples Type K, and once the melting process was completed, the samples were allowed to cool at room temperature prior to microstructural determination and microhardness analysis. Each sample was analyzed just beyond the location of each thermocouple, giving a total of three specimens from each sample. Specimens were prepared for metallographic analysis using the conditions described in ASTM E3-01 standards
Table 1. Conditions used in the experiment
Sample (Gas) I [A] V [v] s [mm/s] E [J/mm]
Argon 80 11 0.5 840
Nitrogen 80 22 1 845
[image:3.595.145.453.597.756.2]Helium 97 18 1 840
Table 2. Thermal properties of the parent material and shielding gases used in this research
Property Parent
material
Argon Nitrogen Helium
Density [Kg/m3] 7850 1.661 1.165 0.169
Specific heat [kJ /Kg K] 0.49 0.520 1.040 5.190
Thermal conductivity [W/m K] 54.00 0.016 0.024 0.143
First ionization potential [eV] 15.80 14.50 24.58
.
Microhardness measurements were conducted following the procedures detailed in BS 1043-2 1993 and BS6507-1 1998, using a Mitutoyo MVK G1 microhardness tester with 200gf load and a 15s delay.
Readings were taken on the specimen cross-section, of the fusion zone (FZ), the heat affected zone (HAZ) and the parent material (PM), starting at 0.1 mm from the fusion zone edge and taking measurements in a vertical distance at 0.2 mm apart, towards the centre of the specimen parent material, as seen in Figure 2.
A Mitutoyo Taylor surf SV-2000 was used to measure the surface roughness of the three different
sections of the melted track following the ASME B46.1 standards. Each (Ra) value of roughness
was obtained using a sample length (cut-off) of 2.5 mm, covering a measuring length of 15 mm. It must be highlighted that due to the roughness of the melted track not all the sections could be measured, as the diamond point used for the measurement could be damaged.
Results and Discussion
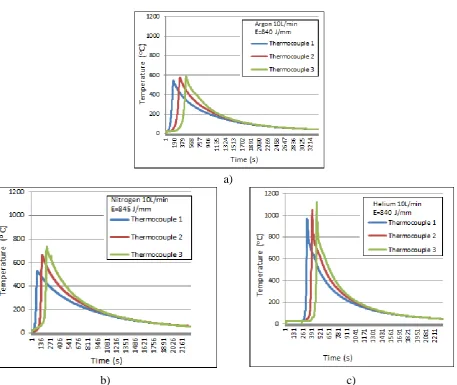
Figure 3 shows the temperatures registered by the thermocouples when using the different shielding gases with an energy input of ~ 840J/mm, while Table 3 shows the maximum values of the temperature registered from each thermocouple under different operational conditions.
a)
[image:4.595.69.527.270.655.2]b) c)
Table 3. Maximum values of temperature registered by each thermocouple located at different positions in the melted track.
Temperature [oC]
Shielding gas Thermocouple 1
(75 mm)
Thermocouple 2 (150 mm)
Thermocouple 3 (225 mm)
Argon 545 575 590
Nitrogen 530 660 740
Helium 970 1050 1120
When analysing Table 3, it is observed, as expected, that all the samples recorded a higher temperature at the end of the melted track which was registered by thermocouple 3; this is due to the preheating process the samples were subjected to during the melting of the track.
Also, it is observed that argon registered the smallest increment between the recorded temperatures of thermocouple 1 (75 mm) and that of thermocouple 3 (225 mm), when compared to nitrogen and
helium. For argon the temperature difference between these two thermocouples is 45 oC and for
nitrogen and helium is 210 oC and 150 oC respectively. This result is associated with the smaller
[image:5.595.69.527.504.767.2]values of specific heat and thermal conductivity of argon compared with nitrogen and helium.
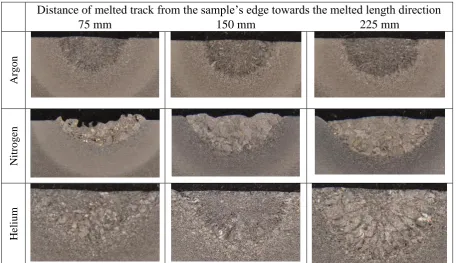
Figure 4 shows selected cross-sectional areas of the melted region for specimens obtained at 75 mm, 150 mm and 225 mm positions, respectively, from the start of melting, along the direction of the melt track. As observed, in general argon and helium presented a consistent regular cross-sectional area along the whole track. The sample associated with nitrogen as shielding gas resulted in a very irregular melt pool shape at the start of melting (75 mm from sample’s edge); however the cross-sectional area started to improve at 150 mm. Also an increase of the fusion zone is observed for the three conditions, as the distance from the sample’s edge towards the melted direction is increased. This is probably due to the final section of the melted track being subjected to a preheat process [10].
Distance of melted track from the sample’s edge towards the melted length direction
75 mm 150 mm 225 mm
A
rgon
N
it
rogen
He
li
um
The dimensions of the fusion zone at different distances from the sample’s edge are reported in Table 4. Analyzing Table 4, it is observed that in general, there is an increase in the fusion zone dimensions when moving from the sample’s edge towards the end of the melted track. It is observed that nitrogen and helium produced a fusion zone 80-85% wider and 50-85% deeper compared to the fusion zone of the sample protected with argon. This is due to the fact that these gases have a specific heat and thermal conductivity higher than the argon, as seen in Table 2. Also these results are in agreement with previous research [21], where the influence of the welding parameters on the fusion zone dimensions was highlighted. In this case, it must be noticed that despite the fact that the heat input was constant for all conditions (~ 840J/mm) to achieve this value, the arc current and voltage varied to obtain arc stability, depending on the shielding gas used; as observed, a wider fusion zone was obtained when using nitrogen as the shielding gas, where the value of voltage was the highest (22V). However, a deeper fusion zone was obtained when using helium as the shielding gas. Here, the value of arc current was the highest (97A). Also, it is well established, that adding argon or helium in the shielding gas, reduces defects, due to their higher thermal conductivity, which allows more heat to be transferred to the substrate, providing improved fusion and slower cooling rates, which results in slower freezing rates, allowing more time for entrapped gases to escape [9].
Table 4. Dimensions of the fusion zone at different distances from the sample’s edge towards the end of the melted track
Shielding gas
Width Depth
75 mm 150 mm 225 mm 75 mm 150 mm 225 mm
Argon 3.7 3.9 3.9 1.8 2.1 2.1
Nitrogen 6.1 7.1 7.9 1.7 2.6 3.2
Helium 7.3 7.3 7.5 3.6 3.6 3.9
[image:6.595.71.508.595.672.2]The average hardness of the fusion zone, the heat affected zone and the parent material along the melted track are show in Table 5.
Table 5. Average Vickers hardness (HV) of the melted track
Shielding gas Fusion zone HAZ Parent material
[HV]
Argon 164 160 153
Nitrogen 220 190 150
Helium 160 157 150
As observed when analysing Table 5, the fusion zone reached the highest hardness values, followed by the HAZ and finally the parent material regardless of the melted conditions. It can be seen that the lowest values of hardness were obtained when using helium. This was expected, as this sample
reached the highest values of temperatures (910-1120 oC), producing the slowest cooling rates,
Distance from the sample’s edge towards the melt length
75 mm 225 mm
Ar
gon
165 HV 163HV
Nitroge
n
230 HV 215HV
He
li
um
[image:7.595.53.566.81.685.2]170 HV 150 HV
Both Jönsson et al. [22], welding mild steel, and Galloway et al. [23], welding stainless steel, compared the effects of shielding using argon and helium. The latter also investigated mixture of these gases, involving 15% nitrogen. Jönsson et al [22], considered that the key factor in the different behavior was their thermal conductivity, which they related to the first ionization potential of the gases. Galloway et al. [24] showed a clear relation between the plate maximum temperature and the proportional ionization potential of their gas mixture, which is supported by this research. However, it is of interest to note that the hardness levels of the fusion zone, shown in Table 5 and Figure 5, do not follow the respective ionization potential (IP) shown in Table 2, and maximum temperatures given in Table 3.
It is observed in Figure 5, that a coarser microstructure was obtained at the end of the track for
samples melted under nitrogen and helium. This is due to the difference in temperatures registered in these points (75 mm and 225 mm) as a consequence of the preheating process. When analyzing the microstructures for the sample protected with argon, no significant changes are observed
between the start and the end of the melted track. In this case, the increase of temperature of 65 oC
was insufficient to produce any significant changes in the microstructure.
Table 6 shows the (Ra) values of roughness of the melted track obtained under different conditions.
[image:8.595.62.533.395.475.2]Due to the porosity and roughness of some of the samples, measurements were not taken to avoid damage to the diamond point of the equipment.
Table 6. Average surface roughness values obtained at different distances along the melted track
Distance Shielding gas
75 mm 150 mm 225 mm
Ra [µm]
Argon 14.4 15.7 5.9
Nitrogen - - 25.0
Helium 16.0 12.4 11.7
When analyzing Table 6, it is seen that in general a smoother surface was obtained at the end of the melted track. This is due to the fact that this last part of the sample was subjected to preheat arising from the conduction of the heat produced at the start of the melting process. As previously mentioned, argon and helium produced a melt pool of uniform cross-sectional areas along the track. The sample melted using nitrogen as the shielding gas exhibits the highest value of roughness, and this result had to do more with the porosity issues rather than with temperature changes. Here, the irregularity of the surface was so great that it was only possible to make measurements at the end of the melted track. Also, it is noted that overall, the sample shielded by argon, showed the least roughness.
Conclusions
As a prerequisite to surface engineering of a microalloyed steel to improve the resistance to wear, the influence of three different shielding gases on the microstructure and hardness of tracks melted
along the surface using a TIG torch was explored.
track needs to be higher than 65 o C. Overall; argon gives uniform melt pool with consistent cross-sectional area along the melted track and lower values of surface roughness.
Acknowledgments
The authors would like to thank Steven Black and James Kelly for their technical support in this work
References
[1] R. Bach, E Damascheck, Geissler and H.W Bergmann: Proc.3rd European conf. on Laser
Treatment of Materials (ECLAT’90), (eds, H.W.Bergmann and R.Kupfer,.), Coberg, Sprwechsaal. Publishing Group (1990), p. 265-282.
[2] J.D. Ayers and R.J Schaefer.:Proc.conf. 'Laser applications in material processes’,(ed. J. F.
Ready), Bellingham, SPIE (1979) p. 57- 64.
[3] N.B. Dahotre and. K Mukherje:. Mater. Sci. Vol. 25, (1990), p. 445-454.
[4] A.Y. Fasasi, M. Pons, C. Tassin, A. Galerie, G. Sainfort and C. Polak.: J. Mater. Sci. Vol. 29,
(1994), p. 5121-5126.
[5] S. Mridha, S.Y. Ho and S.T. Kum; Proc.of conf. Processing and Fabrication of Advanced
MaterialsVI, (eds. K.A. Khor, T.S. Srivatsan and J.J. Moore), Singapore, (1998), p. 1331-1338.
[6] S. Mridha and S. Dyuti.:Adv. Mater. Research, (2011), p. 264-265.
[7] Wang X. H, Song S.L. Zou Z.D and Qu S.Y: Mater. Sci. Eng. A, Vol. 441, (2006), p. 60-67
[8] Wang X.H, Song S.L, Qu S.Y and Zou Z.D: Surf. Coat. Technol. Vol. 201, (2007), p.
5899-5905
[9] Lyttle K.A: ‘Shielding Gases’. ASM Handbook Welding, Brazing and Soldering. Vol 6,
(1993) p. 64-69.
[10] P. Patel, S. Mridha and T.N. Baker: “Influence of Shielding Gases on Preheat Produced in Surface Coatings Incorporating SiC Particulates into Microalloy Steel using TIG Technique” in press, Materials Science and Technology, DOI: 10.1179/1743284713Y.0000000481
[11] C. Hu and T.N. Baker: Mater. Proc. Technol. Vol. 94, (1998), p. 116-122.
[12] C. Hu and T.N. Baker: Mater. Sci Eng. A. Vol. 265, (1999), p. 268-275.
[13] S. Mridha and T.N. Baker: Materials Science and Technology. Available on-line. DOI:
http://dx.doi.org/10.1179/1743284714Y.0000000530 .
[15] Information on http://www.hallite.com/upload/surface.pdf
[16] Information on http://net.grundfos.com/doc/webnet/mining/_downloads/pump-handbook.pdf
[17] Information on http://www.in-situ.co.uk/crankshaft-machining
[18] Y. Choi and R. Liu: Int. J.Mach. Tools Manu. Vol. 49, (2009), p. 683-689.
[19] E. Uhlman, J.A. Oyane del Fuentes and M. Keunecke: Thin Solid Films, Vol. 518, (2009), p. 1451-1454
[20] K.E. Easterling: ‘Introduction to the Physical Metallurgy of Welding’,
Butterworth-Heinemann, London. (1992)
[21] S.P. Tewari, A. Gupta and J. Prakash: Int. J. Eng. Sci. Technol. Vol. 2, (2010), p. 512-516
[22] P.G Jönsson, T.W Eager and J Szekely: Met. Mater. Trans. B, 26B, (1995), p. 383-395